Quantcast
Channel: Severalnines - Galera Cluster
Viewing all 210 articles
Browse latest View live

Understanding the Effects of High Latency in High Availability MySQL and MariaDB Solutions

$
0
0

High availability is a high percentage of time that the system is working and responding according to the business needs. For production database systems it is typically the highest priority to keep it close to 100%. We build database clusters to eliminate all single point of failure. If an instance becomes unavailable, another node should be able to take the workload and carry on from there. In a perfect world, a database cluster would solve all of our system availability problems. Unfortunately, while all may look good on paper, the reality is often different. So where can it go wrong?

Transactional databases systems come with sophisticated storage engines. Keeping data consistent across multiple nodes makes this task way harder. Clustering introduces a number of new variables that highly depend on network and underlying infrastructure. It is not uncommon for a standalone database instance that was running fine on a single node suddenly performs poorly in a cluster environment.

Among the number of things that can affect cluster availability, latency issues play a crucial role. However, what is the latency? Is it only related to the network?

The term "latency" actually refers to several kinds of delays incurred in the processing of data. It’s how long it takes for a piece of information to move from stage to another.

In this blog post, we’ll look at the two main high availability solutions for MySQL and MariaDB, and how they can each be affected by latency issues.

At the end of the article, we take a look at modern load balancers and discuss how they can help you address some types of latency issues.

In a previous article, my colleague Krzysztof Książek wrote about "Dealing with Unreliable Networks When Crafting an HA Solution for MySQL or MariaDB". You will find tips which can help you to design your production ready HA architecture, and avoid some of the issues described here.

Master-Slave replication for High Availability.

MySQL master-slave replication is probably the most popular database cluster type on the planet. One of the main things you want to monitor while running your master-slave replication cluster is the slave lag. Depending on your application requirements and the way how you utilize your database, the replication latency (slave lag) may determine if the data can be read from the slave node or not. Data committed on master but not yet available on an asynchronous slave means that the slave has an older state. When it’s not ok to read from a slave, you would need to go to the master, and that can affect application performance. In the worst case scenario, your system will not be able to handle all the workload on a master.

Slave lag and stale data

To check the status of the master-slave replication, you should start with below command:

SHOW SLAVE STATUS\G
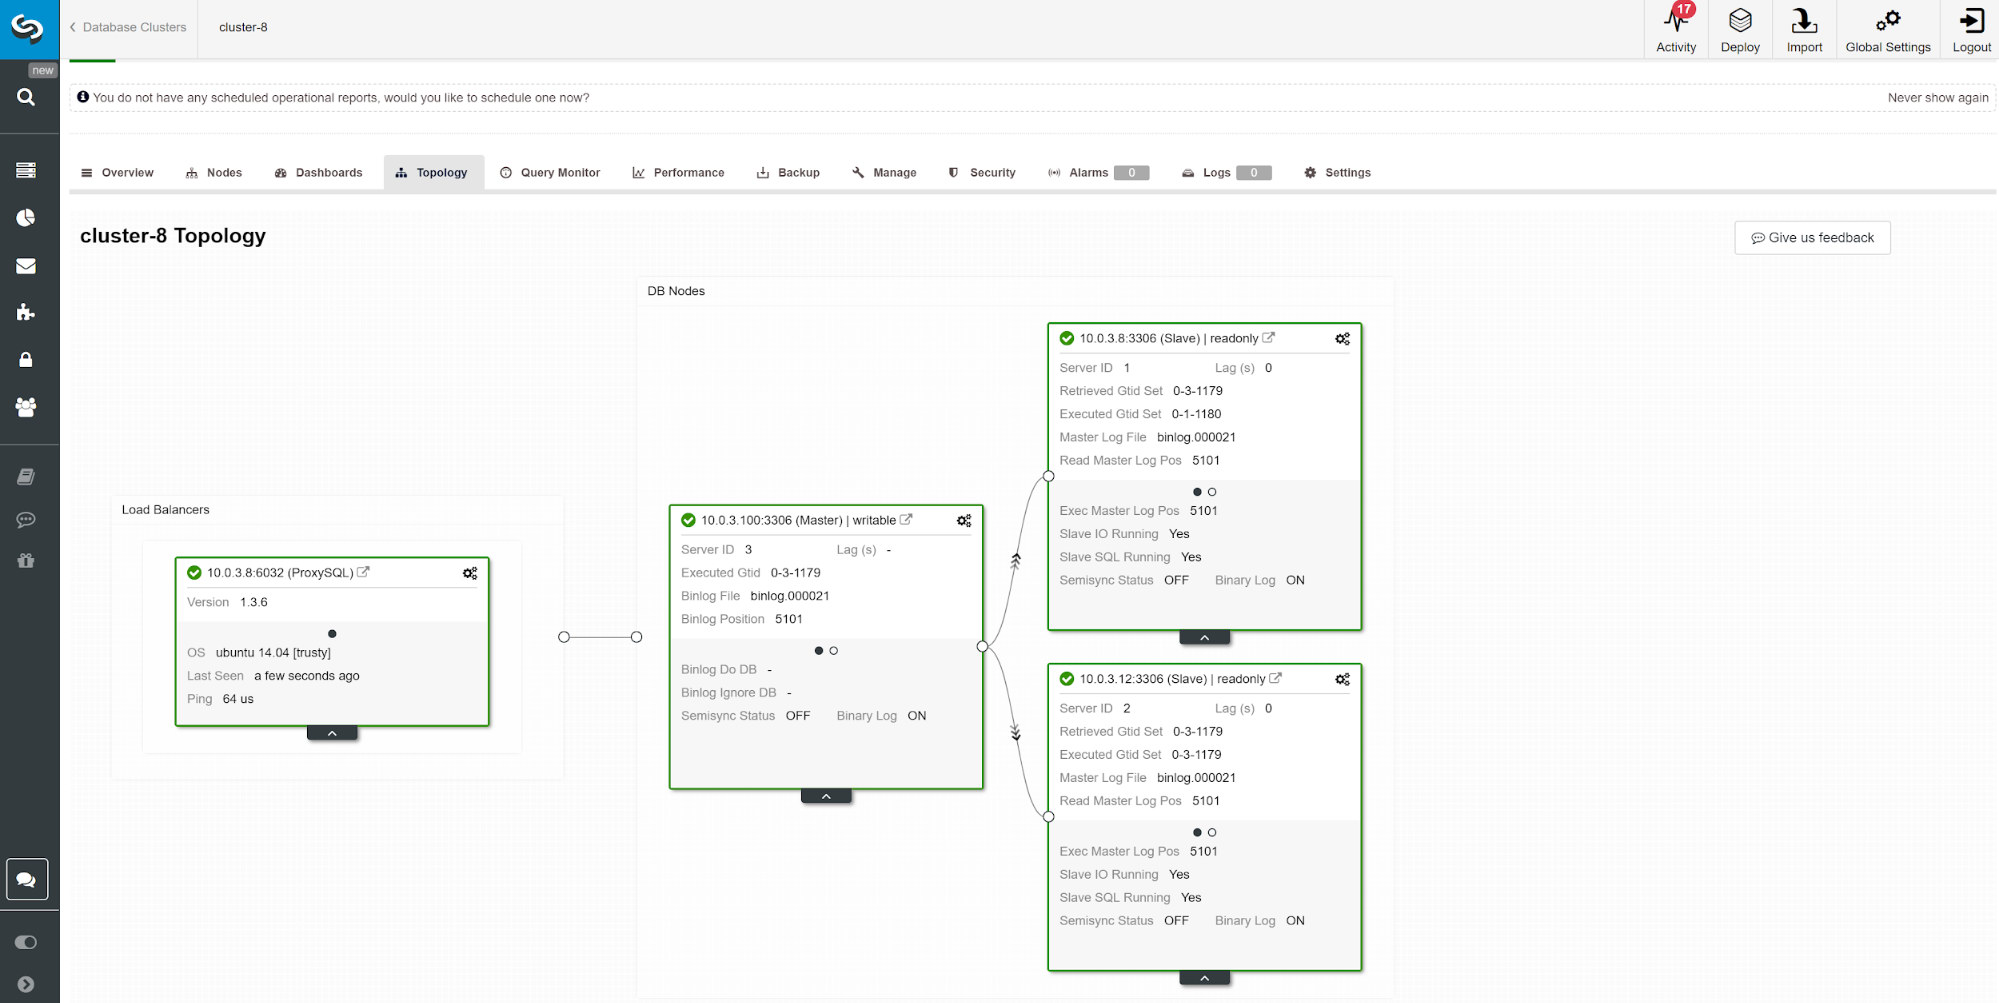
MariaDB [(none)]> show slave status\G
*************************** 1. row ***************************
               Slave_IO_State: Waiting for master to send event
                  Master_Host: 10.0.3.100
                  Master_User: rpl_user
                  Master_Port: 3306
                Connect_Retry: 10
              Master_Log_File: binlog.000021
          Read_Master_Log_Pos: 5101
               Relay_Log_File: relay-bin.000002
                Relay_Log_Pos: 809
        Relay_Master_Log_File: binlog.000021
             Slave_IO_Running: Yes
            Slave_SQL_Running: Yes
              Replicate_Do_DB: 
          Replicate_Ignore_DB: 
           Replicate_Do_Table: 
       Replicate_Ignore_Table: 
      Replicate_Wild_Do_Table: 
  Replicate_Wild_Ignore_Table: 
                   Last_Errno: 0
                   Last_Error: 
                 Skip_Counter: 0
          Exec_Master_Log_Pos: 5101
              Relay_Log_Space: 1101
              Until_Condition: None
               Until_Log_File: 
                Until_Log_Pos: 0
           Master_SSL_Allowed: No
           Master_SSL_CA_File: 
           Master_SSL_CA_Path: 
              Master_SSL_Cert: 
            Master_SSL_Cipher: 
               Master_SSL_Key: 
        Seconds_Behind_Master: 0
Master_SSL_Verify_Server_Cert: No
                Last_IO_Errno: 0
                Last_IO_Error: 
               Last_SQL_Errno: 0
               Last_SQL_Error: 
  Replicate_Ignore_Server_Ids: 
             Master_Server_Id: 3
               Master_SSL_Crl: 
           Master_SSL_Crlpath: 
                   Using_Gtid: Slave_Pos
                  Gtid_IO_Pos: 0-3-1179
      Replicate_Do_Domain_Ids: 
  Replicate_Ignore_Domain_Ids: 
                Parallel_Mode: conservative
1 row in set (0.01 sec)

Using the above information you can determine how good the overall replication latency is. The lower the value you see in "Seconds_Behind_Master", the better the data transfer speed for replication.

Another way to monitor slave lag is to use ClusterControl replication monitoring. In this screenshot we can see the replication status of asymchoronous Master-Slave (2x) Cluster with ProxySQL.

There are a number of things that can affect replication time. The most obvious is the network throughput and how much data you can transfer. MySQL comes with multiple configuration options to optimize replication process. The essential replication related parameters are:

  • Parallel apply
  • Logical clock algorithm
  • Compression
  • Selective master-slave replication
  • Replication mode

Parallel apply

It’s not uncommon to start replication tuning with enabling parallel process apply. The reason for that is by default, MySQL goes with sequential binary log apply, and a typical database server comes with several CPUs to use.

To get around sequential log apply, both MariaDB and MySQL offer parallel replication. The implementation may differ per vendor and version. E.g. MySQL 5.6 offers parallel replication as long as a schema separates the queries while MariaDB (starting version 10.0) and MySQL 5.7 both can handle parallel replication across schemas. Different vendors and versions come with their limitations and feature so always check the documentation.

Executing queries via parallel slave threads may speed up your replication stream if you are write heavy. However, if you aren’t, it would be best to stick to the traditional single-threaded replication. To enable parallel processing, change the slave_parallel_workers to the number of CPU threads you want to involve in the process. It is recommended to keep the value lower of the number of available CPU threads.

Parallel replication works best with the group commits. To check if you have group commits happening run following query.

show global status like 'binlog_%commits';

The bigger the ratio between these two values the better.

Logical clock

The slave_parallel_type=LOGICAL_CLOCK is an implementation of a Lamport clock algorithm. When using a multithreaded slave this variable specifies the method used to decide which transactions are allowed to execute in parallel on the slave. The variable has no effect on slaves for which multithreading is not enabled so make sure slave_parallel_workers is set higher than 0.

MariaDB users should also check optimistic mode introduced in version 10.1.3 as it also may give you better results.

GTID

MariaDB comes with its own implementation of GTID. MariaDB’s sequence consists of a domain, server, and transaction. Domains allow multi-source replication with distinct ID. Different domain ID’s can be used to replicate the portion of data out-of-order (in parallel). As long it’s okayish for your application this can reduce replication latency.

The similar technique applies to MySQL 5.7 which can also use the multisource master and independent replication channels.

Compression

CPU power is getting less expensive over time, so using it for binlog compression could be a good option for many database environments. The slave_compressed_protocol parameter tells MySQL to use compression if both master and slave support it. By default, this parameter is disabled.

Starting from MariaDB 10.2.3, selected events in the binary log can be optionally compressed, to save the network transfers.

Replication formats

MySQL offers several replication modes. Choosing the right replication format helps to minimize the time to pass data between the cluster nodes.

Multimaster Replication For High Availability

Some applications can not afford to operate on outdated data.

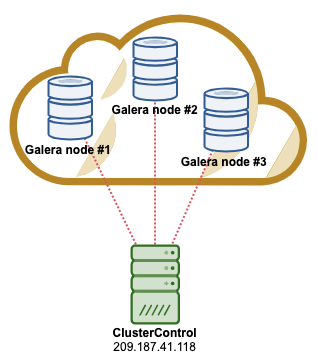
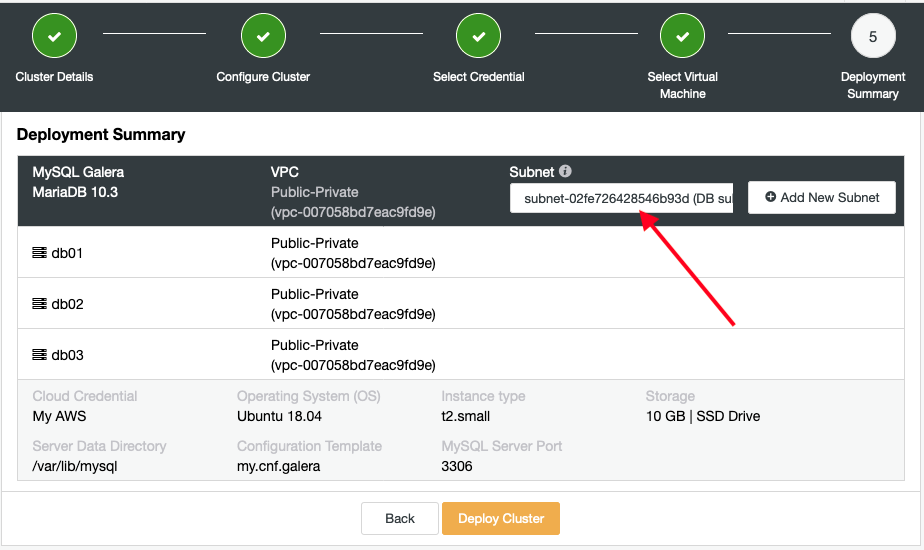
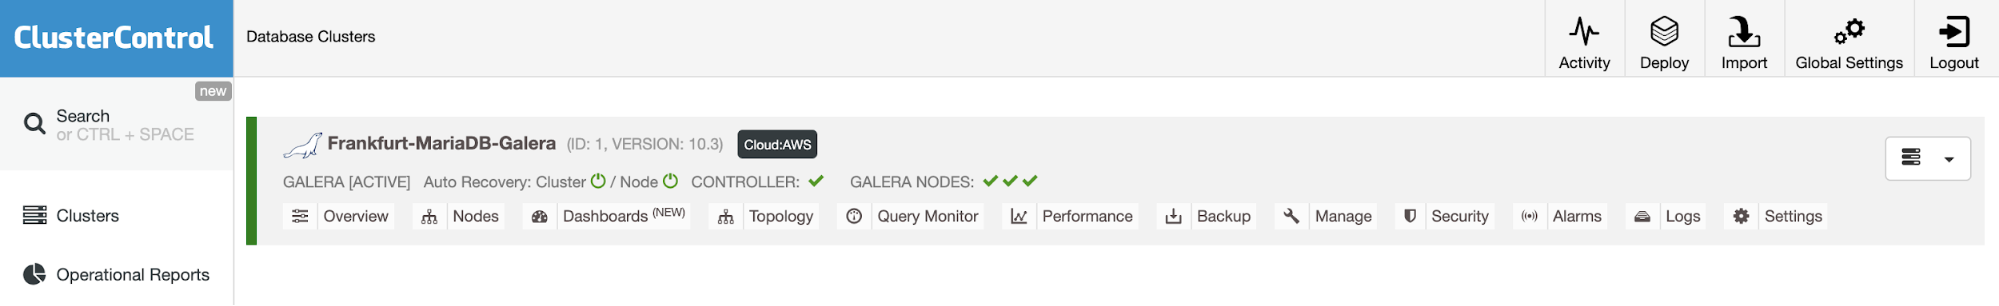
In such cases, you may want to enforce consistency across the nodes with synchronous replication. Keeping data synchronous requires an additional plugin, and for some, the best solution on the market for that is Galera Cluster.

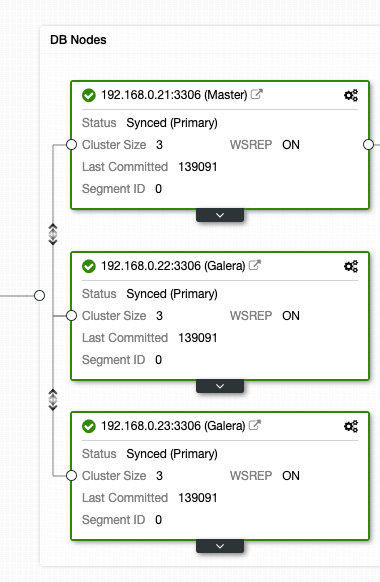
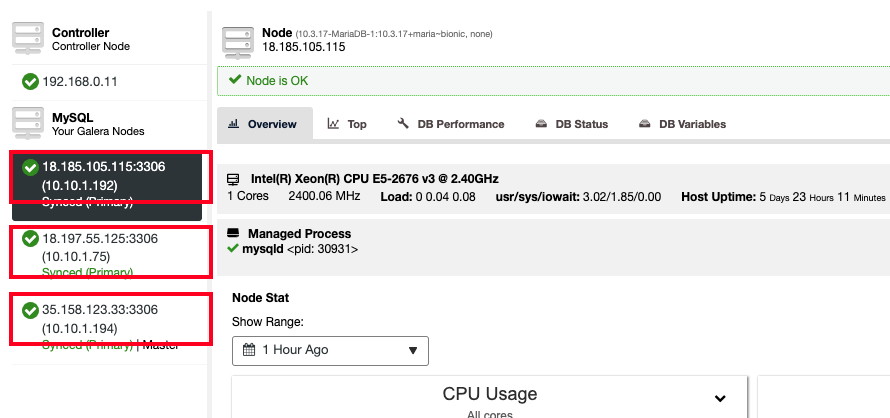
Galera cluster comes with wsrep API which is responsible of transmitting transactions to all nodes and executing them according to a cluster-wide ordering. This will block the execution of subsequent queries until the node has applied all write-sets from its applier queue. While it’s a good solution for consistency, you may hit some architectural limitations. The common latency issues can be related to:

  • The slowest node in the cluster
  • Horizontal scaling and write operations
  • Geolocated clusters
  • High Ping
  • Transaction size

The slowest node in the cluster

By design, the write performance of the cluster cannot be higher than the performance of the slowest node in the cluster. Start your cluster review by checking the machine resources and verify the configuration files to make sure they all run on the same performance settings.

Parallelization

Parallel threads do not guarantee better performance, but it may speed up the synchronization of new nodes with the cluster. The status wsrep_cert_deps_distance tells us the possible degree of parallelization. It is the value of the average distance between the highest and lowest seqno values that can be possibly applied in parallel. You can use the wsrep_cert_deps_distance status variable to determine the maximum number of slave threads possible.

Horizontal scaling

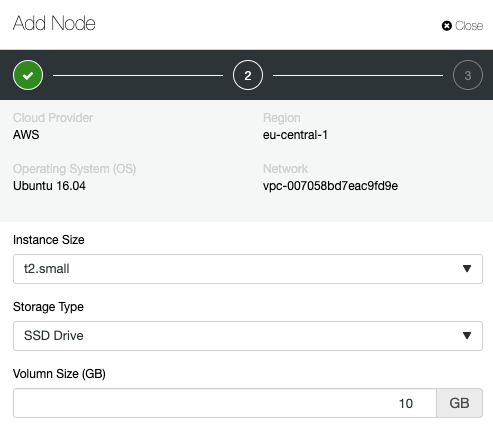
By adding more nodes in the cluster, we have fewer points that could fail; however, the information needs to go across multi-instances until it’s committed, which multiplies the response times. If you need scalable writes, consider an architecture based on sharding. A good solution can be a Spider storage engine.

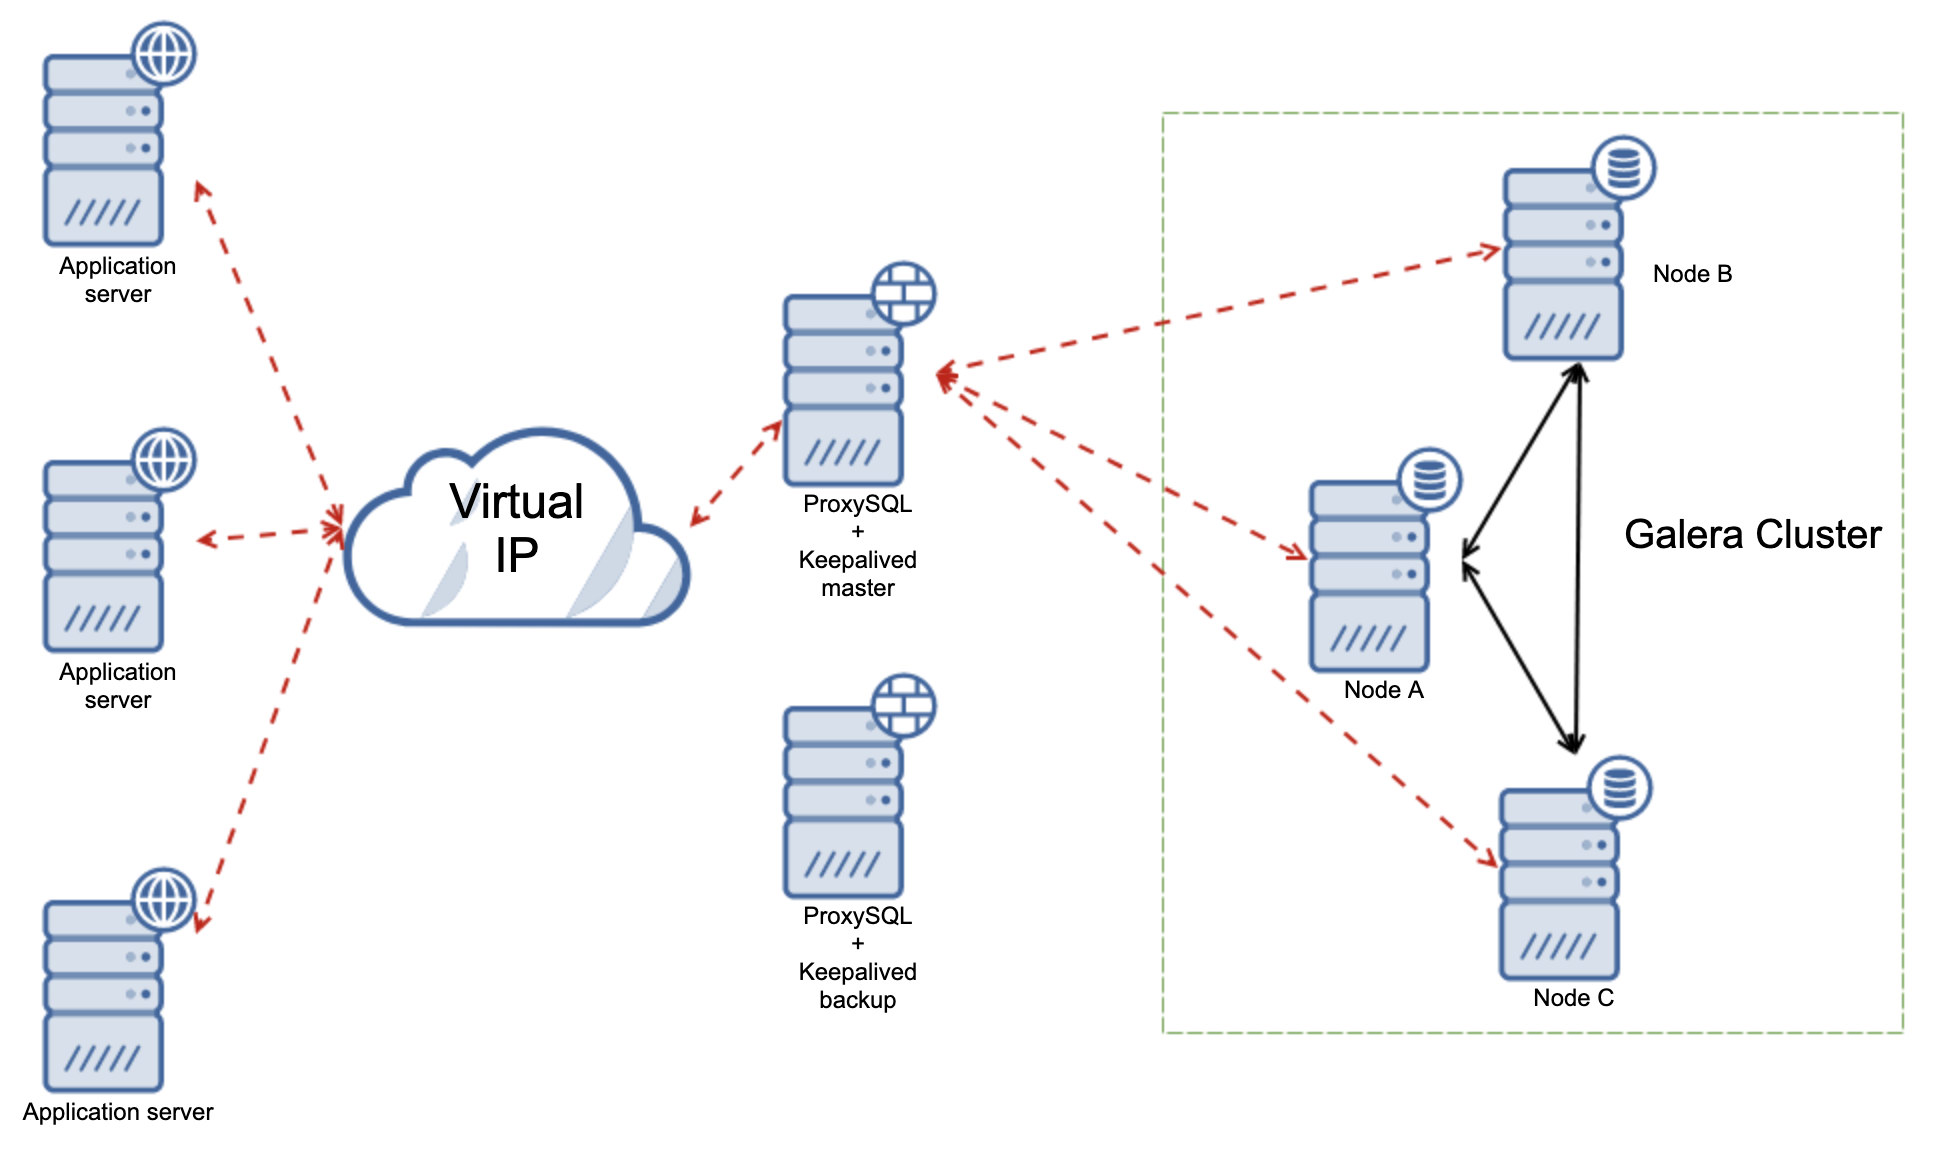
In some cases, to reduce information shared across the cluster nodes, you can consider having one writer at a time. It’s relatively easy to implement while using a load balancer. When you do this manually make sure you have a procedure to change DNS value when your writer node goes down.
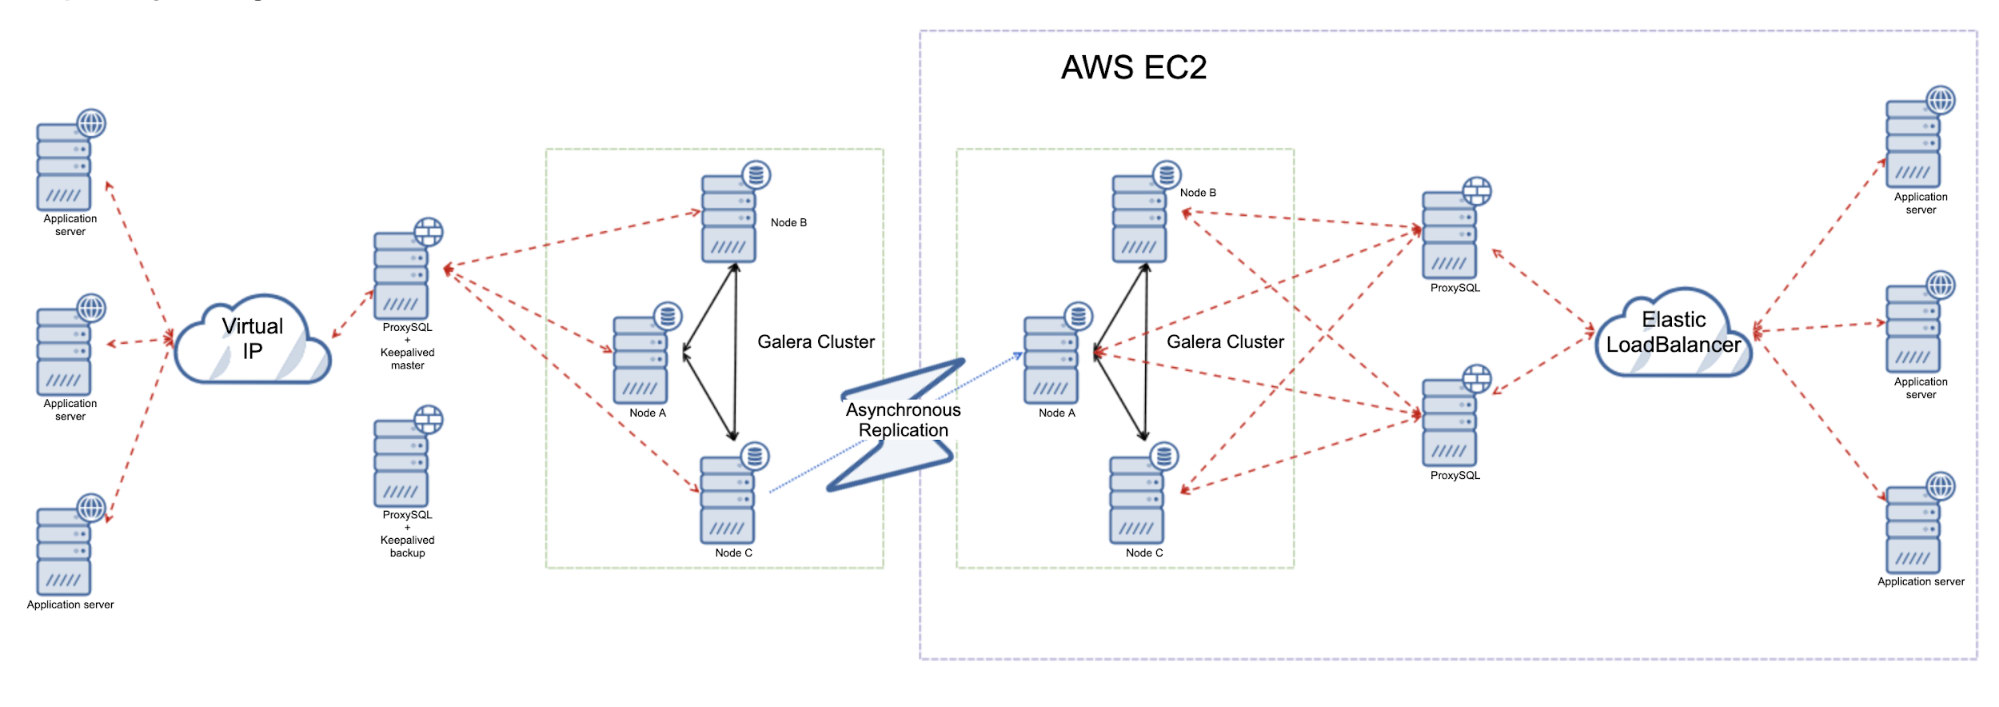
Geolocated clusters

Although Galera Cluster is synchronous, it is possible to deploy a Galera Cluster across data centers. Synchronous replication like MySQL Cluster (NDB) implements a two-phase commit, where messages are sent to all nodes in a cluster in a 'prepare' phase, and another set of messages are sent in a 'commit' phase. This approach is usually not suitable for geographically disparate nodes, because of the latencies in sending messages between nodes.

High Ping

Galera Cluster with the default settings does not handle well high network latency. If you have a network with a node that shows a high ping time, consider changing evs.send_window and evs.user_send_window parameters. These variables define the maximum number of data packets in replication at a time. For WAN setups, the variable can be set to a considerably higher value than the default value of 2. It’s common to set it to 512. These parameters are part of wsrep_provider_options.

--wsrep_provider_options="evs.send_window=512;evs.user_send_window=512"

Transaction size

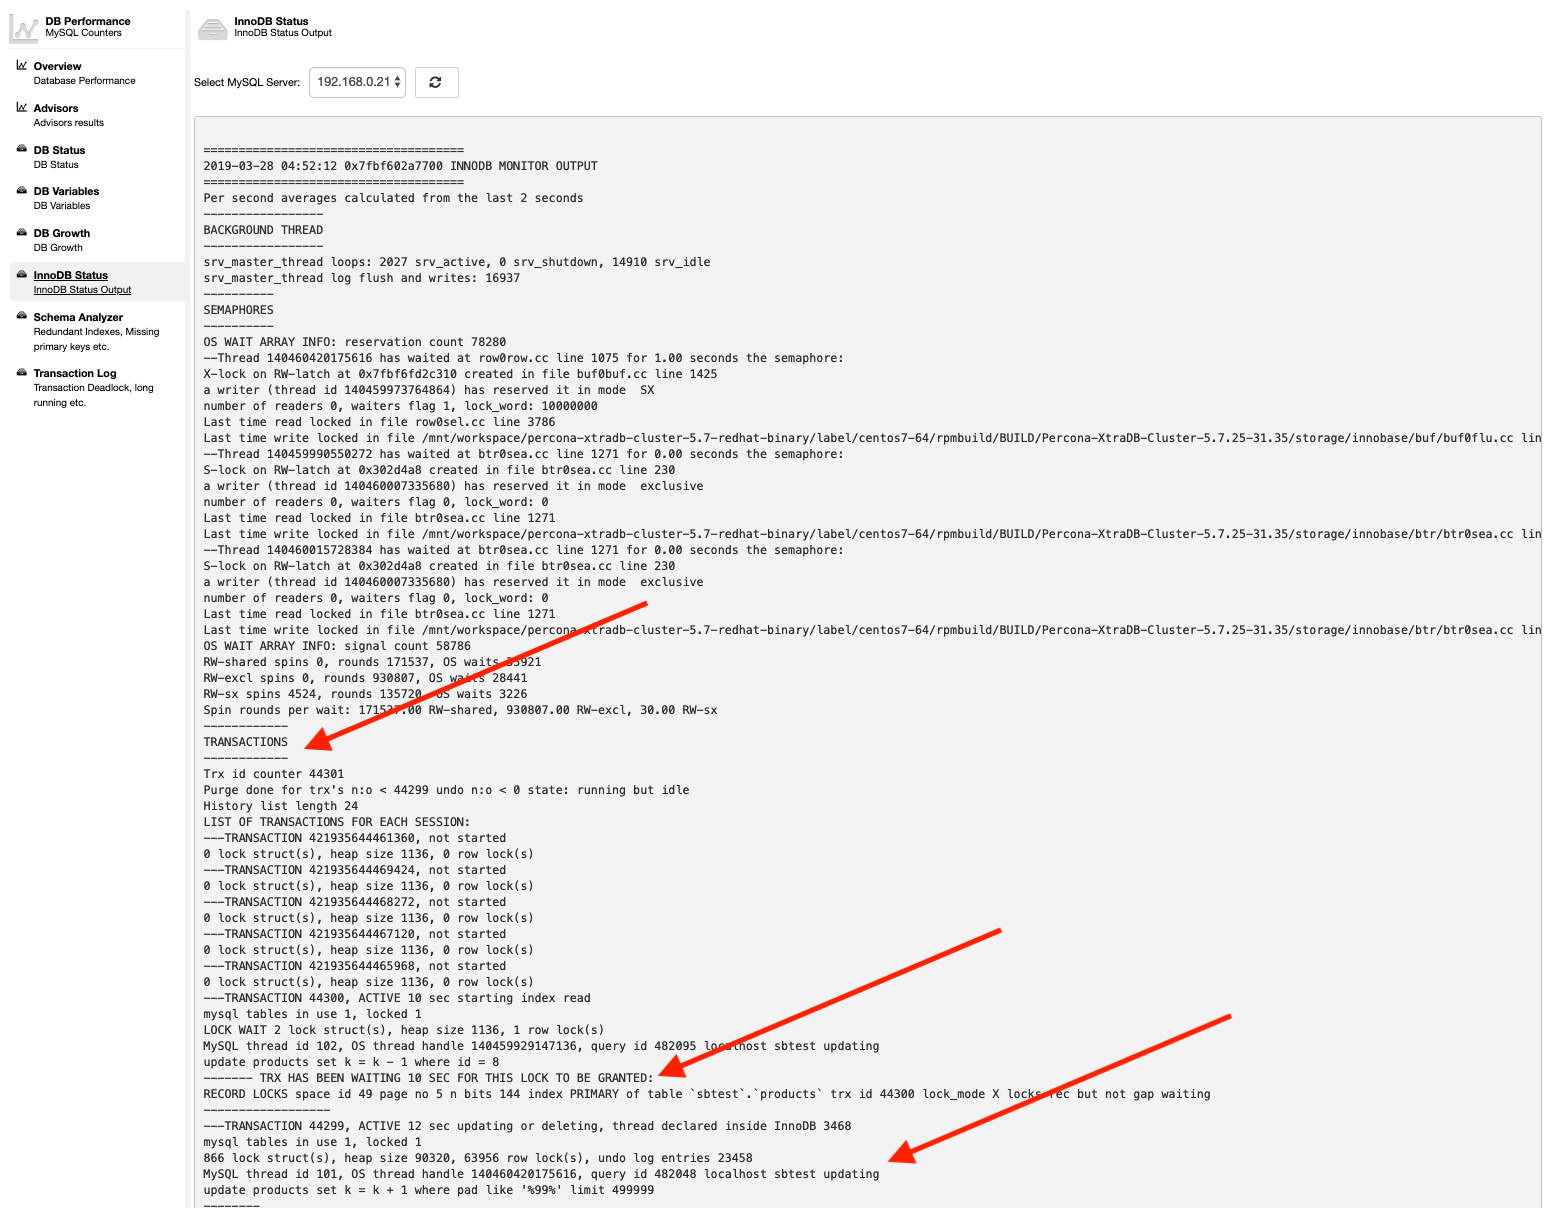
One of the things you need to consider while running Galera Cluster is the size of the transaction. Finding the balance between the transaction size, performance and Galera certification process is something you have to estimate in your application. You can find more information about that in the article How to Improve Performance of Galera Cluster for MySQL or MariaDB by Ashraf Sharif.

Load Balancer Causal Consistency Reads

Even with the minimized risk of data latency issues, standard MySQL asynchronous replication cannot guarantee consistency. It is still possible that the data is yet not replicated to slave while your application is reading it from there. Synchronous replication can solve this problem, but it has architecture limitations and may not fit your application requirements (e.g., intensive bulk writes). So how to overcome it?

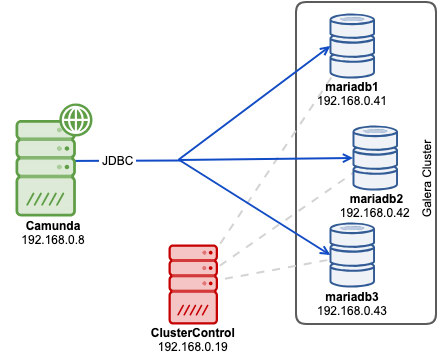
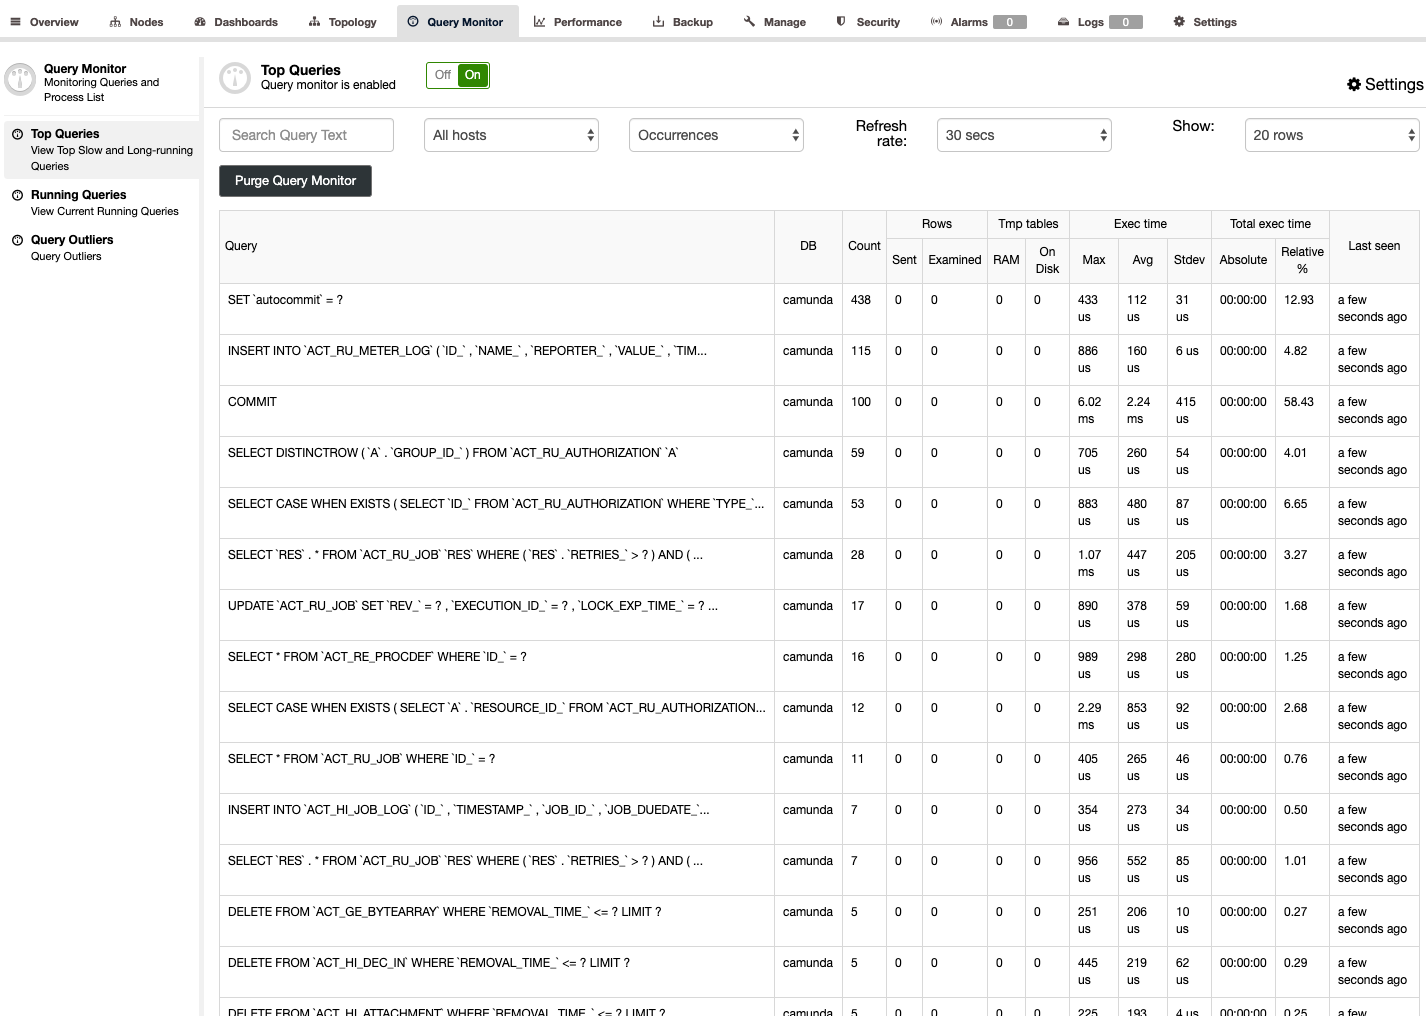
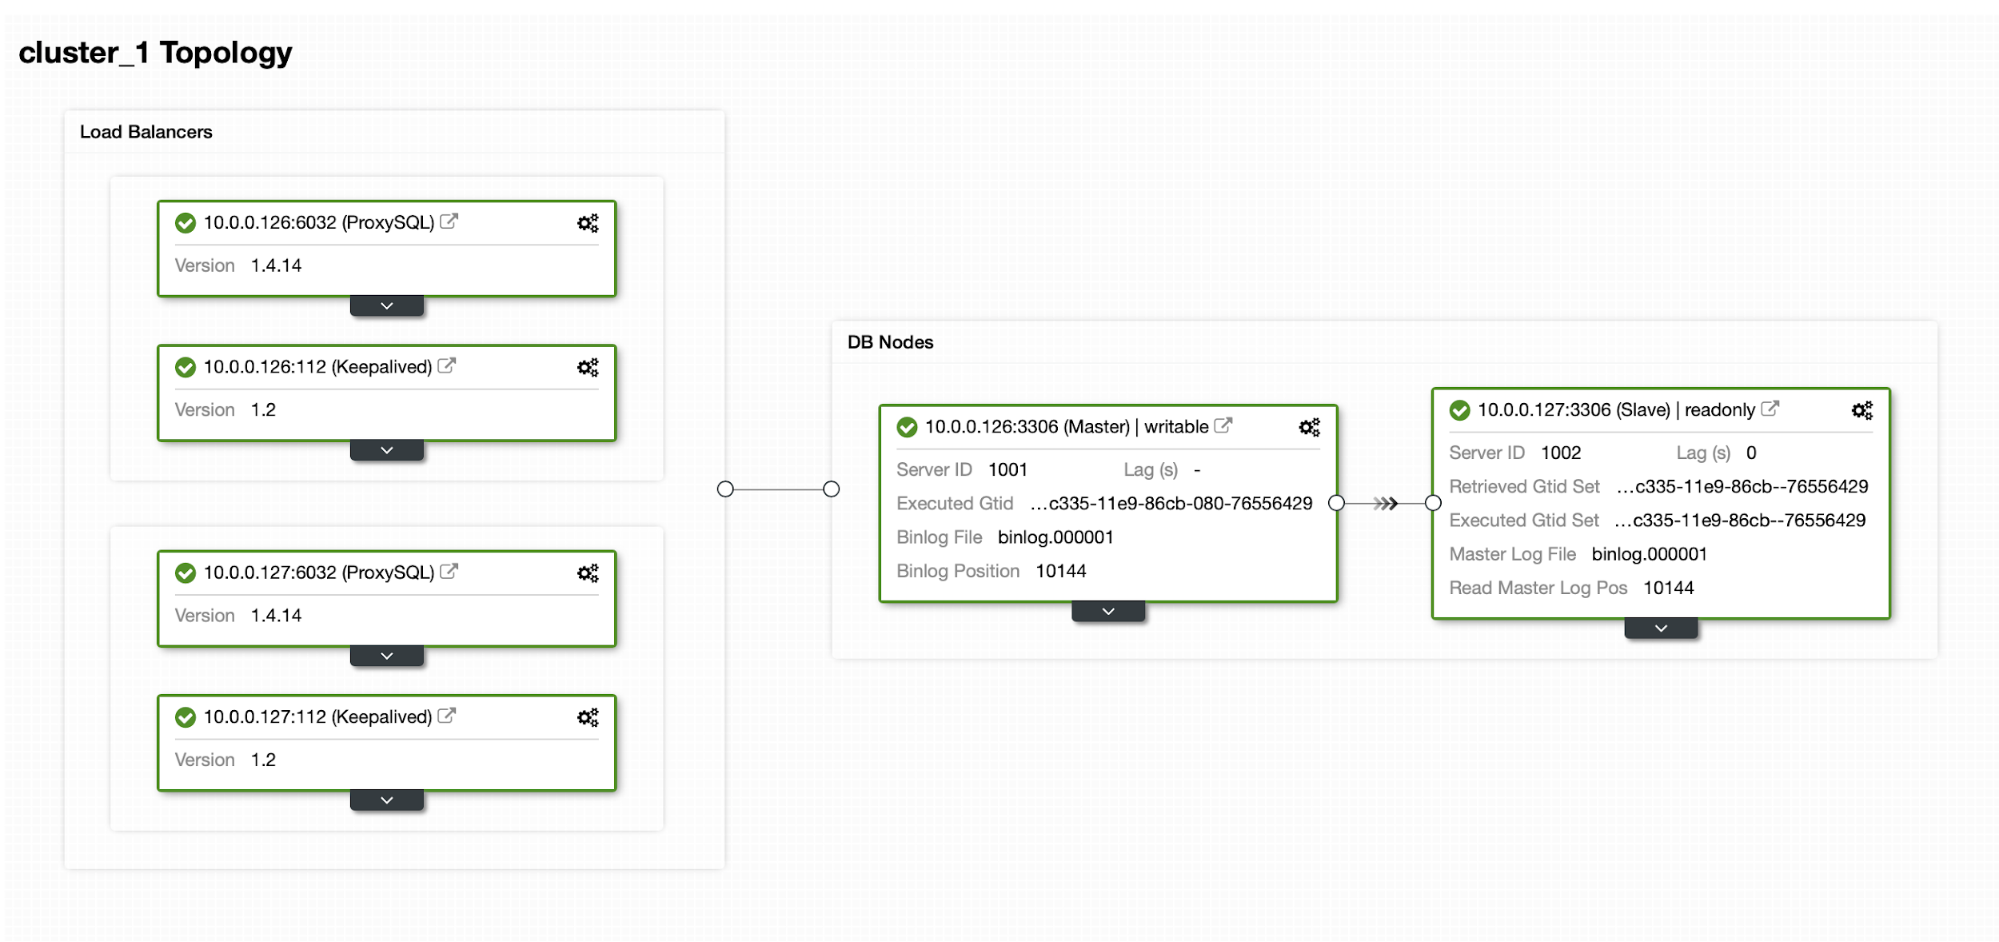
The first step to avoid stale data reading is to make the application aware of replication delay. It is usually programmed in application code. Fortunately, there are modern database load balancers with the support of adaptive query routing based on GTID tracking. The most popular are ProxySQL and Maxscale.
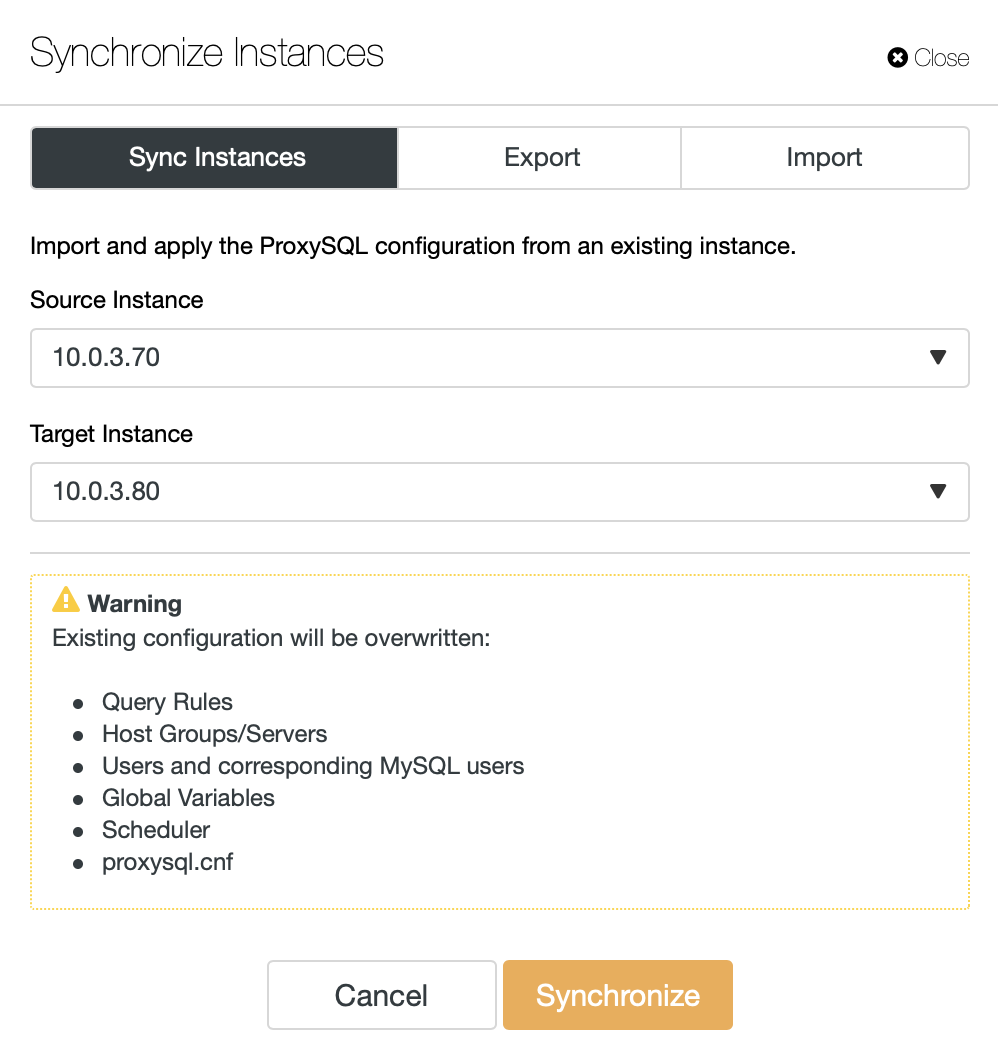
ProxySQL 2.0

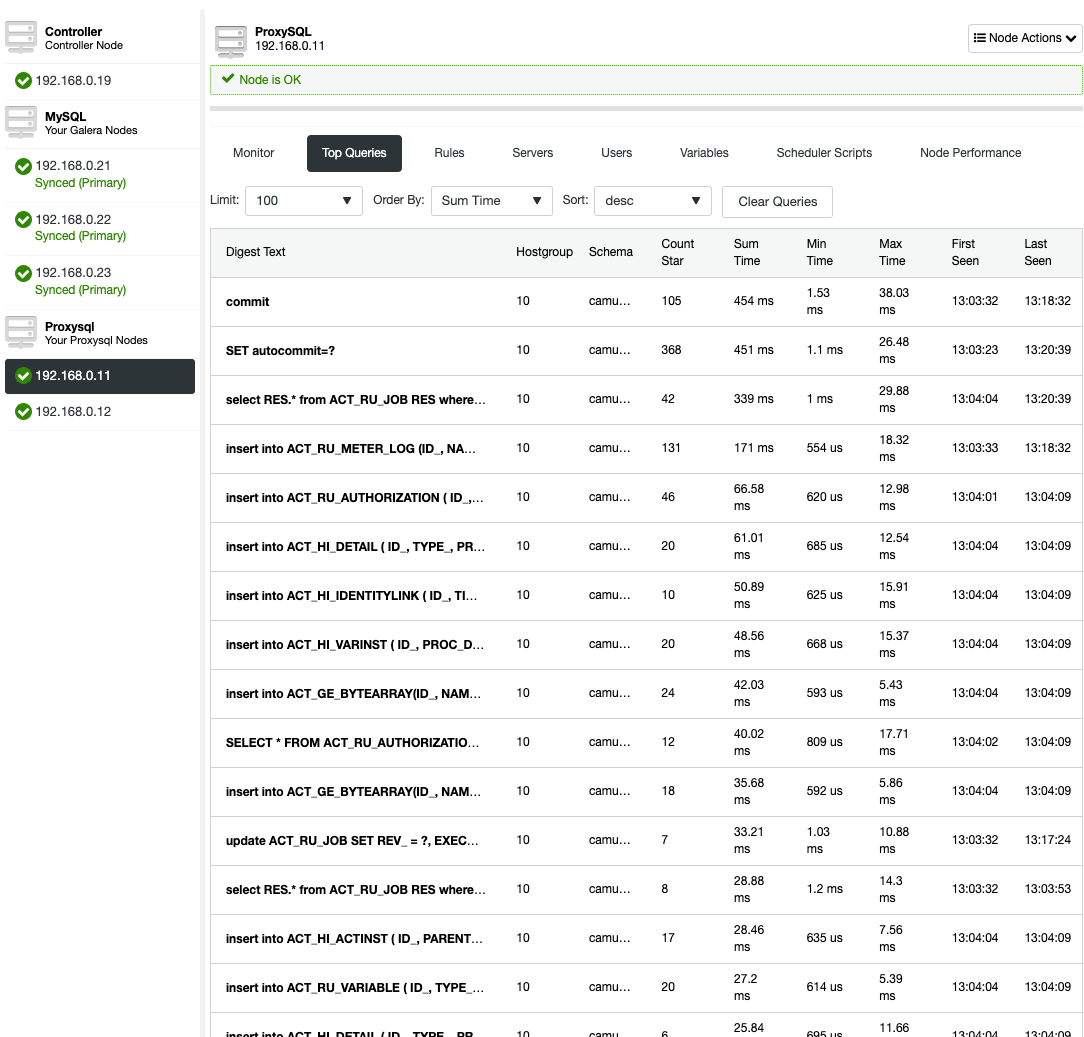
ProxySQL Binlog Reader allows ProxySQL to know in real time which GTID has been executed on every MySQL server, slaves and master itself. Thanks to this, when a client executes a reads that needs to provide causal consistency reads, ProxySQL immediately knows on which server the query can be executed. If for whatever reason the writes were not executed on any slave yet, ProxySQL will know that the writer was executed on master and send the read there.

Maxscale 2.3

MariaDB introduced casual reads in Maxscale 2.3.0. The way it works it’s similar to ProxySQL 2.0. Basically when causal_reads are enabled, any subsequent reads performed on slave servers will be done in a manner that prevents replication lag from affecting the results. If the slave has not caught up to the master within the configured time, the query will be retried on the master.


ClusterControl Tips & Tricks - Dealing with MySQL Long Running Queries

$
0
0

Long running queries/statements/transactions are sometimes inevitable in a MySQL environment. In some occasions, a long running query could be a catalyst to a disastrous event. If you care about your database, optimizing query performance and detecting long running queries must be performed regularly. Things do get harder though when multiple instances in a group or cluster are involved.

When dealing with multiple nodes, the repetitive tasks to check every single node is something that we have to avoid. ClusterControl monitors multiple aspects of your database server, including queries. ClusterControl aggregates all the query-related information from all nodes in the group or cluster to provide a centralized view of workload. Right there is a great way to understand your cluster as a whole with minimal effort.

In this blog post, we show you how to detect MySQL long running queries using ClusterControl.

Why a Query Takes Longer Time?

First of all, we have to know the nature of the query, whether it is expected to be a long running or a short running query. Some analytic and batch operations are supposed to be long running queries, so we can skip those for now. Also, depending on the table size, modifying table structure with ALTER command can be a long running operation.

For a short-span transaction, it should be executed as fast as possible, usually in a matter of subsecond. The shorter the better. This comes with a set of query best-practice rules that users have to follow, like use proper indexing in WHERE or JOIN statement, using the right storage engine, picking proper data types, scheduling the batch operation during off-peak hours, offloading analytical/reporting traffic to dedicated replicas, and so on.

There are a number of things that may cause a query to take longer time to execute:

  • Inefficient query - Use non-indexed columns while lookup or joining, thus MySQL takes longer time to match the condition.
  • Table lock - The table is locked, by global lock or explicit table lock when the query is trying to access it.
  • Deadlock - A query is waiting to access the same rows that are locked by another query.
  • Dataset does not fit into RAM - If your working set data fits into that cache, then SELECT queries will usually be relatively fast.
  • Suboptimal hardware resources - This could be slow disks, RAID rebuilding, saturated network etc.
  • Maintenance operation - Running mysqldump can bring huge amounts of otherwise unused data into the buffer pool, and at the same time the (potentially useful) data that is already there will be evicted and flushed to disk.

The above list emphasizes it is not only the query itself that causes all sorts of problems. There are plenty of reasons which require looking at different aspects of a MySQL server. In some worse-case scenario, a long running query could cause a total service disruption like server down, server crash and connections maxing out. If you see a query takes longer than usual to execute, do investigate it.

How to Check?

PROCESSLIST

MySQL provides a number of built-in tools to check the long running transaction. First of all, SHOW PROCESSLIST or SHOW FULL PROCESSLIST commands can expose the running queries in real-time. Here is a screenshot of ClusterControl Running Queries feature, similar to SHOW FULL PROCESSLIST command (but ClusterControl aggregates all the process into one view for all nodes in the cluster):

As you can see, we can immediately see the offensive query right away from the output. But how often do we stare at those processes? This is only useful if you are aware of the long running transaction. Otherwise, you wouldn't know until something happens - like connections are piling up, or the server is getting slower than usual.

Slow Query Log

Slow query log captures slow queries (SQL statements that take more than long_query_time seconds to execute), or queries that do not use indexes for lookups (log_queries_not_using_indexes). This feature is not enabled by default and to enable it simply set the following lines and restart the MySQL server:

[mysqld]
slow_query_log=1
long_query_time=0.1
log_queries_not_using_indexes=1

The slow query log can be used to find queries that take a long time to execute and are therefore candidates for optimization. However, examining a long slow query log can be a time-consuming task. There are tools to parse MySQL slow query log files and summarize their contents like mysqldumpslow, pt-query-digest or ClusterControl Top Queries.

ClusterControl Top Queries summarizes the slow query using two methods - MySQL slow query log or Performance Schema:

You can easily see a summary of the normalized statement digests, sorted based on a number of criteria:

  • Host
  • Occurrences
  • Total execution time
  • Maximum execution time
  • Average execution time
  • Standard deviation time

We have covered this feature in great detail in this blog post, How to use the ClusterControl Query Monitor for MySQL, MariaDB and Percona Server.

Performance Schema

Performance Schema is a great tool available for monitoring MySQL Server internals and execution details at a lower level. The following tables in Performance Schema can be used to find slow queries:

  • events_statements_current
  • events_statements_history
  • events_statements_history_long
  • events_statements_summary_by_digest
  • events_statements_summary_by_user_by_event_name
  • events_statements_summary_by_host_by_event_name

MySQL 5.7.7 and higher includes the sys schema, a set of objects that helps DBAs and developers interpret data collected by the Performance Schema into more easily understandable form. Sys schema objects can be used for typical tuning and diagnosis use cases.

ClusterControl provides advisors, which are mini-programs that you can write using ClusterControl DSL (similar to JavaScript) to extend the ClusterControl monitoring capabilities custom to your needs. There are a number of scripts included based on Performance Schema that you can use to monitor query performance like I/O wait, lock wait time and so on. For example under Manage -> Developer Studio, go to s9s -> mysql -> p_s -> top_tables_by_iowait.js and click "Compile and Run" button. You should see the output under Messages tab for top 10 tables sorted by I/O wait per server:

There are a number of scripts that you can use to understand low-level information where and why the slowness happens like top_tables_by_lockwait.js, top_accessed_db_files.js and so on.

ClusterControl - Detecting and alerting upon long running queries

With ClusterControl, you will get additional powerful features that you won't find in the standard MySQL installation. ClusterControl can be configured to proactively monitor the running processes, and raise an alarm and send notification to the user if long query threshold is exceeded. This can be configured by using the Runtime Configuration under Settings:

For pre1.7.1, the default value for query_monitor_alert_long_running_query is false. We encourage user to enable this by setting it to 1 (true). To make it persistent, add the following line into /etc/cmon.d/cmon_X.cnf:

query_monitor_alert_long_running_query=1
query_monitor_long_running_query_ms=30000

Any changes made in the Runtime Configuration is applied immediately and no restart required. You will see something like this under the Alarms section if a query exceeds 30000ms (30 seconds) thresholds:

If you configure the mail recipient settings as "Deliver" for the DbComponent plus CRITICAL severity category (as shown in the following screenshot):

You should get a copy of this alarm in your email. Otherwise, it can be forwarded manually by clicking on the "Send Email" button.

Furthermore, you can filter out any kind of processlist resources that match certain criteria with regular expression (regex). For example, if you want ClusterControl to detect long running query for three MySQL users called 'sbtest', 'myshop' and 'db_user1', the following should do:

Any changes made in the Runtime Configuration is applied immediately and no restart required.

Additionally, ClusterControl will list out all deadlock transactions together with the InnoDB status when it was happening under Performance -> Transaction Log:

This feature is not enabled by default, due to deadlock detection will affect CPU usage on database nodes. To enable it, simply tick the "Enable Transaction Log" checkbox and specify the interval that you want. To make it persistent, add variable with value in seconds inside /etc/cmon.d/cmon_X.cnf:

db_deadlock_check_interval=30

Similarly, if you want to check out the InnoDB status, simply go to Performance -> InnoDB Status, and choose the MySQL server from the dropdown. For example:

There we go - all the required information is easily retrievable in a couple of clicks.

Summary

Long running transactions could lead to performance degradation, server down, connections maxed out and deadlocks. With ClusterControl, you can detect long running queries directly from the UI, without the need to examine every single MySQL node in the cluster.

Database High Availability for Camunda BPM using MySQL or MariaDB Galera Cluster

$
0
0

Camunda BPM is an open-source workflow and decision automation platform. Camunda BPM ships with tools for creating workflow and decision models, operating deployed models in production, and allowing users to execute workflow tasks assigned to them.

By default, Camunda comes with an embedded database called H2, which works pretty decently within a Java environment with relatively small memory footprint. However, when it comes to scaling and high availability, there are other database backends that might be more appropriate.

In this blog post, we are going to deploy Camunda BPM 7.10 Community Edition on Linux, with a focus on achieving database high availability. Camunda supports major databases through JDBC drivers, namely Oracle, DB2, MySQL, MariaDB and PostgreSQL. This blog only focuses on MySQL and MariaDB Galera Cluster, with different implementation on each - one with ProxySQL as database load balancer, and the other using the JDBC driver to connect to multiple database instances. Take note that this article does not cover on high availability for the Camunda application itself.

Prerequisite

Camunda BPM runs on Java. In our CentOS 7 box, we have to install JDK and the best option is to use the one from Oracle, and skip using the OpenJDK packages provided in the repository. On the application server where Camunda should run, download the latest Java SE Development Kit (JDK) from Oracle by sending the acceptance cookie:

$ wget --header "Cookie: oraclelicense=accept-securebackup-cookie" https://download.oracle.com/otn-pub/java/jdk/12+33/312335d836a34c7c8bba9d963e26dc23/jdk-12_linux-x64_bin.rpm

Install it on the host:

$ yum localinstall jdk-12_linux-x64_bin.rpm

Verify with:

$ java --version
java 12 2019-03-19
Java(TM) SE Runtime Environment (build 12+33)
Java HotSpot(TM) 64-Bit Server VM (build 12+33, mixed mode, sharing)

Create a new directory and download Camunda Community for Apache Tomcat from the official download page:

$ mkdir ~/camunda
$ cd ~/camunda
$ wget --content-disposition 'https://camunda.org/release/camunda-bpm/tomcat/7.10/camunda-bpm-tomcat-7.10.0.tar.gz'

Extract it:

$ tar -xzf camunda-bpm-tomcat-7.10.0.tar.gz

There are a number of dependencies we have to configure before starting up Camunda web application. This depends on the chosen database platform like datastore configuration, database connector and CLASSPATH environment. The next sections explain the required steps for MySQL Galera (using Percona XtraDB Cluster) and MariaDB Galera Cluster.

Note that the configurations shown in this blog are based on Apache Tomcat environment. If you are using JBOSS or Wildfly, the datastore configuration will be a bit different. Refer to Camunda documentation for details.

MySQL Galera Cluster (with ProxySQL and Keepalived)

We will use ClusterControl to deploy MySQL-based Galera cluster with Percona XtraDB Cluster. There are some Galera-related limitations mentioned in the Camunda docs surrounding Galera multi-writer conflicts handling and InnoDB isolation level. In case you are affected by these, the safest way is to use the single-writer approach, which is achievable with ProxySQL hostgroup configuration. To provide no single-point of failure, we will deploy two ProxySQL instances and tie them with a virtual IP address by Keepalived.

The following diagram illustrates our final architecture:

First, deploy a three-node Percona XtraDB Cluster 5.7. Install ClusterControl, generate a SSH key and setup passwordless SSH from ClusterControl host to all nodes (including ProxySQL). On ClusterControl node, do:

$ whoami
root
$ ssh-keygen -t rsa
$ for i in 192.168.0.21 192.168.0.22 192.168.0.23 192.168.0.11 192.168.0.12; do ssh-copy-id $i; done

Before we deploy our cluster, we have to modify the MySQL configuration template file that ClusterControl will use when installing MySQL servers. The template file name is my57.cnf.galera and located under /usr/share/cmon/templates/ on the ClusterControl host. Make sure the following lines exist under [mysqld] section:

[mysqld]
...
transaction-isolation=READ-COMMITTED
wsrep_sync_wait=7
...

Save the file and we are good to go. The above are the requirements as stated in Camunda docs, especially on the supported transaction isolation for Galera. Variable wsrep_sync_wait is set to 7 to perform cluster-wide causality checks for READ (including SELECT, SHOW, and BEGIN or START TRANSACTION), UPDATE, DELETE, INSERT, and REPLACE statements, ensuring that the statement is executed on a fully synced node. Keep in mind that value other than 0 can result in increased latency.

Go to ClusterControl -> Deploy -> MySQL Galera and specify the following details (if not mentioned, use the default value):

  • SSH User: root
  • SSH Key Path: /root/.ssh/id_rsa
  • Cluster Name: Percona XtraDB Cluster 5.7
  • Vendor: Percona
  • Version: 5.7
  • Admin/Root Password: {specify a password}
  • Add Node: 192.168.0.21 (press Enter), 192.168.0.22 (press Enter), 192.168.0.23 (press Enter)

Make sure you got all the green ticks, indicating ClusterControl is able to connect to the node passwordlessly. Click "Deploy" to start the deployment.

Create the database, MySQL user and password on one of the database nodes:

mysql> CREATE DATABASE camunda;
mysql> CREATE USER camunda@'%' IDENTIFIED BY 'passw0rd';
mysql> GRANT ALL PRIVILEGES ON camunda.* TO camunda@'%';

Or from the ClusterControl interface, you can use Manage -> Schema and Users instead:

Once cluster is deployed, install ProxySQL by going to ClusterControl -> Manage -> Load Balancer -> ProxySQL -> Deploy ProxySQL and enter the following details:

  • Server Address: 192.168.0.11
  • Administration Password:
  • Monitor Password:
  • DB User: camunda
  • DB Password: passw0rd
  • Are you using implicit transactions?: Yes

Repeat the ProxySQL deployment step for the second ProxySQL instance, by changing the Server Address value to 192.168.0.12. The virtual IP address provided by Keepalived requires at least two ProxySQL instances deployed and running. Finally, deploy virtual IP address by going to ClusterControl -> Manage -> Load Balancer -> Keepalived and pick both ProxySQL nodes and specify the virtual IP address and network interface for the VIP to listen:

Our database backend is now complete. Next, import the SQL files into the Galera Cluster as the created MySQL user. On the application server, go to the "sql" directory and import them into one of the Galera nodes (we pick 192.168.0.21):

$ cd ~/camunda/sql/create
$ yum install mysql #install mysql client
$ mysql -ucamunda -p -h192.168.0.21 camunda < mysql_engine_7.10.0.sql
$ mysql -ucamunda -p -h192.168.0.21 camunda < mysql_identity_7.10.0.sql

Camunda does not provide MySQL connector for Java since its default database is H2. On the application server, download MySQL Connector/J from MySQL download page and copy the JAR file into Apache Tomcat bin directory:

$ wget https://dev.mysql.com/get/Downloads/Connector-J/mysql-connector-java-8.0.15.tar.gz
$ tar -xzf mysql-connector-java-8.0.15.tar.gz
$ cd mysql-connector-java-8.0.15
$ cp mysql-connector-java-8.0.15.jar ~/camunda/server/apache-tomcat-9.0.12/bin/

Then, set the CLASSPATH environment variable to include the database connector. Open setenv.sh using text editor:

$ vim ~/camunda/server/apache-tomcat-9.0.12/bin/setenv.sh

And add the following line:

export CLASSPATH=$CLASSPATH:$CATALINA_HOME/bin/mysql-connector-java-8.0.15.jar

Open ~/camunda/server/apache-tomcat-9.0.12/conf/server.xml and change the lines related to datastore. Specify the virtual IP address as the MySQL host in the connection string, with ProxySQL port 6033:

<Resource name="jdbc/ProcessEngine"
              ...
              driverClassName="com.mysql.jdbc.Driver" 
              defaultTransactionIsolation="READ_COMMITTED"
              url="jdbc:mysql://192.168.0.10:6033/camunda"
              username="camunda"  
              password="passw0rd"
              ...
/>

Finally, we can start the Camunda service by executing start-camunda.sh script:

$ cd ~/camunda
$ ./start-camunda.sh
starting camunda BPM platform on Tomcat Application Server
Using CATALINA_BASE:   ./server/apache-tomcat-9.0.12
Using CATALINA_HOME:   ./server/apache-tomcat-9.0.12
Using CATALINA_TMPDIR: ./server/apache-tomcat-9.0.12/temp
Using JRE_HOME:        /
Using CLASSPATH:       :./server/apache-tomcat-9.0.12/bin/mysql-connector-java-8.0.15.jar:./server/apache-tomcat-9.0.12/bin/bootstrap.jar:./server/apache-tomcat-9.0.12/bin/tomcat-juli.jar
Tomcat started.

Make sure the CLASSPATH shown in the output includes the path to the MySQL Connector/J JAR file. After the initialization completes, you can then access Camunda webapps on port 8080 at http://192.168.0.8:8080/camunda/. The default username is demo with password 'demo':

You can then see the digested capture queries from Nodes -> ProxySQL -> Top Queries, indicating the application is interacting correctly with the Galera Cluster:

There is no read-write splitting configured for ProxySQL. Camunda uses "SET autocommit=0" on every SQL statement to initialize transaction and the best way for ProxySQL to handle this by sending all the queries to the same backend servers of the target hostgroup. This is the safest method alongside better availability. However, all connections might end up reaching a single server, so there is no load balancing.

MariaDB Galera

MariaDB Connector/J is able to handle a variety of connection modes - failover, sequential, replication and aurora - but Camunda only supports failover and sequential. Taken from MariaDB Connector/J documentation:

ModeDescription
sequential
(available since 1.3.0)
This mode supports connection failover in a multi-master environment, such as MariaDB Galera Cluster. This mode does not support load-balancing reads on slaves. The connector will try to connect to hosts in the order in which they were declared in the connection URL, so the first available host is used for all queries. For example, let's say that the connection URL is the following:
jdbc:mariadb:sequential:host1,host2,host3/testdb
When the connector tries to connect, it will always try host1 first. If that host is not available, then it will try host2. etc. When a host fails, the connector will try to reconnect to hosts in the same order.
failover
(available since 1.2.0)
This mode supports connection failover in a multi-master environment, such as MariaDB Galera Cluster. This mode does not support load-balancing reads on slaves. The connector performs load-balancing for all queries by randomly picking a host from the connection URL for each connection, so queries will be load-balanced as a result of the connections getting randomly distributed across all hosts.

Using "failover" mode poses a higher potential risk of deadlock, since writes will be distributed to all backend servers almost equally. Single-writer approach is a safe way to run, which means using sequential mode should do the job pretty well. You also can skip the load-balancer tier in the architecture. Hence with MariaDB Java connector, we can deploy our architecture as simple as below:

Before we deploy our cluster, modify the MariaDB configuration template file that ClusterControl will use when installing MariaDB servers. The template file name is my.cnf.galera and located under /usr/share/cmon/templates/ on ClusterControl host. Make sure the following lines exist under [mysqld] section:

[mysqld]
...
transaction-isolation=READ-COMMITTED
wsrep_sync_wait=7
performance_schema = ON
...

Save the file and we are good to go. A bit of explanation, the above list are the requirements as stated in Camunda docs, especially on the supported transaction isolation for Galera. Variable wsrep_sync_wait is set to 7 to perform cluster-wide causality checks for READ (including SELECT, SHOW, and BEGIN or START TRANSACTION), UPDATE, DELETE, INSERT, and REPLACE statements, ensuring that the statement is executed on a fully synced node. Keep in mind that value other than 0 can result in increased latency. Enabling Performance Schema is optional for ClusterControl query monitoring feature.

Now we can start the cluster deployment process. Install ClusterControl, generate a SSH key and setup passwordless SSH from ClusterControl host to all Galera nodes. On ClusterControl node, do:

$ whoami
root
$ ssh-keygen -t rsa
$ for i in 192.168.0.41 192.168.0.42 192.168.0.43; do ssh-copy-id $i; done

Go to ClusterControl -> Deploy -> MySQL Galera and specify the following details (if not mentioned, use the default value):

  • SSH User: root
  • SSH Key Path: /root/.ssh/id_rsa
  • Cluster Name: MariaDB Galera 10.3
  • Vendor: MariaDB
  • Version: 10.3
  • Admin/Root Password: {specify a password}
  • Add Node: 192.168.0.41 (press Enter), 192.168.0.42 (press Enter), 192.168.0.43 (press Enter)

Make sure you got all the green ticks when adding nodes, indicating ClusterControl is able to connect to the node passwordlessly. Click "Deploy" to start the deployment.

Create the database, MariaDB user and password on one of the Galera nodes:

mysql> CREATE DATABASE camunda;
mysql> CREATE USER camunda@'%' IDENTIFIED BY 'passw0rd';
mysql> GRANT ALL PRIVILEGES ON camunda.* TO camunda@'%';

For ClusterControl user, you can use ClusterControl -> Manage -> Schema and Users instead:

Our database cluster deployment is now complete. Next, import the SQL files into the MariaDB cluster. On the application server, go to the "sql" directory and import them into one of the MariaDB nodes (we chose 192.168.0.41):

$ cd ~/camunda/sql/create
$ yum install mysql #install mariadb client
$ mysql -ucamunda -p -h192.168.0.41 camunda < mariadb_engine_7.10.0.sql
$ mysql -ucamunda -p -h192.168.0.41 camunda < mariadb_identity_7.10.0.sql

Camunda does not provide MariaDB connector for Java since its default database is H2. On the application server, download MariaDB Connector/J from MariaDB download page and copy the JAR file into Apache Tomcat bin directory:

$ wget https://downloads.mariadb.com/Connectors/java/connector-java-2.4.1/mariadb-java-client-2.4.1.jar
$ cp mariadb-java-client-2.4.1.jar ~/camunda/server/apache-tomcat-9.0.12/bin/

Then, set the CLASSPATH environment variable to include the database connector. Open setenv.sh via text editor:

$ vim ~/camunda/server/apache-tomcat-9.0.12/bin/setenv.sh

And add the following line:

export CLASSPATH=$CLASSPATH:$CATALINA_HOME/bin/mariadb-java-client-2.4.1.jar

Open ~/camunda/server/apache-tomcat-9.0.12/conf/server.xml and change the lines related to datastore. Use the sequential connection protocol and list out all the Galera nodes separated by comma in the connection string:

<Resource name="jdbc/ProcessEngine"
              ...
              driverClassName="org.mariadb.jdbc.Driver" 
              defaultTransactionIsolation="READ_COMMITTED"
              url="jdbc:mariadb:sequential://192.168.0.41:3306,192.168.0.42:3306,192.168.0.43:3306/camunda"
              username="camunda"  
              password="passw0rd"
              ...
/>

Finally, we can start the Camunda service by executing start-camunda.sh script:

$ cd ~/camunda
$ ./start-camunda.sh
starting camunda BPM platform on Tomcat Application Server
Using CATALINA_BASE:   ./server/apache-tomcat-9.0.12
Using CATALINA_HOME:   ./server/apache-tomcat-9.0.12
Using CATALINA_TMPDIR: ./server/apache-tomcat-9.0.12/temp
Using JRE_HOME:        /
Using CLASSPATH:       :./server/apache-tomcat-9.0.12/bin/mariadb-java-client-2.4.1.jar:./server/apache-tomcat-9.0.12/bin/bootstrap.jar:./server/apache-tomcat-9.0.12/bin/tomcat-juli.jar
Tomcat started.

Make sure the CLASSPATH shown in the output includes the path to the MariaDB Java client JAR file. After the initialization completes, you can then access Camunda webapps on port 8080 at http://192.168.0.8:8080/camunda/. The default username is demo with password 'demo':

You can see the digested capture queries from ClusterControl -> Query Monitor -> Top Queries, indicating the application is interacting correctly with the MariaDB Cluster:

With MariaDB Connector/J, we do not need load balancer tier which simplifies our overall architecture. The sequential connection mode should do the trick to avoid multi-writer deadlocks - which can happen in Galera. This setup provides high availability with each Camunda instance configured with JDBC to access the cluster of MySQL or MariaDB nodes. Galera takes care of synchronizing the data between the database instances in real time.

How to Deploy Open Source Databases - New Whitepaper

$
0
0

We’re happy to announce that our new whitepaper How to Deploy Open Source Databases is now available to download for free!

Choosing which DB engine to use between all the options we have today is not an easy task. An that is just the beginning. After deciding which engine to use, you need to learn about it and actually deploy it to play with it. We plan to help you on that second step, and show you how to install, configure and secure some of the most popular open source DB engines.

In this whitepaper we are going to explore the top open source databases and how to deploy each technology using proven methodologies that are battle-tested.

Topics included in this whitepaper are …

  • An Overview of Popular Open Source Databases
    • Percona
    • MariaDB
    • Oracle MySQL
    • MongoDB
    • PostgreSQL
  • How to Deploy Open Source Databases
    • Percona Server for MySQL
    • Oracle MySQL Community Server
      • Group Replication
    • MariaDB
      • MariaDB Cluster Configuration
    • Percona XtraDB Cluster
    • NDB Cluster
    • MongoDB
    • Percona Server for MongoDB
    • PostgreSQL
  • How to Deploy Open Source Databases by Using ClusterControl
    • Deploy
    • Scaling
    • Load Balancing
    • Management   

Download the whitepaper today!

ClusterControl
Single Console for Your Entire Database Infrastructure
Find out what else is new in ClusterControl

About ClusterControl

ClusterControl is the all-inclusive open source database management system for users with mixed environments that removes the need for multiple management tools. ClusterControl provides advanced deployment, management, monitoring, and scaling functionality to get your MySQL, MongoDB, and PostgreSQL databases up-and-running using proven methodologies that you can depend on to work. At the core of ClusterControl is it’s automation functionality that lets you automate many of the database tasks you have to perform regularly like deploying new databases, adding and scaling new nodes, running backups and upgrades, and more.

To learn more about ClusterControl click here.

About Severalnines

Severalnines provides automation and management software for database clusters. We help companies deploy their databases in any environment, and manage all operational aspects to achieve high-scale availability.

Severalnines' products are used by developers and administrators of all skill levels to provide the full 'deploy, manage, monitor, scale' database cycle, thus freeing them from the complexity and learning curves that are typically associated with highly available database clusters. Severalnines is often called the “anti-startup” as it is entirely self-funded by its founders. The company has enabled over 32,000 deployments to date via its popular product ClusterControl. Currently counting BT, Orange, Cisco, CNRS, Technicolor, AVG, Ping Identity and Paytrail as customers. Severalnines is a private company headquartered in Stockholm, Sweden with offices in Singapore, Japan and the United States. To see who is using Severalnines today visit, https://www.severalnines.com/company.

Benchmarking Manual Database Deployments vs Automated Deployments

$
0
0

There are multiple ways of deploying a database. You can install it by hand, you can rely on the widely available infrastructure orchestration tools like Ansible, Chef, Puppet or Salt. Those tools are very popular and it is quite easy to find scripts, recipes, playbooks, you name it, which will help you automate the installation of a database cluster. There are also more specialized database automation platforms, like ClusterControl, which can also be used to automated deployment. What would be the best way of deploying your cluster? How much time you will actually need to deploy it?

First, let us clarify what we want to do. Let’s assume we will be deploying Percona XtraDB Cluster 5.7. It will consist of three nodes and for that we will use three Vagrant virtual machines running Ubuntu 16.04 (bento/ubuntu-16.04 image). We will attempt to deploy a cluster manually, then using Ansible and ClusterControl. Let’s see how the results will look like.

Manual Deployment

Repository Setup - 1 minute, 45 seconds.

First of all, we have to configure Percona repositories on all Ubuntu nodes. Quick google search, ssh into the virtual machines and running required commands takes 1m45s

We found the following page with instructions:
https://www.percona.com/doc/percona-repo-config/percona-release.html

and we executed steps described in “DEB-BASED GNU/LINUX DISTRIBUTIONS” section. We also ran apt update, to refresh apt’s cache.

Installing PXC Nodes - 2 minutes 45 seconds

This step basically consists of executing:

root@vagrant:~# apt install percona-xtradb-cluster-5.7

The rest is mostly dependent on your internet connection speed as packages are being downloaded. Your input will also be needed (you’ll be passing a password for the superuser) so it is not unattended installation. When everything is done, you will end up with three running Percona XtraDB Cluster nodes:

root     15488  0.0  0.2   4504  1788 ?        S    10:12   0:00 /bin/sh /usr/bin/mysqld_safe
mysql    15847  0.3 28.3 1339576 215084 ?      Sl   10:12   0:00  \_ /usr/sbin/mysqld --basedir=/usr --datadir=/var/lib/mysql --plugin-dir=/usr/lib/mysql/plugin --user=mysql --wsrep-provider=/usr/lib/galera3/libgalera_smm.so --log-error=/var/log/mysqld.log --pid-file=/var/run/mysqld/mysqld.pid --socket=/var/run/mysqld/mysqld.sock --wsrep_start_position=00000000-0000-0000-0000-000000000000:-1

Configuring PXC nodes - 3 minutes, 25 seconds

Here starts the tricky part. It is really hard to quantify experience and how much time one would need to actually understand what is needed to be done. What is good, google search “how to install percona xtrabdb cluster” points to Percona’s documentation, which describes how the process should look like. It still may take more or less time, depending on how familiar you are with the PXC and Galera in general. Worst case scenario you will not be aware of any additional required actions and you will connect to your PXC and start working with it, not realizing that, in fact, you have three nodes, each forming a cluster of its own.

Let’s assume we follow the recommendation from Percona and time just those steps to be executed. In short, we modified configuration files as per instructions on the Percona website, we also attempted to bootstrap the first node:

root@vagrant:~# /etc/init.d/mysql bootstrap-pxc
mysqld: [ERROR] Found option without preceding group in config file /etc/mysql/my.cnf at line 10!
mysqld: [ERROR] Fatal error in defaults handling. Program aborted!
mysqld: [ERROR] Found option without preceding group in config file /etc/mysql/my.cnf at line 10!
mysqld: [ERROR] Fatal error in defaults handling. Program aborted!
mysqld: [ERROR] Found option without preceding group in config file /etc/mysql/my.cnf at line 10!
mysqld: [ERROR] Fatal error in defaults handling. Program aborted!
mysqld: [ERROR] Found option without preceding group in config file /etc/mysql/my.cnf at line 10!
mysqld: [ERROR] Fatal error in defaults handling. Program aborted!
 * Bootstrapping Percona XtraDB Cluster database server mysqld                                                                                                                                                                                                                     ^C

This did not look correct. Unfortunately, instructions weren’t crystal clear. Again, if you don’t know what is going on, you will spend more time trying to understand what happened. Luckily, stackoverflow.com comes very helpful (although not the first response on the list that we got) and you should realise that you miss [mysqld] section header in your /etc/mysql/my.cnf file. Adding this on all nodes and repeating the bootstrap process solved the issue. In total we spent 3 minutes and 25 seconds (not including googling for the error as we noticed immediately what was the problem).

Configuring for SST, Bringing Other Nodes Into the Cluster - Starting From 8 Minutes to Infinity

The instructions on Percona web site are quite clear. Once you have one node up and running, just start remaining nodes and you will be fine. We tried that and we were unable to see more nodes joining the cluster. This is where it is virtually impossible to tell how long it will take to diagnose the issue. It took us 6-7 minutes but to be able to do it quickly you have to:

  1. Be familiar with how PXC configuration is structured:
    root@vagrant:~# tree  /etc/mysql/
    /etc/mysql/
    ├── conf.d
    │   ├── mysql.cnf
    │   └── mysqldump.cnf
    ├── my.cnf -> /etc/alternatives/my.cnf
    ├── my.cnf.fallback
    ├── my.cnf.old
    ├── percona-xtradb-cluster.cnf
    └── percona-xtradb-cluster.conf.d
        ├── client.cnf
        ├── mysqld.cnf
        ├── mysqld_safe.cnf
        └── wsrep.cnf
  2. Know how the !include and !includedir directives work in MySQL configuration files
  3. Know how MySQL handles the same variables included in multiple files
  4. Know what to look for and be aware of configurations that would result in node bootstrapping itself to form a cluster on its own

The problem was related to the fact that instructions did not mention any file except for /etc/mysql/my.cnf where, in fact, we should have been modifying /etc/mysql/percona-xtradb-cluster.conf.d/wsrep.cnf. That file contained empty variable:

wsrep_cluster_address=gcomm://

and such configuration forces node to bootstrap as it does not have information about other nodes to join to. We set that variable in /etc/mysql/my.cnf but later wsrep.cnf file was included, overwriting our setup.

This issue might be a serious blocker for people who are not really familiar with how MySQL and Galera works, resulting even in hours if not more of debugging.

Total Installation Time - 16 minutes (If You Are MySQL DBA Like I Am)

We managed to install Percona XtraDB Cluster in 16 minutes. You have to keep in mind a couple of things - we did not tune the configuration. This is something which will require more time and knowledge. PXC node comes with some simple configuration, related mostly to binary logging and Galera writeset replication. There is no InnoDB tuning. If you are not familiar with MySQL internals, this is hours if not days of reading and familiarizing yourself with internal mechanisms. Another important thing is that this is a process you would have to re-apply for every cluster you deploy. Finally, we managed to identify the issue and solve it very fast due to our experience with Percona XtraDB Cluster and MySQL in general. Casual user will most likely spend significantly more time trying to understand what is going on and why.

Ansible Playbook

Now, on to automation with Ansible. Let’s try to find and use an ansible playbook, which we could reuse for all further deployments. Let’s see how long will it take to do that.

Configuring SSH Connectivity - 1 minute

Ansible requires SSH connectivity across all the nodes to connect and configure them. We generated a SSH key and manually distributed it across the nodes.

Finding Ansible Playbook - 2 minutes 15 seconds

The main issue here is that there are so many playbooks available out there that it is impossible to decide what’s best. As such, we decided to go with top 3 Google results and try to pick one. We decided on https://github.com/cdelgehier/ansible-role-XtraDB-Cluster as it seems to be more configurable than the remaining ones.

Cloning Repository and Installing Ansible - 30 seconds

This is quick, all we needed was to

apt install ansible git
git clone https://github.com/cdelgehier/ansible-role-XtraDB-Cluster.git

Preparing Inventory File - 1 minute 10 seconds

This step was also very simple, we created an inventory file using example from documentation. We just substituted IP addresses of the nodes to what we have configured in our environment.

Preparing a Playbook - 1 minute 45 seconds

We decided to use the most extensive example from the documentation, which includes also a bit of the configuration tuning. We prepared a correct structure for the Ansible (there was no such information in the documentation):

/root/pxcansible/
├── inventory
├── pxcplay.yml
└── roles
    └── ansible-role-XtraDB-Cluster

Then we ran it but immediately we got an error:

root@vagrant:~/pxcansible# ansible-playbook pxcplay.yml
 [WARNING]: provided hosts list is empty, only localhost is available

ERROR! no action detected in task

The error appears to have been in '/root/pxcansible/roles/ansible-role-XtraDB-Cluster/tasks/main.yml': line 28, column 3, but may
be elsewhere in the file depending on the exact syntax problem.

The offending line appears to be:


- name: "Include {{ ansible_distribution }} tasks"
  ^ here
We could be wrong, but this one looks like it might be an issue with
missing quotes.  Always quote template expression brackets when they
start a value. For instance:

    with_items:
      - {{ foo }}

Should be written as:

    with_items:
      - "{{ foo }}"

This took 1 minute and 45 seconds.

Fixing the Playbook Syntax Issue - 3 minutes 25 seconds

The error was misleading but the general rule of thumb is to try more recent Ansible version, which we did. We googled and found good instructions on Ansible website. Next attempt to run the playbook also failed:

TASK [ansible-role-XtraDB-Cluster : Delete anonymous connections] *****************************************************************************************************************************************************************************************************************
fatal: [node2]: FAILED! => {"changed": false, "msg": "The PyMySQL (Python 2.7 and Python 3.X) or MySQL-python (Python 2.X) module is required."}
fatal: [node3]: FAILED! => {"changed": false, "msg": "The PyMySQL (Python 2.7 and Python 3.X) or MySQL-python (Python 2.X) module is required."}
fatal: [node1]: FAILED! => {"changed": false, "msg": "The PyMySQL (Python 2.7 and Python 3.X) or MySQL-python (Python 2.X) module is required."}

Setting up new Ansible version and running the playbook up to this error took 3 minutes and 25 seconds.

Fixing the Missing Python Module - 3 minutes 20 seconds

Apparently, the role we used did not take care of its prerequisites and a Python module was missing for connecting to and securing the Galera cluster. We first tried to install MySQL-python via pip but it became apparent that it will take more time as it required mysql_config:

root@vagrant:~# pip install MySQL-python
Collecting MySQL-python
  Downloading https://files.pythonhosted.org/packages/a5/e9/51b544da85a36a68debe7a7091f068d802fc515a3a202652828c73453cad/MySQL-python-1.2.5.zip (108kB)
    100% |████████████████████████████████| 112kB 278kB/s
    Complete output from command python setup.py egg_info:
    sh: 1: mysql_config: not found
    Traceback (most recent call last):
      File "<string>", line 1, in <module>
      File "/tmp/pip-build-zzwUtq/MySQL-python/setup.py", line 17, in <module>
        metadata, options = get_config()
      File "/tmp/pip-build-zzwUtq/MySQL-python/setup_posix.py", line 43, in get_config
        libs = mysql_config("libs_r")
      File "/tmp/pip-build-zzwUtq/MySQL-python/setup_posix.py", line 25, in mysql_config
        raise EnvironmentError("%s not found" % (mysql_config.path,))
    EnvironmentError: mysql_config not found

    ----------------------------------------
Command "python setup.py egg_info" failed with error code 1 in /tmp/pip-build-zzwUtq/MySQL-python/

That is provided by MySQL development libraries so we would have to install them manually, which was pretty much pointless. We decided to go with PyMySQL, which did not require other packages to install. This brought us to another issue:

TASK [ansible-role-XtraDB-Cluster : Delete anonymous connections] *****************************************************************************************************************************************************************************************************************
fatal: [node3]: FAILED! => {"changed": false, "msg": "unable to connect to database, check login_user and login_password are correct or /root/.my.cnf has the credentials. Exception message: (1698, u\"Access denied for user 'root'@'localhost'\")"}
fatal: [node2]: FAILED! => {"changed": false, "msg": "unable to connect to database, check login_user and login_password are correct or /root/.my.cnf has the credentials. Exception message: (1698, u\"Access denied for user 'root'@'localhost'\")"}
fatal: [node1]: FAILED! => {"changed": false, "msg": "unable to connect to database, check login_user and login_password are correct or /root/.my.cnf has the credentials. Exception message: (1698, u\"Access denied for user 'root'@'localhost'\")"}
    to retry, use: --limit @/root/pxcansible/pxcplay.retry

Up to this point we spent 3 minutes and 20 seconds.

Fixing “Access Denied” Error - 18 minutes 55 seconds

As per error, we did ensure that MySQL config is prepared correctly and that it included correct user and password to connect to the database. This, unfortunately, did not work as expected. We did investigate further and found that the role did not create root user properly, even though it marked the step as completed. We did a short investigation but decided to make the manual fix instead of trying to debug the playbook, which would take way more time than the steps which we did. We just created manually users root@127.0.0.1 and root@localhost with correct passwords. This allowed us to pass this step and onto another error:

TASK [ansible-role-XtraDB-Cluster : Start the master node] ************************************************************************************************************************************************************************************************************************
skipping: [node1]
skipping: [node2]
skipping: [node3]

TASK [ansible-role-XtraDB-Cluster : Create SST user] ******************************************************************************************************************************************************************************************************************************
skipping: [node1]
skipping: [node2]
skipping: [node3]

TASK [ansible-role-XtraDB-Cluster : Start the slave nodes] ************************************************************************************************************************************************************************************************************************
fatal: [node3]: FAILED! => {"changed": false, "msg": "Unable to start service mysql: Job for mysql.service failed because the control process exited with error code. See \"systemctl status mysql.service\" and \"journalctl -xe\" for details.\n"}
fatal: [node2]: FAILED! => {"changed": false, "msg": "Unable to start service mysql: Job for mysql.service failed because the control process exited with error code. See \"systemctl status mysql.service\" and \"journalctl -xe\" for details.\n"}
fatal: [node1]: FAILED! => {"changed": false, "msg": "Unable to start service mysql: Job for mysql.service failed because the control process exited with error code. See \"systemctl status mysql.service\" and \"journalctl -xe\" for details.\n"}
    to retry, use: --limit @/root/pxcansible/pxcplay.retry

For this section we spent 18 minutes and 55 seconds.

Fixing “Start the Slave Nodes” Issue (part 1) - 7 minutes 40 seconds

We tried a couple of things to solve this problem. We tried to specify node using its name, we tried to switch group names, nothing solved the issue. We decided to clean up the environment using the script provided in the documentation and start from scratch. It did not clean it but just made things even worse. After 7 minutes and 40 seconds we decided to wipe out the virtual machines, recreate the environment and start from scratch hoping that when we add the Python dependencies, this will solve our issue.

Fixing “Start the Slave Nodes” Issue (part 2) - 13 minutes 15 seconds

Unfortunately, setting up Python prerequisites did not help at all. We decided to finish the process manually, bootstrapping the first node and then configuring SST user and starting remaining slaves. This completed the “automated” setup and it took us 13 minutes and 15 seconds to debug and then finally accept that it will not work like the playbook designer expected.

Further Debugging - 10 minutes 45 seconds

We did not stop there and decided that we’ll try one more thing. Instead of relying on Ansible variables we just put the IP of one of the nodes as the master node. This solved that part of the problem and we ended up with:

TASK [ansible-role-XtraDB-Cluster : Create SST user] ******************************************************************************************************************************************************************************************************************************
skipping: [node2]
skipping: [node3]
fatal: [node1]: FAILED! => {"changed": false, "msg": "unable to connect to database, check login_user and login_password are correct or /root/.my.cnf has the credentials. Exception message: (1045, u\"Access denied for user 'root'@'::1' (using password: YES)\")"}

This was the end of our attempts - we tried to add this user but it did not work correctly through the ansible playbook while we could use IPv6 localhost address to connect to when using MySQL client.

Total Installation Time - Unknown (Automated Installation Failed)

In total we spent 64 minutes and we still haven’t managed to get things going automatically. The remaining problems are root password creation which doesn’t seem to work and then getting the Galera Cluster started (SST user issue). It is hard to tell how long will it take to debug it further. It is sure possible - it is just hard to quantify because it really depends on the experience with Ansible and MySQL. It is definitely not something anyone can just download, configure and run. Well, maybe another playbook would have worked differently? It is possible, but it may as well result in different issues. Ok, so there is a learning curve to climb and debugging to make but then, when you are all set, you will just run a script. Well, that’s sort of true. As long as changes introduced by the maintainer won’t break something you depend on or new Ansible version will break the playbook or the maintainer will just forget about the project and stop developing it (for the role that we used there’s quite useful pull request waiting already for almost a year, which might be able to solve the Python dependency issue - it has not been merged). Unless you accept that you will have to maintain this code, you cannot really rely on it being 100% accurate and working in your environment, especially given that the original developer has no incentives in keeping the code up to date. Also, what about other versions? You cannot use this particular playbook to install PXC 5.6 or any MariaDB version. Sure, there are other playbooks you can find. Will they work better or maybe you’ll spend another bunch of hours trying to make them to work?

ClusterControl
Single Console for Your Entire Database Infrastructure
Find out what else is new in ClusterControl

ClusterControl

Finally, let’s take a look at how ClusterControl can be used to deploy Percona XtraDB Cluster.

Configuring SSH Connectivity - 1 minute

ClusterControl requires SSH connectivity across all the nodes to connect and configure them. We generated a SSH key and manually distributed it across the nodes.

Setting Up ClusterControl - 3 minutes 15 seconds

Quick search “ClusterControl install” pointed us to relevant ClusterControl documentation page. We were looking for a “simpler way to install ClusterControl” therefore we followed the link and found following instructions.

Downloading the script and running it took 3 minutes and 15 seconds, we had to take some actions while installation proceeded so it is not unattended installation.

Logging Into UI and Deployment Start - 1 minute 10 seconds

We pointed our browser to the IP of ClusterControl node.

We passed the required contact information and we were presented with the Welcome screen:

Next step - we picked the deployment option.

We had to pass SSH connectivity details.

We also decided on the vendor, version, password and hosts to use. This whole process took 1 minute and 10 seconds.

Percona XtraDB Cluster Deployment - 12 minutes 5 seconds

The only thing left was to wait for ClusterControl to finish the deployment. After 12 minutes and 5 seconds the cluster was ready:

Total Installation Time - 17 minutes 30 seconds

We managed to deploy ClusterControl and then PXC cluster using ClusterControl in 17 minutes and 30 seconds. The PXC deployment itself took 12 minutes and 5 seconds. At the end we have a working cluster, deployed according to the best practices. ClusterControl also ensures that the configuration of the cluster makes sense. In short, even if you don't really know anything about MySQL or Galera Cluster, you can have a production-ready cluster deployed in a couple of minutes. ClusterControl is not just a deployment tool, it is also management platform - makes things even easier for people not experienced with MySQL and Galera to identify performance problems (through advisors) and do management actions (scaling the cluster up and down, running backups, creating asynchronous slaves to Galera). What is important, ClusterControl will always be maintained and can be used to deploy all MySQL flavors (and not only MySQL/MariaDB, it also supports TimeScaleDB, PostgreSQL and MongoDB). It also worked out of the box, something which cannot be said about other methods we tested.

If you would like to experience the same, you can download ClusterControl for free. Let us know how you liked it.

How to Automate Migration from Standalone MySQL to Galera Cluster using Ansible

$
0
0

Database migrations don’t scale well. Typically you need to perform a great deal of tests before you can pull the trigger and switch from old to new. Migrations are usually done manually, as most of the process does not lend itself to automation. But that doesn’t mean there is no room for automation in the migration process. Imagine setting up a number of nodes with new software, provisioning them with data and configuring replication between old and new environments by hand. This takes days. Automation can be very useful when setting up a new environment and provisioning it with data. In this blog post, we will take a look at a very simple migration - from standalone Percona Server 5.7 to a 3-node Percona XtraDB Cluster 5.7. We will use Ansible to accomplish that.

Environment Description

First of all, one important disclaimer - what we are going to show here is only a draft of what you might like to run in production. It does work on our test environment but it may require modifications to make it suitable for your environment. In our tests we used four Ubuntu 16.04 VM’s deployed using Vagrant. One contains standalone Percona Server 5.7, remaining three will be used for Percona XtraDB Cluster nodes. We also use a separate node for running ansible playbooks, although this is not a requirement and the playbook can also be executed from one of the nodes. In addition, SSH connectivity is available between all of the nodes. You have to have connectivity from the host where you run ansible, but having the ability to ssh between nodes is useful (especially between master and new slave - we rely on this in the playbook).

Playbook Structure

Ansible playbooks typically share common structure - you create roles, which can be assigned to different hosts. Each role will contain tasks to be executed on it, templates that will be used, files that will be uploaded, variables which are defined for this particular playbook. In our case, the playbook is very simple.

.
├── inventory
├── playbook.yml
├── roles
│   ├── first_node
│   │   ├── my.cnf.j2
│   │   ├── tasks
│   │   │   └── main.yml
│   │   └── templates
│   │       └── my.cnf.j2
│   ├── galera
│   │   ├── tasks
│   │   │   └── main.yml
│   │   └── templates
│   │       └── my.cnf.j2
│   ├── master
│   │   └── tasks
│   │       └── main.yml
│   └── slave
│       └── tasks
│           └── main.yml
└── vars
    └── default.yml

We defined a couple of roles - we have a master role, which is intended to do some sanity checks on the standalone node. There is slave node, which will be executed on one of the Galera nodes to configure it for replication, and set up the asynchronous replication. Then we have a role for all Galera nodes and a role for the first Galera node to bootstrap the cluster from it. For Galera roles, we have a couple of templates that we will use to create my.cnf files. We will also use local .my.cnf to define a username and password. We have a file containing a couple of variables which we may want to customize, just like passwords. Finally we have an inventory file, which defines hosts on which we will run the playbook, we also have the playbook file with information on how exactly things should be executed. Let’s take a look at the individual bits.

Inventory File

This is a very simple file.

[galera]
10.0.0.142
10.0.0.143
10.0.0.144

[first_node]
10.0.0.142

[master]
10.0.0.141

We have three groups, ‘galera’, which contains all Galera nodes, ‘first_node’, which we will use for the bootstrap and finally ‘master’, which contains our standalone Percona Server node.

Playbook.yml

The file playbook.yml contains the general guidelines on how the playbook should be executed.

-   hosts: master
    gather_facts: yes
    become: true
    pre_tasks:
    -   name: Install Python2
        raw: test -e /usr/bin/python || (apt -y update && apt install -y python-minimal)
    vars_files:
        -   vars/default.yml
    roles:
    -   { role: master }

As you can see, we start with the standalone node and we apply tasks related to the role ‘master’ (we will discuss this in details further down in this post).

-   hosts: first_node
    gather_facts: yes
    become: true
    pre_tasks:
    -   name: Install Python2
        raw: test -e /usr/bin/python || (apt -y update && apt install -y python-minimal)
    vars_files:
        -   vars/default.yml
    roles:
    -   { role: first_node }
    -   { role: slave }

Second, we go to node defined in ‘first_node’ group and we apply two roles: ‘first_node’ and ‘slave’. The former is intended to deploy a single node PXC cluster, the later will configure it to work as a slave and set up the replication.

-   hosts: galera
    gather_facts: yes
    become: true
    pre_tasks:
    -   name: Install Python2
        raw: test -e /usr/bin/python || (apt -y update && apt install -y python-minimal)
    vars_files:
        -   vars/default.yml
    roles:
    -   { role: galera }

Finally, we go through all Galera nodes and apply ‘galera’ role on all of them.

Severalnines
 
DevOps Guide to Database Management
Learn about what you need to know to automate and manage your open source databases

Variables

Before we begin to look into roles, we want to mention default variables that we defined for this playbook.

sst_user: "sstuser"
sst_password: "pa55w0rd"
root_password: "pass"
repl_user: "repl_user"
repl_password: "repl1cati0n"

As we stated, this is a very simple playbook without much options for customization. You can configure users and passwords and this is basically it. One gotcha - please make sure that the standalone node’s root password matches ‘root_password’ here as otherwise the playbook wouldn’t be able to connect there (it can be extended to handle it but we did not cover that).

This file is without much of a value but, as a rule of thumb, you want to encrypt any file which contains credentials. Obviously, this is for the security reasons. Ansible comes with ansible-vault, which can be used to encrypt and decrypt files. We will not cover details here, all you need to know is available in the documentation. In short, you can easily encrypt files using passwords and configure your environment so that the playbooks can be decrypted automatically using password from file or passed by hand.

Roles

In this section we will go over roles that are defined in the playbook, summarizing what they are intended to perform.

Master role

As we stated, this role is intended to run a sanity check on the configuration of the standalone MySQL. It will install required packages like percona-xtrabackup-24. It also creates replication user on the master node. A configuration is reviewed to ensure that the server_id and other replication and binary log-related settings are set. GTID is also enabled as we will rely on it for replication.

First_node role

Here, the first Galera node is installed. Percona repository will be configured, my.cnf will be created from the template. PXC will be installed. We also run some cleanup to remove unneeded users and to create those, which will be required (root user with the password of our choosing, user required for SST). Finally, cluster is bootstrapped using this node. We rely on the empty ‘wsrep_cluster_address’ as a way to initialize the cluster. This is why later we still execute ‘galera’ role on the first node - to swap initial my.cnf with the final one, containing ‘wsrep_cluster_address’ with all the members of the cluster. One thing worth remembering - when you create a root user with password you have to be careful not to get locked off MySQL so that Ansible could execute other steps of the playbook. One way to do that is to provide .my.cnf with correct user and password. Another would be to remember to always set correct login_user and login_password in ‘mysql_user’ module.

Slave role

This role is all about configuring replication between standalone node and the single node PXC cluster. We use xtrabackup to get the data, we also check for executed gtid in xtrabackup_binlog_info to ensure the backup will be restored properly and that replication can be configured. We also perform a bit of the configuration, making sure that the slave node can use GTID replication. There is a couple of gotchas here - it is not possible to run ‘RESET MASTER’ using ‘mysql_replication’ module as of Ansible 2.7.10, it should be possible to do that in 2.8, whenever it will come out. We had to use ‘shell’ module to run MySQL CLI commands. When rebuilding Galera node from external source, you have to remember to re-create any required users (at least user used for SST). Otherwise the remaining nodes will not be able to join the cluster.

Galera role

Finally, this is the role in which we install PXC on remaining two nodes. We run it on all nodes, the initial one will get “production” my.cnf instead of its “bootstrap” version. Remaining two nodes will have PXC installed and they will get SST from the first node in the cluster.

Summary

As you can see, you can easily create a simple, reusable Ansible playbook which can be used for deploying Percona XtraDB Cluster and configuring it to be a slave of standalone MySQL node. To be honest, for migrating a single server, this will probably have no point as doing the same manually will be faster. Still, if you expect you will have to re-execute this process a couple of times, it will definitely make sense to automate it and make it more time efficient. As we stated at the beginning, this is by no means production-ready playbook. It is more of a proof of concept, something you may extend to make it suitable for your environment. You can find archive with the playbook here: http://severalnines.com/sites/default/files/ansible.tar.gz

We hope you found this blog post interesting and valuable, do not hesitate to share your thoughts.

How to Automate Deployment of MySQL Galera Cluster using s9s CLI and Chef

$
0
0

In our previous blog, we showed how devops can automate your daily database tasks with Chef. Now, let's see how we can quickly deploy a MySQL Galera Cluster with Chef using s9s CLI.

Setting up a Galera Cluster manually can be fast for an experienced DBA. Automating it with something like Ansible may take a hell of a lot longer, as our colleague Krzysztof found out in this blog. While automating deployment of a database cluster with Chef is certainly doable, it is not an easy task as you can end up with hundreds of lines of code which can be hard to maintain when there are updates to the software. We will demonstrate here how you can integrate the s9s CLI in your deployment cookbook and speed up the process.

About the s9s CLI

s9s is the CLI tool for ClusterControl, you can use it to integrate with your runbooks for automation like Ansible, Puppet, Chef or Salt. This allows you to easily integrate database management functionality into your orchestration scripts. The command line tool allows you to interact, control and manage your database infrastructure using ClusterControl. For instance, we used it here to automate deployment when running ClusterControl and Galera Cluster on Docker Swarm. It is noteworthy that this tool is open source so you can freely use or contribute to it.

How to get the s9s CLI

The CLI can be installed by adding the s9s tools repository and using a package manager, or compiled from source. The current installation script to install ClusterControl, install-cc, will automatically install the command line client. The command line client can also be installed on another computer or workstation for remote management. More information in our documentation.

Some of the things you can do from the CLI:

  • Deploy and manage database clusters
    • MySQL and MariaDB
    • PostgreSQL
    • MongoDB to be added soon
    • TimescaleDB
  • Monitor your databases
    • Status of nodes and clusters
    • Cluster properties can be extracted
    • Gives detailed enough information about your clusters
  • Manage your systems and integrate with DevOps tools
    • Create, stop or start clusters
    • Add, remove, or restart nodes in the cluster
    • Create database users (CREATE USER, GRANT privileges to user)
      • Users created in the CLI are traceable through the system
    • Create load balancers (HAProxy, ProxySQL)
    • Create and Restore backups
    • Use maintenance mode
    • Conduct configuration changes of db nodes
    • Integrate with existing deployment automation
      • Ansible, Puppet, Chef or Salt, …
    • Integrate with chatbots like Slack, FlowDock and Hipchat

Automating your Galera Cluster Setup

In our previous blog, we have discussed about the flow of Chef in which you have to setup your workstation, Chef server, and the nodes/clients. Now, let's look at first the diagram for this setup on automating our Galera Cluster setup. Check out below:

The workstation serves here as your development machine, where you write your code. Then push the cookbooks/recipes to the Chef Server, which runs them in the target node which is the ClusterControl in this setup. This target ClusterControl must be a clean/dedicated host. As mentioned earlier, we'll be using s9s-tools to leverage the installation and setup of Galera nodes without writing lots of lines of code. Instead, code it like a boss.

Here are the prerequisites:

  • Workstation/Node
  • Chef Server
  • ClusterControl controller/server - The controller here is a requirement for our s9s CLI to operate. Our community version lets you deploy your database clusters.
  • 3-galera nodes. For this setup, I have the following IP's used: 192.168.70.70,192.168.70.80,192.168.70.100
  • Setup your ClusterControl OS user public keys to all of the targeted Galera nodes to avoid further SSH errors.

Integrating ClusterControl into your automation tools

Installing ClusterControl can be done in several ways. You can use the package manager such as your favorite yum or apt and use our repository, you can use install-cc, or you can use our automation scripts for Puppet, Ansible, or Chef.

For the purpose of this blog, we will use the S9s_cookbook and integrate the automation process for our Galera Cluster setup. There are two ways to utilize the S9s_cookbook. You can use the github https://github.com/severalnines/S9s_cookbooks or through the marketplace using knife. We'll use the marketplace.

  1. In your workstation, download the cookbook using Chef's knife tool, and uncompress the tar ball.

    $ cd ~/dba-tasks-repo/cookbooks
    $ knife cookbook site download clustercontrol
    $ tar -xzvf clustercontrol-*
    $ unlink clusercontrol-*.tar.gz
  2. Then run the s9s_helper.sh located in app the clustercontrol cookbook.

    $ cd ~/dba-tasks-repo/cookbooks/clustercontrol/files/default
    $ ./s9s_helper.sh

    For example, you'll see the following as you run the script:

    [vagrant@node2 default]$ ./s9s_helper.sh 
    ==============================================
    Helper script for ClusterControl Chef cookbook
    ==============================================
    
    ClusterControl will install a MySQL server and setup the MySQL root user.
    Enter the password for MySQL root user [password] : R00tP@55
    
    ClusterControl will create a MySQL user called 'cmon' for automation tasks.
    Enter the password for user cmon [cmon] : cm0nP@55
    
    Generating config.json..
    {
        "id" : "config",
        "mysql_root_password" : "R00tP@55",
        "cmon_password" : "cm0nP@55",
        "clustercontrol_api_token" : "f38389ba5d1cd87a1aa5f5b1c15b3ca0ee5a2b0f"
    }
    
    Data bag file generated at /home/vagrant/dba-tasks-repo/cookbooks/clustercontrol/files/default/config.json
    To upload the data bag, you can use following command:
    $ knife data bag create clustercontrol
    $ knife data bag from file clustercontrol /home/vagrant/dba-tasks-repo/cookbooks/clustercontrol/files/default/config.json
    
    ** We highly recommend you to use encrypted data bag since it contains confidential information **
  3. Then create a data bag as per instruction in the last output of the s9s_helper.sh script,

    [vagrant@node2 clustercontrol]$ knife data bag create clustercontrol
    Created data_bag[clustercontrol]
    [vagrant@node2 clustercontrol]$ knife data bag from file clustercontrol ~/dba-tasks-repo/cookbooks/clustercontrol/files/default/config.json 
    Updated data_bag_item[clustercontrol::config]
  4. Before you upload to the Chef Server, ensure that you have the similar contents in your templates/default/configure_cmon_db.sql.erb as follows:

    SET SQL_LOG_BIN=0;
    GRANT ALL PRIVILEGES ON *.* TO 'cmon'@'127.0.0.1' IDENTIFIED BY '<%= node['cmon']['mysql_password'] %>' WITH GRANT OPTION;
    GRANT ALL PRIVILEGES ON *.* TO 'cmon'@'localhost' IDENTIFIED BY '<%= node['cmon']['mysql_password'] %>' WITH GRANT OPTION;
    GRANT ALL PRIVILEGES ON *.* TO 'cmon'@'<%= node['ipaddress'] %>' IDENTIFIED BY '<%= node['cmon']['mysql_password'] %>' WITH GRANT OPTION;
    GRANT ALL PRIVILEGES ON *.* TO 'cmon'@'<%= node['fqdn'] %>' IDENTIFIED BY '<%= node['cmon']['mysql_password'] %>' WITH GRANT OPTION;
    REPLACE INTO dcps.apis(id, company_id, user_id, url, token) VALUES (1, 1, 1, 'http://127.0.0.1/cmonapi', '<%= node['api_token'] %>');
    FLUSH PRIVILEGES;
  5. Ensure in file recipes/controller.erb also that the cmon service will be restarted. See below:

    service "cmon" do
        supports :restart => true, :start => true, :stop => true, :reload => true
        action [ :enable, :restart ]
    end
  6. Upload the cookbook to the Chef Server

    $ ~/dba-tasks-repo/cookbooks/
    $ knife cookbook upload clustercontrol
  7. Alternatively, you can create roles to attach the role to the node. We'll use roles again just like in our previous blog. You can do the following for example:

    1. Create a file called cc_controller.rb in path ~/dba-tasks-repo/cookbooks/clustercontrol with the following contents:

      name "cc_controller"
      description "ClusterControl Controller"
      run_list ["recipe[clustercontrol]"]
    2. Create a role from the file we created as follows:

      [vagrant@node2 clustercontrol]$ knife role from file cc_controller.rb 
      Updated Role cc_controller
    3. Assign the roles to the target nodes/client as follows:

      $ knife node run_list add <cluster_control_host> "role[cc_controller]"

      Where <cluster_control_host> is your ClusterControl controller's hostname.

    4. Verify what nodes the role is attached to and its run list. For example, I have the following:

      [vagrant@node2 clustercontrol]$ knife role show cc_controller
      chef_type:           role
      default_attributes:
      description:         ClusterControl Controller
      env_run_lists:
      json_class:          Chef::Role
      name:                cc_controller
      override_attributes:
      run_list:
        recipe[clustercontrol]
        recipe[db_galera_install]

Now, we're not yet finished. We'll proceed on integrating our Galera Cluster automation Chef cookbook.

ClusterControl
Single Console for Your Entire Database Infrastructure
Find out what else is new in ClusterControl

Writing our Chef Cookbook for MySQL Galera Cluster

As mentioned earlier, we will be integrating s9s CLI into our automation code. Let's proceed with the steps.

  1. Let's generate a cookbook. Let's name it as db_galera_install,

    $ cd ~/dba-tasks-repo/cookbooks/
    $ chef generate cookbook db_galera_install
  2. Let's also generate the attribute file,

    $  chef generate attribute default
  3. Go to attributes/default.rb and add the following contents in the file

    default['cmon']['s9s_bin'] = '/bin/s9s'
    default['cmon']['galera_cluster_name'] = 'PS-galera_cluster'
    default['cmon']['db_pass'] = 'R00tP@55'
  4. Go to recipes/default.rb and add the following contents in the file

    galera_cluster_name = "#{node['cmon']['galera_cluster_name']}"
    s9s_bin = "#{node['cmon']['s9s_bin']}"
    
    cc_config = data_bag_item('clustercontrol','config')
    db_pass = cc_config['mysql_root_password']
    
    
    bash "install-galera-nodes" do
      user "root"
      code <<-EOH
      #{s9s_bin} cluster --create --cluster-type=galera --nodes="192.168.70.70,192.168.70.80,192.168.70.100" \
        --vendor=percona \
        --provider-version=5.7 \
        --db-admin-passwd='#{db_pass}' \
        --os-user=vagrant \
        --cluster-name='#{galera_cluster_name}' \
        --wait \
        --log
      EOH
    
      not_if "[[ ! -z $(#{s9s_bin} cluster --list --cluster-format='%I' --cluster-name '#{galera_cluster_name}') ]]"
    end

    A little bit of explanation about the code. It uses the s9s cluster --create command to create a Galera type of cluster. The nodes are specified using its IP addresses within the --nodes argument. We also use the same password setup from the ClusterControl database using the current data bag named clustercontrol. Hence, you can initiate another data bag as preferred. The rest are self-explainable but you can check here in our documentation.
    Lastly, the conditional statement not_if part is very important. It determines that the bash resource, which handles the setup for the Galera cluster, will not be invoked once the Galera Cluster named PS-galera_cluster has been provisioned.

  5. Since we have it setup, we'll then upload it to the Chef server as follows:

    $ ~/dba-tasks-repo/cookbooks/
    $ knife cookbook upload db_galera_install
  6. Let's verify the list of roles and then add it to the role we have setup earlier namely cc_controller

    [vagrant@node2 cookbooks]$ knife role list
    cc_controller
    pg_nodes

    Then edit the role by running the command below:

    $ export EDITOR=vi; 
    $ knife role edit cc_controller

    You might have something look like as follows,

    {
      "name": "cc_controller",
      "description": "ClusterControl Controller",
      "json_class": "Chef::Role",
      "default_attributes": {
    
      },
      "override_attributes": {
    
      },
      "chef_type": "role",
      "run_list": [
        "recipe[clustercontrol]",
        "recipe[db_galera_install]"
      ],
      "env_run_lists": {
    
      }
    }

    You must ensure that the run_list must have the following,

    "recipe[clustercontrol]",
    "recipe[db_galera_install]"

That's all and we are ready to roll!

Executing the Runbooks

We're done preparing both ClusterControl and our Galera Cluster cookbooks ready to be tested. We'll proceed on running it and show the results of our Chef automation.

Go to the target node/client. In my end, I use node9 with IP 192.168.70.90. Then run the command below,

$ sudo chef-client -l info

In my client node, this shows as follows:

Setting and Installing the ClusterControl Server
Installing the Galera Cluster Nodes at Host 192.168.70.70
Installing the Galera Cluster Nodes at Host 192.168.70.80

Once it's all done, you'll have all your ClusterControl setup and the Galera Cluster nodes with ease!

Lastly, here's a screenshot of our Galera Cluster within ClusterControl:

ClusterControl Home Page
Our Galera Overview Dashboard

Conclusion

We have showed you how easy it is to integrate our s9s CLI tool for your common database activities. This is very helpful in an organization where Chef is used as the de-facto automation tool. s9s can make you more productive by automating your daily database administrative work.

galera grid small cat 1


galera grid large cat 1

galera sidebar 1

Handling Large Transactions with Streaming Replication and MariaDB 10.4

$
0
0

Dealing with large transactions was always a pain point in Galera Cluster. The way in which Galera writeset certification works causes troubles when transactions are long or when a single row is being modified often on multiple nodes. As a result, transactions have to be rolled back and retried causing performance drops. Luckily, this problem has been addressed in Galera 4, a new release of Galera from Codership. This library is used in MariaDB 10.4, so installing MariaDB 10.4 the easiest way of testing the newly introduced features. In this blog post we will take a look at how the streaming replication can be used to mitigate problems which used to be a standard issue in previous Galera versions.

We will use three nodes of MariaDB Galera cluster version 10.4.6, which comes with Galera version of 26.4.2.

MariaDB [(none)]> show global status like 'wsrep_provider%';
+-----------------------------+------------------------------------------------------------------------------------------------------------------------------------------------+
| Variable_name               | Value                                                                                                                                          |
+-----------------------------+------------------------------------------------------------------------------------------------------------------------------------------------+
| wsrep_provider_capabilities | :MULTI_MASTER:CERTIFICATION:PARALLEL_APPLYING:TRX_REPLAY:ISOLATION:PAUSE:CAUSAL_READS:INCREMENTAL_WRITESET:UNORDERED:PREORDERED:STREAMING:NBO: |
| wsrep_provider_name         | Galera                                                                                                                                         |
| wsrep_provider_vendor       | Codership Oy <info@codership.com>                                                                                                              |
| wsrep_provider_version      | 26.4.2(r4498)                                                                                                                                  |
+-----------------------------+------------------------------------------------------------------------------------------------------------------------------------------------+
4 rows in set (0.001 sec)

There are three main pain points streaming replication is intended to deal with:

  • Long transactions
  • Large transactions
  • Hot spots in tables

Let’s consider them one by one and see how streaming replication may help us to deal with them but first let’s focus on the writeset certification - the root cause of those issues to show up.

Writeset certification in Galera cluster

Galera cluster consists of multiple writeable nodes. Each transaction executed on Galera cluster forms a writeset. Every writeset has to be sent to all of the nodes in the cluster for certification - a process which ensures that all the nodes can apply given transaction. Writesets have to be executed on all of the cluster nodes so if there is any conflict, transaction cannot be committed. What are typical reasons why the transaction cannot be committed? Well, the three points we listed earlier:

  • Long transactions - longer the transaction takes, more likely is that in the meantime another node will execute updates which will eventually conflict with the writeset and prevent it from passing the certification
  • Large transactions - first of all, large transactions are also longer than small ones, so that triggers the first problem. Second problem, strictly related to the large transactions, is the volume of the changes. More rows are going to be updated, more likely is that some write on another node will result in a conflict and the whole transaction would have to be rolled back.
  • Hot spots in tables - more likely given row is to be updated, more probably such update will happen simultaneously on multiple nodes resulting in some of the transactions to be rolled back

The main issue here is that Galera does not introduce any locking on nodes other than the initial node, on which the transaction was opened. The certification process is based on a hope that if one node could execute a transaction, others should be able to do it too. It is true but, as we discussed, there are corner cases in which the probability of this happening is significantly reduced.

In Galera 4, with streaming replication, the behavior has changed and all locks are being taken in all of the nodes. Transactions will be split into parts and each part will be certified on all nodes. After successful certification rows will be locked on all nodes in the cluster. There are a couple of variables that govern how exactly this is done - wsrep_trx_fragment_size and wsrep_trx_fragment_unit define how large the fragment should be and how it should be defined. It is very fine-grained control: you can define fragment unit as bytes, statements or rows which makes it possible to run the certification for every row modified in the transaction. Let’s take a look at how you can benefit from the streaming replication in real life.

Working with the streaming replication

Let’s consider the following scenario. We have a transaction to run that takes at least 30 seconds:

BEGIN; UPDATE sbtest.sbtest1 SET k = k - 2 WHERE id < 2000 ; UPDATE sbtest.sbtest1 SET k = k + 1 WHERE id < 2000 ; UPDATE sbtest.sbtest1 SET k = k + 1 WHERE id < 2000 ; SELECT SLEEP(30); COMMIT;

Then, while it is running, we will execute SQL that touches similar rows. This will be executed on another node:

BEGIN; UPDATE sbtest.sbtest1 SET k = k - 1 WHERE id < 20 ; UPDATE sbtest.sbtest1 SET k = k + 1 WHERE id < 20 ; COMMIT;

What would be the result?

The first transaction is rolled back as soon as the second one is executed:

MariaDB [sbtest]> BEGIN; UPDATE sbtest.sbtest1 SET k = k - 2 WHERE id < 2000 ; UPDATE sbtest.sbtest1 SET k = k + 1 WHERE id < 2000 ; UPDATE sbtest.sbtest1 SET k = k + 1 WHERE id < 2000 ; SELECT SLEEP(30); COMMIT;
Query OK, 0 rows affected (0.001 sec)

Query OK, 667 rows affected (0.020 sec)
Rows matched: 667  Changed: 667  Warnings: 0

Query OK, 667 rows affected (0.010 sec)
Rows matched: 667  Changed: 667  Warnings: 0

Query OK, 667 rows affected (0.009 sec)
Rows matched: 667  Changed: 667  Warnings: 0

ERROR 1213 (40001): Deadlock found when trying to get lock; try restarting transaction
Query OK, 0 rows affected (0.001 sec)

The transaction on the second node succeeded:

MariaDB [(none)]> BEGIN; UPDATE sbtest.sbtest1 SET k = k - 1 WHERE id < 20 ; UPDATE sbtest.sbtest1 SET k = k + 1 WHERE id < 20 ; COMMIT;
Query OK, 0 rows affected (0.000 sec)

Query OK, 7 rows affected (0.002 sec)
Rows matched: 7  Changed: 7  Warnings: 0

Query OK, 7 rows affected (0.001 sec)
Rows matched: 7  Changed: 7  Warnings: 0

Query OK, 0 rows affected (0.004 sec)

What we can do to avoid it is to use streaming replication for the first transaction. We will ask Galera to certify every row change:

MariaDB [sbtest]> BEGIN; SET SESSION wsrep_trx_fragment_size=1 ; SET SESSION wsrep_trx_fragment_unit='rows' ; UPDATE sbtest.sbtest1 SET k = k - 2 WHERE id < 2000 ; UPDATE sbtest.sbtest1 SET k = k + 1 WHERE id < 2000 ; UPDATE sbtest.sbtest1 SET k = k + 1 WHERE id < 2000 ; SELECT SLEEP(30); COMMIT; SET SESSION wsrep_trx_fragment_size=0;
Query OK, 0 rows affected (0.001 sec)

Query OK, 0 rows affected (0.000 sec)

Query OK, 0 rows affected (0.000 sec)

Query OK, 667 rows affected (1.757 sec)
Rows matched: 667  Changed: 667  Warnings: 0

Query OK, 667 rows affected (1.708 sec)
Rows matched: 667  Changed: 667  Warnings: 0

Query OK, 667 rows affected (1.685 sec)
Rows matched: 667  Changed: 667  Warnings: 0

As you can see, this time it worked just fine. On the second node:

MariaDB [(none)]> BEGIN; UPDATE sbtest.sbtest1 SET k = k - 1 WHERE id < 20 ; UPDATE sbtest.sbtest1 SET k = k + 1 WHERE id < 20 ; COMMIT;
Query OK, 0 rows affected (0.000 sec)

Query OK, 7 rows affected (33.942 sec)
Rows matched: 7  Changed: 7  Warnings: 0

Query OK, 7 rows affected (0.001 sec)
Rows matched: 7  Changed: 7  Warnings: 0

Query OK, 0 rows affected (0.026 sec)

What is interesting, you can see that the UPDATE took almost 34 seconds to execute - this was caused by the fact that the initial transaction, through the streaming replication, locked all modified rows on all of the nodes and our second transaction had to wait for the first one to complete even though both transactions were executed on different nodes.

This is basically it when it comes to the streaming replication. Depending on the requirements and the traffic you may use it in a less strict manner - we certified every row but you can change that to every n-th row or every statement. You can even decide on the volume of data to certify. This should be enough to match the requirements of your environment.

There are couple more things we would like you to keep in mind and remember. First of all, streaming replication is by no means a solution that should be used by default. This is the reason why it is, by default, disabled. The recommended use case is to manually decide on transactions that would benefit from the streaming replication and enable it at the session level. This is the reason why our examples end with:

SET SESSION wsrep_trx_fragment_size=0;

This statement (setting wsrep_trx_fragment_size to 0) disables streaming replication for current session.

Another thing worth remembering - if you happen to use streaming replication, it will use ‘wsrep_streaming_log’ table in ‘mysql’ schema for persistently storing the data that is streaming. Using this table you can get some idea about the data that is being transferred across the cluster using streaming replication.

Finally, the performance. This is also one of the reasons why you do not want to use streaming replication all the time. Main reason for that is locking - with streaming replication you have to acquire row locks on all of the nodes. This takes time to get the locks and, should you have to rollback the transaction, it will also put the pressure on all nodes to perform the rollback. We ran a very quick test of the performance impact that the streaming replication have. The environment is strictly a test one so do not assume those results to be the same on the production-grade hardware, it is more for you to see what the impact could be.

We tested four scenarios:

  1. Baseline, set global wsrep_trx_fragment_size=0;
  2. set global wsrep_trx_fragment_unit='rows'; set global wsrep_trx_fragment_size=1;
  3. set global wsrep_trx_fragment_unit='statements'; set global wsrep_trx_fragment_size=1;
  4. set global wsrep_trx_fragment_unit='statements'; set global wsrep_trx_fragment_size=5;

We used sysbench r/w test:

sysbench /root/sysbench/src/lua/oltp_read_write.lua --threads=4 --events=0 --time=300 --mysql-host=10.0.0.141 --mysql-user=sbtest --mysql-password=sbtest --mysql-port=3306 --tables=32 --report-interval=1 --skip-trx=off --table-size=100000 --db-ps-mode=disable run

The results are:

  1. Transactions: 82.91 per sec., queries: 1658.27 per sec. (100%)
  2. Transactions: 54.72 per sec., queries: 1094.43 per sec. (66%)
  3. Transactions: 54.76 per sec., queries: 1095.18 per sec. (66%)
  4. Transactions: 70.93 per sec., queries: 1418.55 per sec. (86%)

As you can see, the impact is significant, performance drops even by 33%.

We hope you found this blog post informative and it gave you some insights into the streaming replication that comes with Galera 4 and MariaDB 10.4. We tried to cover use cases and potential drawbacks related to this new technology.

MySQL on Docker: ProxySQL Native Clustering with Kubernetes

$
0
0

ProxySQL has supported native clustering since v1.4.2. This means multiple ProxySQL instances are cluster-aware; they are aware of each others' state and able to handle the configuration changes automatically by syncing up to the most up-to-date configuration based on configuration version, timestamp and checksum value. Check out this blog post which demonstrates how to configure clustering support for ProxySQL and how you could expect it to behave.

ProxySQL is a decentralized proxy, recommended to be deployed closer to the application. This approach scales pretty well even up to hundreds of nodes, as it was designed to be easily reconfigurable at runtime. To efficiently manage multiple ProxySQL nodes, one has to make sure whatever changes performed on one of the nodes should be applied across all nodes in the farm. Without native clustering, one has to manually export the configurations and import them to the other nodes (albeit, you could automate this by yourself).

In the previous blog post, we have covered ProxySQL clustering via Kubernetes ConfigMap. This approach is more or less pretty efficient with the centralized configuration approach in ConfigMap. Whatever loaded into ConfigMap will be mounted into pods. Updating the configuration can be done via versioning (modify the proxysql.cnf content and load it into ConfigMap with another name) and then push to the pods depending on the Deployment method scheduling and update strategy.

However, in a rapidly changing environment, this ConfigMap approach is probably not the best method because in order to load the new configuration, pod rescheduling is required to remount the ConfigMap volume and this might jeopardize the ProxySQL service as a whole. For example, let's say in our environment, our strict password policy requires to force MySQL user password expiration for every 7 days, which we would have to keep updating the ProxySQL ConfigMap for the new password on a weekly basis. As a side note, MySQL user inside ProxySQL requires user and password to match the one on the backend MySQL servers. That's where we should start making use of ProxySQL native clustering support in Kubernetes, to automatically apply the configuration changes without the hassle of ConfigMap versioning and pod rescheduling.

In this blog post, we’ll show you how to run ProxySQL native clustering with headless service on Kubernetes. Our high-level architecture can be illustrated as below:

We have 3 Galera nodes running on bare-metal infrastructure deployed and managed by ClusterControl:

  • 192.168.0.21
  • 192.168.0.22
  • 192.168.0.23

Our applications are all running as pods within Kubernetes. The idea is to introduce two ProxySQL instances in between the application and our database cluster to serve as a reverse proxy. Applications will then connect to ProxySQL pods via Kubernetes service which will be load balanced and failover across a number of ProxySQL replicas.

The following is a summary of our Kubernetes setup:

root@kube1:~# kubectl get nodes -o wide
NAME    STATUS   ROLES    AGE     VERSION   INTERNAL-IP       EXTERNAL-IP   OS-IMAGE             KERNEL-VERSION      CONTAINER-RUNTIME
kube1   Ready    master   5m      v1.15.1   192.168.100.201   <none>        Ubuntu 18.04.1 LTS   4.15.0-39-generic   docker://18.9.7
kube2   Ready    <none>   4m1s    v1.15.1   192.168.100.202   <none>        Ubuntu 18.04.1 LTS   4.15.0-39-generic   docker://18.9.7
kube3   Ready    <none>   3m42s   v1.15.1   192.168.100.203   <none>        Ubuntu 18.04.1 LTS   4.15.0-39-generic   docker://18.9.7

ProxySQL Configuration via ConfigMap

Let's first prepare our base configuration which will be loaded into ConfigMap. Create a file called proxysql.cnf and add the following lines:

datadir="/var/lib/proxysql"

admin_variables=
{
    admin_credentials="proxysql-admin:adminpassw0rd;cluster1:secret1pass"
    mysql_ifaces="0.0.0.0:6032"
    refresh_interval=2000
    cluster_username="cluster1"
    cluster_password="secret1pass"
    cluster_check_interval_ms=200
    cluster_check_status_frequency=100
    cluster_mysql_query_rules_save_to_disk=true
    cluster_mysql_servers_save_to_disk=true
    cluster_mysql_users_save_to_disk=true
    cluster_proxysql_servers_save_to_disk=true
    cluster_mysql_query_rules_diffs_before_sync=3
    cluster_mysql_servers_diffs_before_sync=3
    cluster_mysql_users_diffs_before_sync=3
    cluster_proxysql_servers_diffs_before_sync=3
}

mysql_variables=
{
    threads=4
    max_connections=2048
    default_query_delay=0
    default_query_timeout=36000000
    have_compress=true
    poll_timeout=2000
    interfaces="0.0.0.0:6033;/tmp/proxysql.sock"
    default_schema="information_schema"
    stacksize=1048576
    server_version="5.1.30"
    connect_timeout_server=10000
    monitor_history=60000
    monitor_connect_interval=200000
    monitor_ping_interval=200000
    ping_interval_server_msec=10000
    ping_timeout_server=200
    commands_stats=true
    sessions_sort=true
    monitor_username="proxysql"
    monitor_password="proxysqlpassw0rd"
    monitor_galera_healthcheck_interval=2000
    monitor_galera_healthcheck_timeout=800
}

mysql_galera_hostgroups =
(
    {
        writer_hostgroup=10
        backup_writer_hostgroup=20
        reader_hostgroup=30
        offline_hostgroup=9999
        max_writers=1
        writer_is_also_reader=1
        max_transactions_behind=30
        active=1
    }
)

mysql_servers =
(
    { address="192.168.0.21" , port=3306 , hostgroup=10, max_connections=100 },
    { address="192.168.0.22" , port=3306 , hostgroup=10, max_connections=100 },
    { address="192.168.0.23" , port=3306 , hostgroup=10, max_connections=100 }
)

mysql_query_rules =
(
    {
        rule_id=100
        active=1
        match_pattern="^SELECT .* FOR UPDATE"
        destination_hostgroup=10
        apply=1
    },
    {
        rule_id=200
        active=1
        match_pattern="^SELECT .*"
        destination_hostgroup=20
        apply=1
    },
    {
        rule_id=300
        active=1
        match_pattern=".*"
        destination_hostgroup=10
        apply=1
    }
)

mysql_users =
(
    { username = "wordpress", password = "passw0rd", default_hostgroup = 10, transaction_persistent = 0, active = 1 },
    { username = "sbtest", password = "passw0rd", default_hostgroup = 10, transaction_persistent = 0, active = 1 }
)

proxysql_servers =
(
    { hostname = "proxysql-0.proxysqlcluster", port = 6032, weight = 1 },
    { hostname = "proxysql-1.proxysqlcluster", port = 6032, weight = 1 }
)

Some of the above configuration lines are explained per section below:

admin_variables

Pay attention on the admin_credentials variable where we used non-default user which is "proxysql-admin". ProxySQL reserves the default "admin" user for local connection via localhost only. Therefore, we have to use other users to access the ProxySQL instance remotely. Otherwise, you would get the following error:

ERROR 1040 (42000): User 'admin' can only connect locally

We also appended the cluster_username and cluster_password value in the admin_credentials line, separated by semicolon to allow automatic syncing to happen. All variables prefixed with cluster_* are related to ProxySQL native clustering and are self-explanatory.

mysql_galera_hostgroups

This is a new directive introduced for ProxySQL 2.x (our ProxySQL image is running on 2.0.5). If you would like to run on ProxySQL 1.x, do remove this part and use scheduler table instead. We already explained the configuration details in this blog post, How to Run and Configure ProxySQL 2.0 for MySQL Galera Cluster on Docker under "ProxySQL 2.x Support for Galera Cluster".

mysql_servers

All lines are self-explanatory, which is based on three database servers running in MySQL Galera Cluster as summarized in the following Topology screenshot taken from ClusterControl:

proxysql_servers

Here we define a list of ProxySQL peers:

  • hostname - Peer's hostname/IP address
  • port - Peer's admin port
  • weight - Currently unused, but in the roadmap for future enhancements
  • comment - Free form comment field

In Docker/Kubernetes environment, there are multiple ways to discover and link up container hostnames or IP addresses and insert them into this table, either by using ConfigMap, manual insert, via entrypoint.sh scripting, environment variables or some other means. In Kubernetes, depending on the ReplicationController or Deployment method used, guessing the pod's resolvable hostname in advanced is somewhat tricky unless if you are running on StatefulSet.

Check out this tutorial on StatefulState pod ordinal index which provides a stable resolvable hostname for the created pods. Combine this with headless service (explained further down), the resolvable hostname format would be:

{app_name}-{index_number}.{service}

Where {service} is a headless service, which explains where "proxysql-0.proxysqlcluster" and "proxysql-1.proxysqlcluster" come from. If you want to have more than 2 replicas, add more entries accordingly by appending an ascending index number relative to the StatefulSet application name.

Now we are ready to push the configuration file into ConfigMap, which will be mounted into every ProxySQL pod during deployment:

$ kubectl create configmap proxysql-configmap --from-file=proxysql.cnf

Verify if our ConfigMap is loaded correctly:

$ kubectl get configmap
NAME                 DATA   AGE
proxysql-configmap   1      7h57m

Creating ProxySQL Monitoring User

The next step before we start the deployment is to create ProxySQL monitoring user in our database cluster. Since we are running on Galera cluster, run the following statements on one of the Galera nodes:

mysql> CREATE USER 'proxysql'@'%' IDENTIFIED BY 'proxysqlpassw0rd';
mysql> GRANT USAGE ON *.* TO 'proxysql'@'%';

If you haven't created the MySQL users (as specified under mysql_users section above), we have to create them as well:

mysql> CREATE USER 'wordpress'@'%' IDENTIFIED BY 'passw0rd';
mysql> GRANT ALL PRIVILEGES ON wordpress.* TO 'wordpress'@'%';
mysql> CREATE USER 'sbtest'@'%' IDENTIFIED BY 'passw0rd';
mysql> GRANT ALL PRIVILEGES ON sbtest.* TO 'proxysql'@'%';

That's it. We are now ready to start the deployment.

Deploying a StatefulSet

We will start by creating two ProxySQL instances, or replicas for redundancy purposes using StatefulSet.

Let's start by creating a text file called proxysql-ss-svc.yml and add the following lines:

apiVersion: apps/v1
kind: StatefulSet
metadata:
  name: proxysql
  labels:
    app: proxysql
spec:
  replicas: 2
  serviceName: proxysqlcluster
  selector:
    matchLabels:
      app: proxysql
      tier: frontend
  updateStrategy:
    type: RollingUpdate
  template:
    metadata:
      labels:
        app: proxysql
        tier: frontend
    spec:
      restartPolicy: Always
      containers:
      - image: severalnines/proxysql:2.0.4
        name: proxysql
        volumeMounts:
        - name: proxysql-config
          mountPath: /etc/proxysql.cnf
          subPath: proxysql.cnf
        ports:
        - containerPort: 6033
          name: proxysql-mysql
        - containerPort: 6032
          name: proxysql-admin
      volumes:
      - name: proxysql-config
        configMap:
          name: proxysql-configmap
---
apiVersion: v1
kind: Service
metadata:
  annotations:
  labels:
    app: proxysql
    tier: frontend
  name: proxysql
spec:
  ports:
  - name: proxysql-mysql
    port: 6033
    protocol: TCP
    targetPort: 6033
  - name: proxysql-admin
    nodePort: 30032
    port: 6032
    protocol: TCP
    targetPort: 6032
  selector:
    app: proxysql
    tier: frontend
  type: NodePort

There are two sections of the above definition - StatefulSet and Service. The StatefulSet is the definition of our pods, or replicas and the mount point for our ConfigMap volume, loaded from proxysql-configmap. The next section is the service definition, where we define how the pods should be exposed and routed for internal or external network.

Verify the pod and service states:

$ kubectl get pods,svc
NAME             READY   STATUS    RESTARTS   AGE
pod/proxysql-0   1/1     Running   0          4m46s
pod/proxysql-1   1/1     Running   0          2m59s

NAME                      TYPE        CLUSTER-IP       EXTERNAL-IP   PORT(S)                         AGE
service/kubernetes        ClusterIP   10.96.0.1        <none>        443/TCP                         10h
service/proxysql          NodePort    10.111.240.193   <none>        6033:30314/TCP,6032:30032/TCP   5m28s

If you look at the pod's log, you would notice we got flooded with this warning:

$ kubectl logs -f proxysql-0
...
2019-08-01 19:06:18 ProxySQL_Cluster.cpp:215:ProxySQL_Cluster_Monitor_thread(): [WARNING] Cluster: unable to connect to peer proxysql-1.proxysqlcluster:6032 . Error: Unknown MySQL server host 'proxysql-1.proxysqlcluster' (0)

The above simply means proxysql-0 was unable to resolve "proxysql-1.proxysqlcluster" and connect to it, which is expected since we haven't created our headless service for DNS records that is going to be needed for inter-ProxySQL communication.

Kubernetes Headless Service

In order for ProxySQL pods to be able to resolve the anticipated FQDN and connect to it directly, the resolving process must be able to lookup the assigned target pod IP address and not the virtual IP address. This is where headless service comes into the picture. When creating a headless service by setting "clusterIP=None", no load-balancing is configured and no cluster IP (virtual IP) is allocated for this service. Only DNS is automatically configured. When you run a DNS query for headless service, you will get the list of the pods IP addresses.

Here is what it looks like if we look up the headless service DNS records for "proxysqlcluster" (in this example we had 3 ProxySQL instances):

$ host proxysqlcluster
proxysqlcluster.default.svc.cluster.local has address 10.40.0.2
proxysqlcluster.default.svc.cluster.local has address 10.40.0.3
proxysqlcluster.default.svc.cluster.local has address 10.32.0.2

While, the following output shows the DNS record for the standard service called "proxysql" which resolves to the clusterIP:

$ host proxysql
proxysql.default.svc.cluster.local has address 10.110.38.154

To create a headless service and attach it to the pods, one has to define the ServiceName inside the StatefulSet declaration, and the Service definition must have "clusterIP=None" as shown below. Create a text file called proxysql-headless-svc.yml and add the following lines:

apiVersion: v1
kind: Service
metadata:
  name: proxysqlcluster
  labels:
    app: proxysql
spec:
  clusterIP: None
  ports:
  - port: 6032
    name: proxysql-admin
  selector:
    app: proxysql

Create the headless service:

$ kubectl create -f proxysql-headless-svc.yml

Just for verification, at this point, we have the following services running:

$ kubectl get svc
NAME              TYPE        CLUSTER-IP      EXTERNAL-IP   PORT(S)                         AGE
kubernetes        ClusterIP   10.96.0.1       <none>        443/TCP                         8h
proxysql          NodePort    10.110.38.154   <none>        6033:30200/TCP,6032:30032/TCP   23m
proxysqlcluster   ClusterIP   None            <none>        6032/TCP                        4s

Now, check out one of our pod's log:

$ kubectl logs -f proxysql-0
...
2019-08-01 19:06:19 ProxySQL_Cluster.cpp:215:ProxySQL_Cluster_Monitor_thread(): [WARNING] Cluster: unable to connect to peer proxysql-1.proxysqlcluster:6032 . Error: Unknown MySQL server host 'proxysql-1.proxysqlcluster' (0)
2019-08-01 19:06:19 [INFO] Cluster: detected a new checksum for mysql_query_rules from peer proxysql-1.proxysqlcluster:6032, version 1, epoch 1564686376, checksum 0x3FEC69A5C9D96848 . Not syncing yet ...
2019-08-01 19:06:19 [INFO] Cluster: checksum for mysql_query_rules from peer proxysql-1.proxysqlcluster:6032 matches with local checksum 0x3FEC69A5C9D96848 , we won't sync.

You would notice the Cluster component is able to resolve, connect and detect a new checksum from the other peer, proxysql-1.proxysqlcluster on port 6032 via the headless service called "proxysqlcluster". Note that this service exposes port 6032 within Kubernetes network only, hence it is unreachable externally.

At this point, our deployment is now complete.

Connecting to ProxySQL

There are several ways to connect to ProxySQL services. The load-balanced MySQL connections should be sent to port 6033 from within Kubernetes network and use port 30033 if the client is connecting from an external network.

To connect to the ProxySQL admin interface from external network, we can connect to the port defined under NodePort section, 30032 (192.168.100.203 is the primary IP address of host kube3.local):

$ mysql -uproxysql-admin -padminpassw0rd -h192.168.100.203 -P30032

Use the clusterIP 10.110.38.154 (defined under "proxysql" service) on port 6032 if you want to access it from other pods in Kubernetes network.

Then perform the ProxySQL configuration changes as you wish and load them to runtime:

mysql> INSERT INTO mysql_users (username,password,default_hostgroup) VALUES ('newuser','passw0rd',10);
mysql> LOAD MYSQL USERS TO RUNTIME;

You will notice the following lines in one of the pods indicating the configuration syncing completes:

$ kubectl logs -f proxysql-0
...
2019-08-02 03:53:48 [INFO] Cluster: detected a peer proxysql-1.proxysqlcluster:6032 with mysql_users version 2, epoch 1564718027, diff_check 4. Own version: 1, epoch: 1564714803. Proceeding with remote sync
2019-08-02 03:53:48 [INFO] Cluster: detected peer proxysql-1.proxysqlcluster:6032 with mysql_users version 2, epoch 1564718027
2019-08-02 03:53:48 [INFO] Cluster: Fetching MySQL Users from peer proxysql-1.proxysqlcluster:6032 started
2019-08-02 03:53:48 [INFO] Cluster: Fetching MySQL Users from peer proxysql-1.proxysqlcluster:6032 completed

Keep in mind that the automatic syncing only happens if there is a configuration change in ProxySQL runtime. Therefore, it's vital to run "LOAD ... TO RUNTIME" statement before you can see the action. Don't forget to save the ProxySQL changes into the disk for persistency:

mysql> SAVE MYSQL USERS TO DISK;

Limitation

Note that there is a limitation to this setup due to ProxySQL does not support saving/exporting the active configuration into a text configuration file that we could use later on to load into ConfigMap for persistency. There is a feature request for this. Meanwhile, you could push the modifications to ConfigMap manually. Otherwise, if the pods were accidentally deleted, you would lose your current configuration because the new pods would be bootstrapped by whatever defined in the ConfigMap.

Special thanks to Sampath Kamineni, who sparked the idea of this blog post and provide insights about the use cases and implementation.

MySQL Load Balancing: Migrating ProxySQL from On-Prem to AWS EC2

$
0
0

Migrations between different environments are uncommon in database world. Migrations from one provider to another one. Moving from one datacenter to another. All of this happens on a regular basis. Organisations search for expense reduction, better flexibility and velocity. Those who owned their datacenter look forward to switch to one of the cloud providers where they can benefit from better scalability and handling capacity changes. Migrations touch all elements of the database environment - databases themselves but also the proxy and caching layer. Moving databases around is tricky but it is also hard to manage multiple proxy instances, ensuring that the configuration is in sync across all of them.

In this blog post we will take a look at challenges related to one particular piece of migration - migrating ProxySQL proxy layer from on-prem environment to EC2. Please keep in mind this is just an example, the truth is, the majority of the migration scenarios will look pretty much similar so the suggestions we are going to give in this blog post should apply to the majority of the cases. Let’s take a look at the initial setup.

Initial On-Prem Environment

The initial, on-prem setup is fairly simple - we have a three node Galera Cluster, two ProxySQL instances which are configured to route the traffic to backend databases. Each ProxySQL instance has a Keepalived colocated. Keepalived manages Virtual IP and assigns it to one of the available ProxySQL instances. Should that instance fails, VIP will be moved to the other ProxySQL, which will commence serving the traffic. Application servers use VIP to connect to and they are not aware of the setup of the proxy and database tiers.

Migrating to an AWS EC2 Environment.

There are a couple of prerequisites that are required before we can plan a migration. Migrating the proxy layer is no different in this regard. First of all, we have to have a network access between existing, on-prem environment and EC2. We will not be going into details here as there are numerous options to accomplish that. AWS provides services like AWS Direct Connect or hybrid cloud integration in Amazon Virtual Private Cloud. You can use solutions like setting up OpenVPN server or even use SSH tunneling to do the trick. All depends on the available hardware and software options at your disposal and how flexible you want the solution to be. Once the connectivity is there, let’s stop a bit and think how the setup should look like.

From the ProxySQL standpoint, there is one main concern - how to ensure that the configuration of the ProxySQL instances in the EC2 will be in sync with the configuration of ProxySQL instances on-prem? This may not be a big deal if your configuration is pretty much stable - you are not adding query rules, you are not tweaking the configuration. In that case it will be enough just to apply the existing configuration to newly created ProxySQL instances in EC2. There are a couple of ways to do that. First of all, if you are ClusterControl user, the simplest way will be to use “Synchronize Instances” job which is designed to do exactly this.

Another option could be to use dump command from SQLite: http://www.sqlitetutorial.net/sqlite-dump/

If you store your configuration as a part of some sort of infrastructure orchestration tool (Ansible, Chef, Puppet), you can easily reuse those scripts to provision new ProxySQL instances with proper configuration.

What if the configuration changes quite often? Well, there are additional options to consider. First of all, most likely all the solutions above would work too, as long as the ProxySQL configuration is not changing every couple of minutes (which is highly unlikely) - you can always sync the configuration straight before you do the switchover.

For the cases where configuration changes quite often you can consider setting up a ProxySQL cluster. The setup has been explained in detail in our blog post: https://severalnines.com/blog/how-cluster-your-proxysql-load-balancers. If you would like to use this solution in a hybrid setup, over WAN connection, you may want to increase cluster_check_interval_ms a bit from default 1 second to a higher value (5 - 10 seconds). ProxySQL cluster will ensure that all the configuration changes made in on-prem setup will be replicated by ProxySQL instances in EC2.

Final thing to consider - how to switch to correct servers in ProxySQL? The gist is - ProxySQL stores list of backend MySQL servers to connect to. It tracks their health and monitors latency. In the setup we discuss our on-prem ProxySQL servers hold list of backend servers which are also located on-prem. This is the configuration we will sync to the EC2 ProxySQL servers. This is not a hard problem to tackle and there are a couple of ways to work around it.

For example, you can add servers in OFFLINE_HARD mode in a separate hostgroup - this will imply that the nodes are not available and using a new hostgroup for them will ensure that ProxySQL will not check their state like it does for Galera nodes configured in hostgroups used for read/write splitting.

Alternatively you can simply skip those nodes for now and, while doing the switchover, remove existing servers and then run couple INSERT commands to add backend nodes from EC2.

Conclusion

As you can see, the process of migrating ProxySQL from on-prem setups to cloud is quite easy to accomplish - as long as you have network connectivity, remaining steps are far from complex. We hope this short blog post helped you to understand what’s required in this process and how to plan it.

Database Load Balancing with ProxySQL & AWS Aurora

$
0
0

ProxySQL is a proven solution that helps database administrators dealing with the requirements for high availability of their databases. Because it is SQL-aware, it can also be used for shaping the traffic heading towards databases - you can route queries to the particular nodes, you can rewrite queries should that be needed, you can also throttle the traffic, implement SQL firewall, create a mirror of your traffic and send it to a separate hostgroup. 

ProxySQL 2.0.5 natively supports Galera Cluster, MySQL Replication and MySQL Group Replication. Unfortunately it does not, by default, support AWS Aurora; but there is still a workaround you can use.

You may be asking yourself, why should I bother with ProxySQL when AWS provides me with an endpoint which will do the read-write split for me? That’s indeed the case but it is just the r/w split. ProxySQL, on the other hand, gives you an opportunity for not only separating reads from writes but also to take control of your database traffic. ProxySQL often can save your databases from being overloaded by just rewriting a single query.

ProxySQL 2.0.5 and AWS Aurora

Should you decide to give ProxySQL a try, there are a couple of steps you have to take. First, you will need an EC2 instance to install the ProxySQL on. Once you have the instance up and running, you can install the latest ProxySQL. We would recommend to use repository for that. You can set it up by following the steps in the documentation page: https://github.com/sysown/proxysql/wiki. For Ubuntu 16.04 LTS, which we used, you have to run:

apt-get install -y lsb-release

wget -O - 'https://repo.proxysql.com/ProxySQL/repo_pub_key' | apt-key add -

echo deb https://repo.proxysql.com/ProxySQL/proxysql-2.0.x/$(lsb_release -sc)/ ./ \

| tee /etc/apt/sources.list.d/proxysql.list

Then it’s time to install ProxySQL:

apt-get update

apt-get install proxysql

Then we have to verify that we do have the connectivity from our ProxySQL instance to AWS Aurora nodes. We will use direct endpoints for the connectivity.

We can easily test the connectivity using telnet to the correct endpoint on port 3306:

root@ip-10-0-0-191:~# telnet dbtest-instance-1.cqb1vho43rod.eu-central-1.rds.amazonaws.com 3306

Trying 10.0.0.53...

Connected to dbtest-instance-1.cqb1vho43rod.eu-central-1.rds.amazonaws.com.

Escape character is '^]'.

J

5.7.12_2>ZWP-&[Ov8NzJ:H#Mmysql_native_password^CConnection closed by foreign host.

First one looks good. We’ll proceed with the second Aurora node:

root@ip-10-0-0-191:~# telnet dbtest-instance-1-eu-central-1a.cqb1vho43rod.eu-central-1.rds.amazonaws.com 3306

Trying 10.0.1.90...

Connected to dbtest-instance-1-eu-central-1a.cqb1vho43rod.eu-central-1.rds.amazonaws.com.

Escape character is '^]'.

J

tr3'3rynMmysql_native_password^CConnection closed by foreign host.

Works great too. If you cannot connect to Aurora nodes you need to ensure that all the security bits are aligned properly: check the VPC configuration, see if ProxySQL node can access VPC of Aurora, check if security groups allow the traffic to pass through. AWS network security layer can be tricky to configure if you don’t have the experience but finally you should be able to make it work.

Having the connectivity sorted out we will need to create a user on Aurora. We will use that user for monitoring Aurora nodes in ProxySQL. First, we may have to install MySQL client on ProxySQL node:

root@ip-10-0-0-191:~# apt install mysql-client-core-5.7

Then we will use the endpoint of the cluster to connect to the writer and create user on it:

root@ip-10-0-0-191:~# mysql -h dbtest.cluster-cqb1vho43rod.eu-central-1.rds.amazonaws.com -u root -ppassword

mysql> CREATE USER 'monuser'@'10.0.0.191' IDENTIFIED BY 'mon1t0r';

Query OK, 0 rows affected (0.02 sec)

mysql> GRANT REPLICATION CLIENT ON *.* TO 'monuser'@'10.0.0.191';

Query OK, 0 rows affected (0.00 sec)

Having this done we can log into ProxySQL admin interface (by default on port 6032) to define the monitor user and its password.

root@ip-10-0-0-191:~# mysql -P6032 -u admin -padmin -h127.0.0.1

mysql> SET mysql-monitor_username='monuser';

Query OK, 1 row affected (0.00 sec)


mysql> SET mysql-monitor_password='mon1t0r';

Query OK, 1 row affected (0.00 sec)

mysql> LOAD MYSQL VARIABLES TO RUNTIME;

Query OK, 0 rows affected (0.00 sec)

mysql> SAVE MYSQL VARIABLES TO DISK;

Query OK, 116 rows affected (0.00 sec)

Now it’s time to define Aurora nodes in ProxySQL:

mysql> INSERT INTO mysql_servers (hostgroup_id, hostname) VALUES (10, 'dbtest-instance-1.cqb1vho43rod.eu-central-1.rds.amazonaws.com'), (20, 'dbtest-instance-1-eu-central-1a.cqb1vho43rod.eu-central-1.rds.amazonaws.com');

Query OK, 2 rows affected (0.01 sec)

As you can see, we use their direct endpoints as the hostname. Once this is done, we will use mysql_replication_hostgroup table to define reader and writer hostgroups. We will also have to pass the correct check type - by default ProxySQL looks for ‘read_only’ variable while Aurora uses ‘innodb_read_only’ to differentiate between the writer and readers.

mysql> SHOW CREATE TABLE mysql_replication_hostgroups\G

*************************** 1. row ***************************

       table: mysql_replication_hostgroups

Create Table: CREATE TABLE mysql_replication_hostgroups (

    writer_hostgroup INT CHECK (writer_hostgroup>=0) NOT NULL PRIMARY KEY,

    reader_hostgroup INT NOT NULL CHECK (reader_hostgroup<>writer_hostgroup AND reader_hostgroup>=0),

    check_type VARCHAR CHECK (LOWER(check_type) IN ('read_only','innodb_read_only','super_read_only')) NOT NULL DEFAULT 'read_only',

    comment VARCHAR NOT NULL DEFAULT '', UNIQUE (reader_hostgroup))

1 row in set (0.00 sec)


mysql> INSERT INTO mysql_replication_hostgroups VALUES (10, 20, 'innodb_read_only', 'Aurora');

Query OK, 1 row affected (0.00 sec)

mysql> LOAD MYSQL SERVERS TO RUNTIME;

Query OK, 0 rows affected (0.00 sec)

This is it, we can now see how ProxySQL configured the nodes in runtime configuration:

mysql> SELECT hostgroup_id, hostname, port  FROM runtime_mysql_servers;

+--------------+-----------------------------------------------------------------------------+------+

| hostgroup_id | hostname                                                                    | port |

+--------------+-----------------------------------------------------------------------------+------+

| 10           | | 3306 |

| 20           | dbtest-instance-1-eu-central-1a.cqb1vho43rod.eu-central-1.rds.amazonaws.com | 3306 |

| 20           | dbtest-instance-1.cqb1vho43rod.eu-central-1.rds.amazonaws.com               | 3306 |

+--------------+-----------------------------------------------------------------------------+------+

3 rows in set (0.00 sec)

As you can see, dbtest-instance-1.cqb1vho43rod.eu-central-1.rds.amazonaws.com is the writer. Let’s try the failover now:

mysql> SELECT hostgroup_id, hostname, port  FROM runtime_mysql_servers;

+--------------+-----------------------------------------------------------------------------+------+

| hostgroup_id | hostname                                                                    | port |

+--------------+-----------------------------------------------------------------------------+------+

| 10           | dbtest-instance-1-eu-central-1a.cqb1vho43rod.eu-central-1.rds.amazonaws.com | 3306 |

| 20           | dbtest-instance-1-eu-central-1a.cqb1vho43rod.eu-central-1.rds.amazonaws.com | 3306 |

| 20           | dbtest-instance-1.cqb1vho43rod.eu-central-1.rds.amazonaws.com               | 3306 |

+--------------+-----------------------------------------------------------------------------+------+

3 rows in set (0.00 sec)

As you can see, writer (hostgroup 10) has changed to the second node.

Conclusion

This is basically it - as you can see setting up AWS Aurora nodes in ProxySQL is pretty much simple process.

Automated Deployment of MySQL Galera Cluster to Amazon AWS with Puppet

$
0
0

Deployment and management your database environment can be a tedious task. It's very common nowadays to use tools for automating your deployment to make these tasks easier. Automation solutions such as Chef, Puppet, Ansible, or SaltStack are just some of the ways to achieve these goals.

This blog will show you how to use Puppet to deploy a Galera Cluster (specifically Percona XtraDB Cluster or PXC) utilizing ClusterControl Puppet Modules. This module makes the deployment, setup, and configuration easier than coding yourself from scratch. You may also want to check out one of our previous blogs about deploying a Galera Cluster using Chef,  “How to Automate Deployment of MySQL Galera Cluster Using S9S CLI and Chef.”

Our S9S CLI tools are designed to be used in the terminal (or console) and can be utilized to automatically deploy databases. In this blog, we'll show you how to do deploy a Percona XtraDB Cluster on AWS using Puppet, using ClusterControl and its s9s CLI tools to help automate the job.

Installation and Setup  For The Puppet Master and Agent Nodes

On this blog, I used Ubuntu 16.04 Xenial as the target Linux OS for this setup. It might be an old OS version for you, but we know it works with RHEL/CentOS and Debian/Ubuntu recent versions of the OS. I have two nodes that I used on this setup locally with the following host/IP:

Master Hosts:

     IP = 192.168.40.200

     Hostname = master.puppet.local

Agent Hosts:

     IP = 192.168.40.20

     Hostname = clustercontrol.puppet.local

Let's go over through the steps.

1) Setup the Master

## Install the packages required

wget https://apt.puppetlabs.com/puppet6-release-xenial.deb

sudo dpkg -i puppet6-release-xenial.deb

sudo apt update

sudo apt install -y puppetserver

## Now, let's do some minor configuration for Puppet

sudo vi /etc/default/puppetserver

## edit from 

JAVA_ARGS="-Xms2g -Xmx2g -Djruby.logger.class=com.puppetlabs.jruby_utils.jruby.Slf4jLogger"

## to

JAVA_ARGS="-Xms512m -Xmx512m -Djruby.logger.class=com.puppetlabs.jruby_utils.jruby.Slf4jLogger"

## add alias hostnames in /etc/hosts

sudo vi /etc/hosts

## and add

192.168.40.10 client.puppet.local

192.168.40.200 server.puppet.local

## edit the config for server settings.

sudo vi /etc/puppetlabs/puppet/puppet.conf

## This can be depending on your setup so you might approach it differently than below. 

[master]

vardir = /opt/puppetlabs/server/data/puppetserver

logdir = /var/log/puppetlabs/puppetserver

rundir = /var/run/puppetlabs/puppetserver

pidfile = /var/run/puppetlabs/puppetserver/puppetserver.pid

codedir = /etc/puppetlabs/code


dns_alt_names = master.puppet.local,master


[main]

certname = master.puppet.local

server = master.puppet.local 

environment = production

runinterval = 15m

## Generate a root and intermediate signing CA for Puppet Server

sudo /opt/puppetlabs/bin/puppetserver ca setup

## start puppet server

sudo systemctl start puppetserver

sudo systemctl enable puppetserver

2) Setup the Agent/Client Node

## Install the packages required

wget https://apt.puppetlabs.com/puppet6-release-xenial.deb

sudo dpkg -i puppet6-release-xenial.deb

sudo apt update

sudo apt install -y puppet-agent

## Edit the config settings for puppet client

sudo vi /etc/puppetlabs/puppet/puppet.conf

And add the example configuration below,

[main]

certname = clustercontrol.puppet.local

server = master.puppet.local

environment = production

runinterval = 15m

3) Authenticating (or Signing the Certificate Request) for Master/Client Communication

## Go back to the master node and run the following to view the view outstanding requests.                 

sudo /opt/puppetlabs/bin/puppetserver ca list

## The Result

Requested Certificates:

    clustercontrol.puppet.local   (SHA256) 0C:BA:9D:A8:55:75:30:27:31:05:6D:F1:8C:CD:EE:D7:1F:3C:0D:D8:BD:D3:68:F3:DA:84:F1:DE:FC:CD:9A:E1

## sign a request from agent/client

sudo /opt/puppetlabs/bin/puppetserver ca sign --certname clustercontrol.puppet.local

## The Result

Successfully signed certificate request for clustercontrol.puppet.local

## or you can also sign all request

sudo /opt/puppetlabs/bin/puppetserver ca sign --all

## in case you want to revoke, just do

sudo /opt/puppetlabs/bin/puppetserver ca revoke --certname <AGENT_NAME>

## to list all unsigned,

sudo /opt/puppetlabs/bin/puppetserver ca list --all

## Then verify or test in the client node,

## verify/test puppet agent

sudo /opt/puppetlabs/bin/puppet agent --test

Scripting Your Puppet Manifests and Setting up the ClusterControl Puppet Module

Our ClusterControl Puppet module can be downloaded here https://github.com/severalnines/puppet. Otherwise, you can also easily grab the Puppet Module from Puppet-Forge. We're regularly updating and modifying the Puppet Module, so we suggest you grab the github copy to ensure the most up-to-date version of the script. 

You should also take into account that our Puppet Module is tested on CentOS/Ubuntu running with the most updated version of Puppet (6.7.x.). For this blog, the Puppet Module is tailored to work with the most recent release of ClusterControl (which as of this writing is 1.7.3). In case you missed it, you can check out our releases and patch releases over here.

1) Setup the ClusterControl Module in the Master Node

# Download from github and move the file to the module location of Puppet:

wget https://github.com/severalnines/puppet/archive/master.zip -O clustercontrol.zip; unzip -x clustercontrol.zip; mv puppet-master /etc/puppetlabs/code/environments/production/modules/clustercontrol

2) Create Your Manifest File and Add the Contents as Shown Below

vi /etc/puppetlabs/code/environments/production/manifests/site.pp

Now, before we proceed, we need to discuss the manifest script and the command to be executed. First, we'll have to define the type of ClusterControl and its variables we need to provide. ClusterControl requires every setup to have token and SSH keys be specified and provided  accordingly. Hence, this can be done by running the following command below:

## Generate the key

bash /etc/puppetlabs/code/environments/production/modules/clustercontrol/files/s9s_helper.sh --generate-key

## Then, generate the token

bash /etc/puppetlabs/code/environments/production/modules/clustercontrol/files/s9s_helper.sh --generate-token

Now, let's discuss what we'll have to input within the manifest file one by one.

node 'clustercontrol.puppet.local' { # Applies only to mentioned node. If nothing mentioned, applies to all.

        class { 'clustercontrol':

            is_controller => true,

ip_address => '<ip-address-of-your-cluster-control-hosts>',

mysql_cmon_password => '<your-desired-cmon-password>',

                  api_token => '<api-token-generated-earlier>'

        }

Now, we'll have to define the <ip-address-of-your-cluster-control-hosts> of your ClusterControl node where it's actually the clustercontrol.puppet.local in this example. Specify also the cmon password and then place the API token as generated by the command mentioned earlier.

Afterwards, we'll use ClusterControlRPC to send a POST request to create an AWS entry:

exec { 'add-aws-credentials':

            path  => ['/usr/bin', '/usr/sbin', '/bin'],  

    command => "echo '{\"operation\" : \"add_credentials\", \"provider\" : aws, \"name\" : \"<your-aws-credentials-name>\", \"comment\" : \"<optional-comment-about-credential-entry>\", \"credentials\":{\"access_key_id\":\"<aws-access-key-id>\",\"access_key_secret\" : \"<aws-key-secret>\",\"access_key_region\" : \"<aws-region>\"}}'  | curl -sX POST -H\"Content-Type: application/json\" -d @- http://localhost:9500/0/cloud"

}

The placeholder variables I set are self-explanatory. You need to provide the desired credential name for your AWS, provide a comment if you wanted to, provided the AWS access key id, your AWS key secret and AWS region where you'll be deploying the Galera nodes.

Lastly, we'll have to run the command using s9s CLI tools.

exec { 's9s':

  path        => ['/usr/bin', '/usr/sbin', '/bin'],

  onlyif      => "test -f $(/usr/bin/s9s cluster --list --cluster-format='%I' --cluster-name '<cluster-name>' 2> /dev/null) > 0 ", 

  command     => "/usr/bin/s9s cluster --create --cloud=aws --vendor percona --provider-version 5.7  --containers=<node1>,<node2>,<node3> --nodes=<node1>,<node2>,<node3> --cluster-name=<cluster-name> --cluster-type=<cluster-type> --image <aws-image> --template <aws-instance-type> --subnet-id <aws-subnet-id> --region <aws-region> --image-os-user=<image-os-user> --os-user=<os-user> --os-key-file <path-to-rsa-key-file> --vpc-id <aws-vpc-id> --firewalls <aws-firewall-id> --db-admin <db-user> --db-admin-passwd <db-password> --wait --log",

  timeout     => 3600,

  logoutput   => true

}

Let’s look at the key-points of this command. First, the "onlyif" is defined by a conditional check to determine if such cluster name exists, then do not run since it's already added in the cluster. We'll proceed on running the command which utilizes the S9S CLI Tools. You'll need to specify the AWS IDs in the placeholder variables being set. Since the placeholder names are self-explanatory, its values will be taken from your AWS Console or by using the AWS CLI tools.

Now, let's check the succeeding steps remaining.

3) Prepare the Script for Your Manifest File

# Copy the example contents below (edit according to your desired values) and paste it to the manifest file, which is the site.pp.

node 'clustercontrol.puppet.local' { # Applies only to mentioned node. If nothing mentioned, applies to all.

        class { 'clustercontrol':

is_controller => true,

ip_address => '192.168.40.20',

mysql_cmon_password => 'R00tP@55',

mysql_server_addresses => '192.168.40.30,192.168.40.40',

api_token => '0997472ab7de9bbf89c1183f960ba141b3deb37c'

        }


exec { 'add-aws-credentials':

path  => ['/usr/bin', '/usr/sbin', '/bin'],  

command => "echo '{\"operation\" : \"add_credentials\", \"provider\" : aws, \"name\" : \"paul-aws-sg\", \"comment\" : \"my SG AWS Connection\", \"credentials\":{\"access_key_id\":\"XXXXXXXXXXX\",\"access_key_secret\" : \"XXXXXXXXXXXXXXX\",\"access_key_region\" : \"ap-southeast-1\"}}'  | curl -sX POST -H\"Content-Type: application/json\" -d @- http://localhost:9500/0/cloud"

}


exec { 's9s':

path        => ['/usr/bin', '/usr/sbin', '/bin'],

onlyif      => "test -f $(/usr/bin/s9s cluster --list --cluster-format='%I' --cluster-name 'cli-aws-repl' 2> /dev/null) > 0 ", 

command     => "/usr/bin/s9s cluster --create --cloud=aws --vendor percona --provider-version 5.7  --containers=db1,db2,db3 --nodes=db1,db2,db3 --cluster-name=cli-aws-repl --cluster-type=galera --image ubuntu18.04 --template t2.small --subnet-id subnet-xxxxxxxxx  --region ap-southeast-1 --image-os-user=s9s --os-user=s9s --os-key-file /home/vagrant/.ssh/id_rsa --vpc-id vpc-xxxxxxx --firewalls sg-xxxxxxxxx --db-admin root --db-admin-passwd R00tP@55 --wait --log",

timeout     => 3600,

logoutput   => true

}

}

Let's Do the Test and Run Within the Agent Node

/opt/puppetlabs/bin/puppet agent --test  

The End Product

Now, let's have a look once the agent is being ran. Once you have this running, visiting the URLhttp://<cluster-control-host>/clustercontrol, you'll be asked by ClusterControl to register first. 

Now, you wonder where's the result after we had run the RPC request with resource name 'add-aws-credentials'in our manifest file, it'll be found in the Integrations section within the ClusterControl.  Let's see how it looks like after the Puppet perform the runbook.

You can modify this in accordance to your like through the UI but you can also modify this by using our RPC API. 

Now, let's check the cluster,

From the UI view, it shows that it has been able to create the cluster, display the cluster in the dashboard, and also shows the job activities that were performed in the background.

Lastly, our AWS nodes are already present now in our AWS Console. Let's check that out,

All nodes are running healthy and are expected to its designated names and region.

Conclusion

In this blog, we are able to deploy a Galera/Percona Xtradb Cluster using automation with Puppet. We did not create the code from scratch, nor did we use any external tools that would have complicated the task. Instead, we used the CusterControl Module and the S9S CLI tool to build and deploy a highly available Galera Cluster.


A Guide to MySQL Galera Cluster Restoration Using mysqldump

$
0
0

Using logical backup programs like mysqldump is a common practice performed by MySQL admins for backup and restore (the process of moving a database from one server to another) and is also the most efficient way to perform a  database mass modification using a single text file. 

When doing this for MySQL Galera Cluster, however, the same rules apply except for the fact that it takes a lot of time to restore a dump file into a running Galera Cluster. In this blog, we will look at the best way to restore a Galera Cluster using mysqldump.

Galera Cluster Restoration Performance

One of the most common misconceptions about Galera Cluster is that restoring a database into a three-node cluster is faster than doing it to a standalone node. This is definitely incorrect when talking about a stateful service, like datastore and filesystem. To keep in sync, every member has to keep up with whatever changes happened with the other members. This is where locking, certifying, applying, rollbacking, committing are forced to be involved into the picture to ensure no data loss along the process, because for a database service, data loss is a big no-no.

Let's make some comparisons to see and understand the impact. Suppose we have a 2 GB of dump file for database 'sbtest'. We usually would load the data into the cluster via two endpoints:

  • load balancer host 
  • one of the database hosts

As for control measurement, we are also going to restore on a standalone node. Variable pxc_strict_mode is set to PERMISSIVE on all Galera nodes.

The backup was created on one of the Galera nodes with the following command:

$ mysqldump --single-transaction sbtest > sbtest.sql

We are going to use 'pv' to observe the progress and measure the restoration performance. Thus, the restore command is:

$ pv sbtest.sql | mysql -uroot -p sbtest

The restorations were repeated 3 times for each host type as shown in the following table:

Endpoint Type

Database Server

Restoration Time

(seconds)

Restoration Speed

(MiB/s)

Standalone

MySQL 5.7.25

3m 29s

3m 36s

3m 31s

8.73

8.44

8.64

Load

Balancer

HAProxy -> PXC 5.7.25 (multiple DB hosts - all active, leastconn)

5m 45s

6m 03s

5m 43s

5.29

5.02

5.43

ProxySQL -> PXC 5.7.25

(single DB host - single writer hostgroup)

6m 07s

7m 00s

6m 54s

4.97

4.34

4.41

Galera

Cluster

PXC 5.7.25

(single DB host)

5m 22s

6m 00s

5m 28s

5.66

5.07

5.56


Note that the way pv measures the restoration speed is based on the mysqldump text file that is being passed through it through pipe. It's not highly accurate but good enough to give us some measurements to compare. All hosts are having the same specs and running as a virtual machine on the same underlying physical hardware.

The following column chart summarizes the average time it takes to restore the mysqldump:

Standalone host is the clear winner with 212 seconds, while ProxySQL is the worst for this workload; almost two-times slower if compared to standalone.

The following column chart summarizes the average speed pv measures when restoring the mysqldump:

As expected, restoration on the standalone note is way faster with 8.6 MiB/s on average, 1.5x better than restoration directly on the Galera node.

To summarize our observation, restoring directly on a Galera Cluster node is way slower than a standalone host. Restoring through a load balancer is even worse.

Turning Off Galera Replication

Running mysqldump on a Galera Cluster will cause every single DML statement (INSERTs in this case) being broadcasted, certified and applied by Galera nodes through its group communication and replication library. Thus, the fastest way to restore a mysqldump is to perform the restoration on a single node, with Galera Replication turned off, kind of making it running like a standalone mode. The steps are:

  1. Pick one Galera node as the restore node. Stop the rest of the nodes.
  2. Turn off Galera Replication on the restore node.
  3. Perform the restoration.
  4. Stop and bootstrap the restore node.
  5. Force the remaining node to re-join and re-sync via SST.

For example, let's say we choose db1 to be the restore node. Stop the other nodes (db2 and db3) one node at a time so the nodes would leave the cluster gracefully:

$ systemctl stop mysql #db2

$ systemctl stop mysql #db3

Note: For ClusterControl users, simply go to Nodes -> pick the DB node -> Node Actions -> Stop Node. Do not forget to turn off ClusterControl automatic recovery for cluster and nodes before performing this exercise.

Now, login to db1 and turn the Galera node into a standalone node by setting wsrep_provider variable to 'none':

$ mysql -uroot -p

mysql> SET GLOBAL wsrep_provider = 'none';

mysql> SHOW STATUS LIKE 'wsrep_connected';

+-----------------+-------+

| Variable_name   | Value |

+-----------------+-------+

| wsrep_connected | OFF   |

+-----------------+-------+

Then perform the restoration on db1:

$ pv sbtest.sql | mysql -uroot -p sbtest

1.78GiB 0:02:46 [  11MiB/s] [==========================================>] 100%

The restoration time has improved 2x to 166 seconds (down from ~337 seconds) with 11MiB/s (up from ~5.43MiB/s). Since this node is now has the most updated data, we have to bootstrap the cluster based on this node and let the other nodes rejoin the cluster and force to re-syncing everything back. 

On db1, stop the MySQL service and start it again in bootstrap mode:

$ systemctl status mysql #check whether mysql or mysql@bootstrap is running

$ systemctl status mysql@bootstrap #check whether mysql or mysql@bootstrap is running

$ systemctl stop mysql # if mysql was running

$ systemctl stop mysql@bootstrap # if mysql@bootstrap was running

$ systemctl start mysql@bootstrap

While on every remaining node, wipe out the datadir (or you can just simply delete grastate.dat file) and start the MySQL service:

$ rm /var/lib/mysql/grastate.dat  # remove this file to force SST

$ systemctl start mysql

Do perform the start up process one node at a time. Once the working node is synced, proceed with the next node and so on.

Note: For ClusterControl users, you could skip the above step because ClusterControl can be configured to force SST during the bootstrap process. Just click on the Cluster Actions -> Bootstrap Cluster and pick the db1 as the bootstrap node and toggle on the option for "Clear MySQL Datadir on Joining nodes", as shown below:

We could also juice up the restoration process by allowing bigger packet size for the mysql client:

$ pv sbtest.sql | mysql -uroot -p --max_allowed_packet=2G sbtest

At this point, our cluster should be running with the restored data. Take note that in this test case, the total restoration time for the cluster is actually longer than if we performed the restoration directly on the Galera node thanks to our small dataset. If you have a huge mysqldump file to restore, believe us, this is one of the best ways you should do.

That's it for now. Happy restoring!


The Easy Way to Deploy a MySQL Galera Cluster on AWS

$
0
0

ClusterControl 1.7.3 comes with a notable improvement in cloud integration. It is possible to deploy a MySQL and PostgreSQL replication cluster to the cloud, as well as automatically launch a cloud instance and scale out your database cluster by adding a new database node. 

This blog post showcases how to easily deploy a Galera Cluster using ClusterControl on AWS. This new feature is part of the ClusterControl Community Edition, which comes with free deployment and monitoring features. This means that you can take advantage of this feature for no cost!

ClusterControl Database Cluster Architecture

The following diagram summarizes our overall database clusters architecture.

ClusterControl Database Cluster Architecture

The ClusterControl server is located outside of the AWS infrastructure, allowing for fair visibility to our database cluster (located in Frankfurt: eu-central-1). The ClusterControl server MUST have a dedicated public IP address. This is because the IP address will be granted by ClusterControl on the database server and AWS security group. The Galera database version that we are going to deploy is MariaDB Cluster 10.3, using ClusterControl 1.7.3.

Preparing the AWS Environment

ClusterControl is able to deploy a database cluster on supported cloud platforms, namely AWS, Google Cloud Platform (GCP), and Microsoft Azure. The first thing we have to configure is to get the AWS access keys to allow ClusterControl to perform programmatic requests to AWS services. You could use the root account access key, but this is not the recommended way. It's better to create a dedicated Identity and Access Management (IAM) user solely for this purpose.

Login to your AWS Console -> My Security Credentials -> Users -> Add User. Specify the user and pick "Programmatic Access" as the Access Type:

Adding a User in AWS Console

In the next page, create a new user group by clicking the "Create group" button and give the group name "DatabaseAutomation". Assign the following access type:

  • AmazonEC2FullAccess
  • AmazonVPCFullAccess
  • AmazonS3FullAccess (only if you plan to store the database backup on AWS S3)

Tick the DatabaseAutomation checkbox and click "Add user to group":

Add User Permissions Amazon AWS

Optionally, you can assign tags on the next page. Otherwise, just proceed to create the user. You should get the two most important things, Access key ID and Secret access key.

Add User Confirmation AWS

Download the CSV file and store it somewhere safe. We are now good to automate the deployment on cloud.

Install ClusterControl on the respective server:

$ whoami

root

$ wget http://severalnines.com/downloads/cmon/install-cc

$ chmod 755 install-cc

$ ./install-cc

Follow the installation instructions and go to http://192.168.0.11/clustercontrol and create the super admin user and password. 

To allow ClusterControl to perform automatic deployment on cloud, one has to create cloud credentials for the selected region with a valid AWS key ID and secret. Go to Sidebar -> Integrations -> Cloud Providers -> Add your first Cloud Credential -> Amazon Web Services and enter the required details and choose Frankfurt as the default region:

Add Cloud Credentials ClusterControl

This credential will be used by ClusterControl to automate the cluster deployment and management. At this point, we are ready to deploy our first cluster.

Database Cluster Deployment

Go to Deploy -> Deploy in the Cloud -> MySQL Galera -> MariaDB 10.3 -> Configure Cluster to proceed to the next page. 

Under Configure Cluster section, ensure the number of nodes is 3 and give a cluster name and MySQL root password:

Configure MySQL Galera Cluster in ClusterControl

Under Select Credential, choose a credential called "AWS Frankfurt" and proceed to the next page by clicking "Select Virtual Machine". Choose the preferred operating system and instance size. It's recommended to run our infrastructure inside a private cloud so we could get a dedicated internal IP address for our cloud instances and the hosts are not directly exposed to the public network. Click "Add New" button next to Virtual Private Cloud (VPC) field and give a subnet of 10.10.0.0/16 to this network:

Add VPC

The VPC that we have created is a private cloud and does not have internet connectivity. In order for ClusterControl to be able to deploy and manage the hosts from outside AWS network, we have to allow internet connectivity to this VPC. To do this, we have to do the following:

  1. Create an internet gateway
  2. Add external routing to the route table
  3. Associate the subnet to the route table

To create an internet gateway, login to AWS Management Console -> VPC -> Internet Gateways -> Create internet gateway ->assign a name for this gateway. Then select the created gateway from the list and go to Actions -> Attach to VPC -> select the VPC for the dropdown list -> Attach. We have now attach an internet gateway to the private cloud. However, we need to configure the network to forward all external requests via this internet gateway. Hence, we have to add a default route to the route table. Go to VPC -> Route Tables -> select the route table -> Edit Routes and specify the destination network, 0.0.0.0/0 and target (the created internet gateway ID) as below:

Edit Route Tables AWS Console

Then, we have to associate the DB subnet to this network so it assigns all instances created inside this network to the default route that we have created earlier, select the route table -> Edit Subnet Association -> assign the the DB subnet, as shown below:

Route Table Subnet AWS Console

The VPC is now ready to be used by ClusterControl for the deployment.

Once created, select the created VPC from the dropdown. For SSH Key, we will ask ClusterControl to auto generate it:

ClusterControl SSH Key Credentials

The generated SSH key will be located inside ClusterControl server under /var/lib/cmon/autogenerated_ssh_keys/s9s/ directory.

Click on "Deployment Summary". In this page, we have to assign a subnet from the VPC to the database cluster. Since this is a new VPC, it has no subnet and we have to create a new one. Click on "Add New Subnet" button and assign 10.10.1.0/24 as the network for our database cluster:

Add Subnet ClusterControl

Finally, select the create subnet in the textbox and click on "Deploy Cluster":

Select Virtual Machine ClusterControl

You can monitor the job progress under Activity -> Jobs -> Create Cluster. ClusterControl will perform the necessary pre-installation steps like creating the cloud instances, security group, generating SSH key and so on, before the actual installation steps begin.

Once cluster is ready, you should see the following cluster in ClusterControl dashboard:

ClusterControl Dashboard AWS Deployment

Our cluster deployment is now complete. 

Post AWS Database Deployment

We can start loading our data into the cluster or create a new database for your application usage. To connect, simply instruct your applications or clients to connect to the private or public IP address of one of the database servers. You can get this information by going to Nodes page, as shown in the following screenshot:

Node Data ClusterControl AWS Deployment

If you like to access the database nodes directly, you can use ClusterControl web-SSH module at Node Actions -> SSH Console, which gives you a similar experience like connecting via SSH client.

To scale the cluster up by adding a database node, you can just go Cluster Actions (server stack icon) -> Add Node -> Add a DB node on a new cloud instance and you will be presented with the following dialog:

Adding a Node ClusterControl AWS Deployment

Just simply follow the deployment wizard and configure your new instance accordingly. Once the instance is created, ClusterControl will install, configure and join the node into the cluster automatically.

That's it for now, folks. Happy clustering in the cloud!

Building a MySQL or MariaDB Database Cold Standby on Amazon AWS

$
0
0

High Availability is a must these days as most organizations can’t allow itself to lose its data. High Availability, however, always comes with a price tag (which can vary a lot.) Any setups which require nearly-immediate action would typically require an expensive environment which would mirror precisely the production setup. But, there are other options that can be less expensive. These may not allow for an immediate switch to a disaster recovery cluster, but they will still allow for business continuity (and won’t drain the budget.) 

An example of this type of setup is a “cold-standby” DR environment. It allows you to reduce your expenses while still being able to spin up a new environment in an external location should the disaster strikes. In this blog post we will demonstrate how to create such a setup.

The Initial Setup

Let’s assume we have a fairly standard Master / Slave MySQL Replication setup in our own datacenter. It is highly available setup with ProxySQL and Keepalived for Virtual IP handling. The main risk is that the datacenter will become unavailable. It is a small DC, maybe it’s only one ISP with no BGP in place. And in this situation, we will assume that if it would take hours to bring back the database that it’s ok as long as it’s possible to bring it back.

ClusterControl Cluster Topology

To deploy this cluster we used ClusterControl, which you can download for free. For our DR environment we will use EC2 (but it could also be any other cloud provider.)

The Challenge

The main issue we have to deal with is how should we ensure we do have a fresh data to restore our database in the disaster recovery environment? Of course, ideally we would have a replication slave up and running in EC2... but then we have to pay for it. If we are tight on the budget, we could try to get around that with backups. This is not the perfect solution as, in the worst case scenario, we will never be able to recover all the data. 

By “the worst case scenario” we mean a situation in which we won’t have access to the original database servers. If we will be able to reach them, data would not have been lost.

The Solution

We are going to use ClusterControl to setup a backup schedule to reduce the chance that the data would be lost. We will also use the ClusterControl feature to upload backups to the cloud. If the datacenter will not be available, we can hope that the cloud provider we have chosen will be reachable.

Setting up the Backup Schedule in ClusterControl

First, we will have to configure ClusterControl with our cloud credentials.

ClusterControl Cloud Credentials

We can do this by using “Integrations” from the left side menu.

ClusterControl Add Cloud Credentials

You can pick Amazon Web Services, Google Cloud or Microsoft Azure as the cloud you want ClusterControl to upload backups to. We will go ahead with AWS where ClusterControl will use S3 to store backups.

Add Cloud Credentials in ClusterControl

We then need to pass key ID and key secret, pick the default region and pick a name for this set of credentials.

AWS Cloud Integration Successful - ClusterControl

Once this is done, we can see the credentials we just added listed in ClusterControl.

Now, we shall proceed with setting up backup schedule.

Backup Scheduling ClusterControl

ClusterControl allows you to either create backup immediately or schedule it. We’ll go with the second option. What we want is to create a following schedule:

  1. Full backup created once per day
  2. Incremental backups created every 10 minutes.

The idea here is like follows. Worst case scenario we will lose only 10 minutes of the traffic. If the datacenter will become unavailable from outside but it would work internally, we could try to avoid any data loss by waiting 10 minutes, copying the latest incremental backup on some laptop and then we can manually send it towards our DR database using even phone tethering and a cellular connection to go around ISP failure. If we won’t be able to get the data out of the old datacenter for some time, this is intended to minimize the amount of transactions we will have to manually merge into DR database.

Create Backup Schedule in ClusterControl

We start with full backup which will happen daily at 2:00 am. We will use the master to take the backup from, we will store it on controller under /root/backups/ directory. We will also enable “Upload Backup to the cloud” option.

Backup Settings in ClusterControl

Next, we want to make some changes in the default configuration. We decided to go with automatically selected failover host (in case our master would be unavailable, ClusterControl will use any other node which is available). We also wanted to enable encryption as we will be sending our backups over the network.

Cloud Settings for Backup Scheduling in ClusterControl

Then we have to pick the credentials, select existing S3 bucket or create a new one if needed.

Create Backup in ClusterControl

We are basically repeating the process for the incremental backup, this time we used the “Advanced” dialog to run the backups every 10 minutes.

The rest of the settings is similar, we also can reuse the S3 bucket.

ClusterControl Cluster Details

The backup schedule looks as above. We don’t have to start full backup manually, ClusterControl will run incremental backup as scheduled and if it detects there’s no full backup available, it will run a full backup instead of the incremental.

With such setup we can be safe to say that we can recover the data on any external system with 10 minute granularity.

Manual Backup Restore

If it happens that you will need to restore the backup on the disaster recovery instance, there are a couple of steps you have to take. We strongly recommend to test this process from time to time, ensuring it works correctly and you are proficient in executing it.

First, we have to install AWS command line tool on our target server:

root@vagrant:~# apt install python3-pip

root@vagrant:~# pip3 install awscli --upgrade --user

Then we have to configure it with proper credentials:

root@vagrant:~# ~/.local/bin/aws configure

AWS Access Key ID [None]: yourkeyID

AWS Secret Access Key [None]: yourkeySecret

Default region name [None]: us-west-1

Default output format [None]: json

We can now test if we have the access to the data in our S3 bucket:

root@vagrant:~# ~/.local/bin/aws s3 ls s3://drbackup/

                           PRE BACKUP-1/

                           PRE BACKUP-2/

                           PRE BACKUP-3/

                           PRE BACKUP-4/

                           PRE BACKUP-5/

                           PRE BACKUP-6/

                           PRE BACKUP-7/

Now, we have to download the data. We will create directory for the backups - remember, we have to download whole backup set - starting from a full backup to the last incremental we want to apply.

root@vagrant:~# mkdir backups

root@vagrant:~# cd backups/

Now there are two options. We can either download backups one by one:

root@vagrant:~# ~/.local/bin/aws s3 cp s3://drbackup/BACKUP-1/ BACKUP-1 --recursive

download: s3://drbackup/BACKUP-1/cmon_backup.metadata to BACKUP-1/cmon_backup.metadata

Completed 30.4 MiB/36.2 MiB (4.9 MiB/s) with 1 file(s) remaining

download: s3://drbackup/BACKUP-1/backup-full-2019-08-20_113009.xbstream.gz.aes256 to BACKUP-1/backup-full-2019-08-20_113009.xbstream.gz.aes256


root@vagrant:~# ~/.local/bin/aws s3 cp s3://drbackup/BACKUP-2/ BACKUP-2 --recursive

download: s3://drbackup/BACKUP-2/cmon_backup.metadata to BACKUP-2/cmon_backup.metadata

download: s3://drbackup/BACKUP-2/backup-incr-2019-08-20_114009.xbstream.gz.aes256 to BACKUP-2/backup-incr-2019-08-20_114009.xbstream.gz.aes256

We can also, especially if you have tight rotation schedule, sync all contents of the bucket with what we have locally on the server:

root@vagrant:~/backups# ~/.local/bin/aws s3 sync s3://drbackup/ .

download: s3://drbackup/BACKUP-2/cmon_backup.metadata to BACKUP-2/cmon_backup.metadata

download: s3://drbackup/BACKUP-4/cmon_backup.metadata to BACKUP-4/cmon_backup.metadata

download: s3://drbackup/BACKUP-3/cmon_backup.metadata to BACKUP-3/cmon_backup.metadata

download: s3://drbackup/BACKUP-6/cmon_backup.metadata to BACKUP-6/cmon_backup.metadata

download: s3://drbackup/BACKUP-5/cmon_backup.metadata to BACKUP-5/cmon_backup.metadata

download: s3://drbackup/BACKUP-7/cmon_backup.metadata to BACKUP-7/cmon_backup.metadata

download: s3://drbackup/BACKUP-3/backup-incr-2019-08-20_115005.xbstream.gz.aes256 to BACKUP-3/backup-incr-2019-08-20_115005.xbstream.gz.aes256

download: s3://drbackup/BACKUP-1/cmon_backup.metadata to BACKUP-1/cmon_backup.metadata

download: s3://drbackup/BACKUP-2/backup-incr-2019-08-20_114009.xbstream.gz.aes256 to BACKUP-2/backup-incr-2019-08-20_114009.xbstream.gz.aes256

download: s3://drbackup/BACKUP-7/backup-incr-2019-08-20_123008.xbstream.gz.aes256 to BACKUP-7/backup-incr-2019-08-20_123008.xbstream.gz.aes256

download: s3://drbackup/BACKUP-6/backup-incr-2019-08-20_122008.xbstream.gz.aes256 to BACKUP-6/backup-incr-2019-08-20_122008.xbstream.gz.aes256

download: s3://drbackup/BACKUP-5/backup-incr-2019-08-20_121007.xbstream.gz.aes256 to BACKUP-5/backup-incr-2019-08-20_121007.xbstream.gz.aes256

download: s3://drbackup/BACKUP-4/backup-incr-2019-08-20_120007.xbstream.gz.aes256 to BACKUP-4/backup-incr-2019-08-20_120007.xbstream.gz.aes256

download: s3://drbackup/BACKUP-1/backup-full-2019-08-20_113009.xbstream.gz.aes256 to BACKUP-1/backup-full-2019-08-20_113009.xbstream.gz.aes256

As you remember, the backups are encrypted. We have to have encryption key which is stored in ClusterControl. Make sure you have its copy stored somewhere safe, outside of the main datacenter. If you cannot reach it, you won’t be able to decrypt backups. The key can be found in ClusterControl configuration:

root@vagrant:~# grep backup_encryption_key /etc/cmon.d/cmon_1.cnf

backup_encryption_key='aoxhIelVZr1dKv5zMbVPLxlLucuYpcVmSynaeIEeBnM='

It is encoded using base64 thus we have to decode it first and store it in the file before we can start decrypting the backup:

echo "aoxhIelVZr1dKv5zMbVPLxlLucuYpcVmSynaeIEeBnM=" | openssl enc -base64 -d > pass

Now we can reuse this file to decrypt backups. For now, let’s say we will do one full and two incremental backups. 

mkdir 1

mkdir 2

mkdir 3

cat BACKUP-1/backup-full-2019-08-20_113009.xbstream.gz.aes256 | openssl enc -d -aes-256-cbc -pass file:/root/backups/pass | zcat | xbstream -x -C /root/backups/1/

cat BACKUP-2/backup-incr-2019-08-20_114009.xbstream.gz.aes256 | openssl enc -d -aes-256-cbc -pass file:/root/backups/pass | zcat | xbstream -x -C /root/backups/2/

cat BACKUP-3/backup-incr-2019-08-20_115005.xbstream.gz.aes256 | openssl enc -d -aes-256-cbc -pass file:/root/backups/pass | zcat | xbstream -x -C /root/backups/3/

We have the data decrypted, now we have to proceed with setting up our MySQL server. Ideally, this should be exactly the same version as on the production systems. We will use Percona Server for MySQL:

cd ~
wget https://repo.percona.com/apt/percona-release_latest.generic_all.deb

sudo dpkg -i percona-release_latest.generic_all.deb

apt-get update

apt-get install percona-server-5.7

Nothing complex, just regular installation. Once it’s up and ready we have to stop it and remove the contents of its data directory.

service mysql stop

rm -rf /var/lib/mysql/*

To restore the backup we will need Xtrabackup - a tool CC uses to create it (at least for Perona and Oracle MySQL, MariaDB uses MariaBackup). It is important that this tool is installed in the same version as on the production servers:

apt install percona-xtrabackup-24

That’s all we have to prepare. Now we can start restoring the backup. With incremental backups it is important to keep in mind that you have to prepare and apply them on top of the base backup. Base backup also has to be prepared. It is crucial to run the prepare with ‘--apply-log-only’ option to prevent xtrabackup from running the rollback phase. Otherwise you won’t be able to apply next incremental backup.

xtrabackup --prepare --apply-log-only --target-dir=/root/backups/1/

xtrabackup --prepare --apply-log-only --target-dir=/root/backups/1/ --incremental-dir=/root/backups/2/

xtrabackup --prepare --target-dir=/root/backups/1/ --incremental-dir=/root/backups/3/

In the last command we allowed xtrabackup to run the rollback of not completed transactions - we won’t be applying any more incremental backups afterwards. Now it is time to populate the data directory with the backup, start the MySQL and see if everything works as expected:

root@vagrant:~/backups# mv /root/backups/1/* /var/lib/mysql/

root@vagrant:~/backups# chown -R mysql.mysql /var/lib/mysql

root@vagrant:~/backups# service mysql start

root@vagrant:~/backups# mysql -ppass

mysql: [Warning] Using a password on the command line interface can be insecure.

Welcome to the MySQL monitor.  Commands end with ; or \g.

Your MySQL connection id is 6

Server version: 5.7.26-29 Percona Server (GPL), Release '29', Revision '11ad961'


Copyright (c) 2009-2019 Percona LLC and/or its affiliates

Copyright (c) 2000, 2019, Oracle and/or its affiliates. All rights reserved.


Oracle is a registered trademark of Oracle Corporation and/or its

affiliates. Other names may be trademarks of their respective

owners.


Type 'help;' or '\h' for help. Type '\c' to clear the current input statement.


mysql> show schemas;

+--------------------+

| Database           |

+--------------------+

| information_schema |

| mysql              |

| performance_schema |

| proxydemo          |

| sbtest             |

| sys                |

+--------------------+

6 rows in set (0.00 sec)


mysql> select count(*) from sbtest.sbtest1;

+----------+

| count(*) |

+----------+

|    10506 |

+----------+

1 row in set (0.01 sec)

As you can see, all is good. MySQL started correctly and we were able to access it (and the data is there!) We successfully managed to bring our database back up-and-running in a separate location. The total time required depends strictly on the size of the data - we had to download data from S3, decrypt and decompress it and finally prepare the backup. Still, this is a very cheap option (you have to pay for S3 data only) which gives you an option for business continuity should a disaster strikes.


Comparing Galera Cluster Cloud Offerings: Part One Amazon AWS

$
0
0

Running a MySQL Galera Cluster (either the Percona, MariaDB, or Codership build) is, unfortunately, not a  supported (nor part of) the databases supported by Amazon RDS. Most of the databases supported by RDS use asynchronous replication, while Galera Cluster is a synchronous multi-master replication solution. Galera also requires InnoDB as its storage engine to function properly, and while you can use other storage engines such as MyISAM it is not advised that you use this storage engine because of the lack of transaction handling. 

Because of the lack of support natively in RDS, this blog will focus on the offerings available when choosing and hosting your Galera-based cluster using an AWS environment.

There are certainly many reasons why you would choose or not choose the AWS cloud platform, but for this particular topic we’re going to go over the advantages and benefits of what you can leverage rather than why you would choose the AWS Platform.

The Virtual Servers (Elastic Compute Instances)

As mentioned earlier, MySQL Galera is not part of RDS and InnoDB is a transactional storage engine for which you need the right resources for your application requirement. It must have the capacity to serve the demand of your client request traffic. At the time of this article, your sole choice for running Galera Cluster is by using EC2, Amazon's compute instance cloud offering. 

Because you have the advantage of running your system on a number of nodes on EC2 instances, running a Galera Cluster on EC2 verses on-prem doesn’t differ much. You can access the server remotely via SSH, install your desired software packages, and choose the kind of Galera Cluster build you like to utilize. 

Moreover, with EC2 this offering is more elastic and flexible, allowing you to deliver and offer a simpler,  granular setup. You can take advantage of the web services to automate or build a number of nodes if you need to scaleout your environment, or for example, automate the building of your staging or development environment. It also gives you an edge to quickly build your desired environment, choose and setup your desired OS, and pickup the right computing resources that fits your requirements (such as CPU, memory, and disk storage.) EC2 eliminates the time to wait for hardware, since you can do this on the fly. You can also leverage their AWS CLI tool to automate your Galera cluster setup.

Pricing for Amazon EC2 Instances

EC2 offers a number of selections which are very flexible for consumers who would like to host their Galera Cluster environment on AWS compute nodes. The AWS Free Tier includes 750 hours of Linux and Windows t2.micro instances, each month, for one year. You can stay within the Free Tier by using only EC2 Micro instances, but this might not be the best thing for production use. 

There are multiple types of EC2 instances for which you can deploy when provisioning your Galera nodes. Ideally, these r4/r5/x1 family (memory optimized) and c4/c5 family (compute optimized) are an ideal choice, and these prices differ depending on how large your server resource needs are and type of OS.

These are the types of paid instances you can choose...

On Demand 

Pay by compute capacity (per-hour or per-second), depends on the type of instances you run. For example, prices might differ when provisioning an Ubuntu instances vs RHEL instance aside from the type of instance. It has no long-term commitments or upfront payments needed. It also has the flexibility to increase or decrease your compute capacity. These instances are recommended for low cost and flexible environment needs like applications with short-term, spiky, or unpredictable workloads that cannot be interrupted, or applications being developed or tested on Amazon EC2 for the first time. Check it out here for more info.

Dedicated Hosts

If you are looking for compliance and regulatory requirements such as the need to acquire a dedicated server that runs on a dedicated hardware for use, this type of offer suits your needs. Dedicated Hosts can help you address compliance requirements and reduce costs by allowing you to use your existing server-bound software license, including Windows Server, SQL Server, SUSE Linux Enterprise Server, Red Hat Enterprise Linux, or other software licenses that are bound to VMs, sockets, or physical cores, subject to your license terms. It can be purchased On-Demand (hourly) or as a Reservation for up to 70% off the On-Demand price. Check it out here for more info.

Spot Instances

These instances allow you to request spare Amazon EC2 computing capacity for up to 90% off the On-Demand price. This is recommended for applications that have flexible start and end times, applications that are only feasible at very low compute prices, or users with urgent computing needs for large amounts of additional capacity. Check it out here for more info.

Reserved Instances

This type of payment offer provides you the option to grab up to a 75% discount and, depending on which instance you would like to reserve, you can acquire a capacity reservation giving you additional confidence in your ability to launch instances when you need them. This is recommended if your applications have steady state or predictable usage, applications that may require reserved capacity, or customers that can commit to using EC2 over a 1 or 3 year term to reduce their total computing costs. Check it out here for more info.

Pricing Note

One last thing with EC2, they also offer a per-second billing which also takes cost of unused minutes and seconds in an hour off of the bill. This is advantageous if you are scaling-out for a minimal amount of time, just to handle traffic request from a Galera node or in case you want to try and test on a specific node for just a limited time use.

Database Encryption on AWS

If you're concerned about the confidentiality of your data, or abiding the laws required for your security compliance and regulations, AWS offers data-at-rest encryption. If you're using MariaDB Cluster version 10.2+, they have built-in plugin support to interface with the Amazon Web Services (AWS) Key Management Service (KMS) API. This allows you to take advantage of AWS-KMS key management service to facilitate separation of responsibilities and remote logging & auditing of key access requests. Rather than storing the encryption key in a local file, this plugin keeps the master key in AWS KMS. 

When you first start MariaDB, the AWS KMS plugin will connect to the AWS Key Management Service and ask it to generate a new key. MariaDB will store that key on-disk in an encrypted form. The key stored on-disk cannot be used to decrypt the data; rather, on each startup, MariaDB connects to AWS KMS and has the service decrypt the locally-stored key(s). The decrypted key is stored in-memory as long as the MariaDB server process is running, and that in-memory decrypted key is used to encrypt the local data.

Alternatively, when deploying your EC2 instances, you can encrypt your data storage volume with EBS (Elastic Block Storage) or encrypt the instance itself. Encryption for EBS type volumes are all supported, though it might have an impact but the latency is very minimal or even not visible to the end users. For EC2 instance-type encryption, most of the large instances are supported. So if you're using compute or memory optimized nodes, you can leverage its encryption. 

Below are the list of supported instances types...

  • General purpose: A1, M3, M4, M5, M5a, M5ad, M5d, T2, T3, and T3a
  • Compute optimized: C3, C4, C5, C5d, and C5n
  • Memory optimized: cr1.8xlarge, R3, R4, R5, R5a, R5ad, R5d, u-6tb1.metal, u-9tb1.metal, u-12tb1.metal, X1, X1e, and z1d
  • Storage optimized: D2, h1.2xlarge, h1.4xlarge, I2, and I3
  • Accelerated computing: F1, G2, G3, P2, and P3

You can setup your AWS account to always enable encryption upon deployment of your EC2-type instances. This means that AWS will encrypt new EBS volumes on launch and encrypts new copies of unencrypted snapshots.

Multi-AZ/Multi-Region/Multi-Cloud Deployments

Unfortunately, as of this writing, there's no such direct support in the AWS Console (nor any of their AWS API) that supports Multi-AZ/-Region/-Cloud deployments for Galera node clusters. 

High Availability, Scalability, and Redundancy

To achieve a multi-AZ deployment, it's recommendable that you provision your galera nodes in different availability zones. This prevents the cluster from going down or a cluster malfunction due to lack of quorum. 

You can also setup an AWS Auto Scaling and create an auto scaling group to monitor and do status checks so your cluster will always have redundancy, scalable, and highly availability. Auto Scaling should solve your problem in the case that your node goes down for some unknown reason.

For multi-region or multi-cloud deployment, Galera has its own parameter called gmcast.segment for which you can set this upon server start. This parameter is designed to optimize the communication between the Galera nodes and minimize the amount of traffic sent between network segments including writeset relaying and IST and SST donor selection. 

This type of setup allows you to deploy multiple nodes in different regions for your Galera Cluster. Aside from that, you can also deploy your Galera nodes on a different vendor, for example, if it's hosted in Google Cloud and you want redundancy on Microsoft Azure. 

I would recommend you to check out our blog Multiple Data Center Setups Using Galera Cluster for MySQL or MariaDB and Zero Downtime Network Migration With MySQL Galera Cluster Using Relay Node to gather more information on how to implement these types of deployments.

Database Performance on AWS

Depending on your application demand, if your queries memory consuming the memory optimized instances are your ideal choice. If your application has higher transactions that require high-performance for web servers or batch processing, then choose compute optimized instances. If you want to learn more about optimizing your Galera Cluster, you can check out this blog How to Improve Performance of Galera Cluster for MySQL or MariaDB.

Database Backups on AWS

Creating backups can be difficult since there's no direct support within AWS that is specific for MySQL Galera technology. However, AWS provides you a disaster and recovery solution using EBS Snapshots. You can take snapshots of the EBS volumes attached to your instance, then either take a backup by schedule using CloudWatch or by using the Amazon Data Lifecycle Manager (Amazon DLM) to automate the snapshots. 

Take note that the snapshots taken are incremental backups, which means that only the blocks on the device that have changed after your most recent snapshot are saved. You can store these snapshots to AWS S3 to save storage costs. Alternatively,  you can use external tools like Percona Xtrabackup, and Mydumper (for logical backups) and store these to AWS EFS -> AWS S3 -> AWS Glacier

You can also setup Lifecycle Management in AWS if you need your backup data to be stored in a more cost efficient manner. If you have large files and are going to utilize the AWS EFS, you can leverage their AWS Backup solution as this is also a simple yet cost-effective solution.

On the other hand, you can also use external services (as well such as ClusterControl) which provides you both monitoring and backup solutions. Check this out if you want to know more.

Database Monitoring on AWS

AWS offers health checks and some status checks to provide you visibility into your Galera nodes. This is done through CloudWatch and CloudTrail

CloudTrail lets you enable and inspect the logs and perform audits based on what actions and traces have been made. 

CloudWatch lets you collect and track metrics, collect and monitor log files, and set custom alarms. You can set it up according to your custom needs and gain system-wide visibility into resource utilization, application performance, and operational health. CloudWatch comes with a free tier as long as you still fall within its limits (See the screenshot below.)

CloudWatch also comes with a price depending on the volume of metrics being distributed. Checkout its current pricing by checking here

Take note: there's a downside to using CloudWatch. It is not designed to cater to the database health, especially for monitoring MySQL Galera cluster nodes. Alternatively, you can use external tools that offer high-resolution graphs or charts that are useful in reporting and are easier to analyze when diagnosing a problematic node. 

For this you can use PMM by Percona, DataDog, Idera, VividCortex, or our very own ClusterControl (as monitoring is FREE with ClusterControl Community.) I would recommend that you use a monitoring tool that suits your needs based on your individual application requirements. It's very important that your monitoring tool be able to notify you aggressively or provide you integration for instant messaging systems such as Slack, PagerDuty or even send you SMS when escalating severe health status.

Database Security on AWS

Securing your EC2 instances is one of the most vital parts of deploying your database into the public cloud. You can setup a private subnet and setup the required security groups only favored to allow the port  or source IP depending on your setup. You can set your database nodes with a non-remote access and just set up a jump host or an Internet Gateway, if nodes requires to access the internet to access or update software packages. You can read our previous blog Deploying Secure Multicloud MySQL Replication on AWS and GCP with VPN on how we set this up. 

In addition to this, you can secure your data in-transit by using TLS/SSL connection or encrypt your data when it's at rest. If you're using ClusterControl, deploying a secure data in-transit is simple and easy. You can check out our blog SSL Key Management and Encryption of MySQL Data in Transit if you want to try out. For data at-rest, storing your data via S3 can be encrypted using AWS Server-Side Encryption or use AWS-KMS which I have discussed earlier. Check this external blog on how to setup and leverage a MariaDB Cluster using AWS-KMS so you can store your data securely at-rest.

Galera Cluster Troubleshooting on AWS

AWS CloudWatch can help especially when investigating and checking out the system metrics. You can check the network, CPU, memory, disk, and it's instance or compute usage and balance. This might not, however, meet your requirements when digging into a specific case. 

CloudTrail can perform solid traces of actions that has been governed based on your specific AWS account. This will help you determine if the occurrences aren't coming from MySQL Galera, but might be some bug or issues within the AWS environment (such as Hyper-V is having issues within the host machine where your instance, as the guest, is being hosted.)

If you're using ClusterControl, going to Logs -> System Logs, you'll be able to browse the captured error logs taken from the MySQL Galera node itself. Apart from this, ClusterControl provides real-time monitoring that would amplify your alarm and notification system in case an emergency or if your MySQL Galera node(s) is kaput.

Conclusion

AWS does not have pure support for a MySQL Galera Cluster setup, unlike AWS RDS which has MySQL compatibility. Because of this most of the recommendations or opinions running a Galera Cluster for production use within the AWS environment are based on experienced and well-tested environments that have been running for a very long time. 

MariaDB Cluster comes with a great productivity, as they constantly provide concise support for the AWS technology stack solution. In the upcoming release of MariaDB 10.5 version, they will offer a support for S3 Storage Engine, which may be worth the wait.

External tools can help you manage and control your MySQL Galera Cluster running on the AWS Cloud, so it's not a huge concern if you have some dilemmas and FUD on why you should run or shift to the AWS Cloud Platform.

AWS might not be the one-size-fits-all solution in some cases, but it provides a wide-array of solutions that you can customize and tailor it to fit your needs. 

In the next part of our blog, we'll look at another public cloud platform, particularly Google Cloud and see how we can leverage if we choose to run our Galera Cluster into their platform.

Comparing Galera Cluster Cloud Offerings: Part Two Google Cloud Platform (GCP)

$
0
0

In our last blog we discussed the offerings available within Amazon Web Services (AWS) when running a MySQL Galera Cluster. In this blog, we'll continue the discussion by looking further at what the offerings are for running the same clustering technology, but this time on the Google Cloud Platform (GCP)

GCP, as an alternative to AWS, has been continuously attracting applications suited for DevOps by offering support for a wide array of full-stack technologies, containerized applications, and large production database systems. Google Cloud is a full-blown, battle-tested environment which powers its own hardware infrastructure at Google for products like YouTube and Gmail.

GCP has gained traction largely because of its ever-growing list of capabilities. It offers support for platforms like Visual Studio, Android Studio, Eclipse, Powershell and many others. GCP has one of the largest and most advanced computer networks and it provides access to numerous tools that help you focus on building your application. 

Another thing that attracts customers to migrate, import, or use Google Cloud is their strong support and solutions for containerization. Kubernetes (GKE: Google Kubernetes Engine) is built on their platform. 

GCP has also recently launched a new solution called Anthos. This product is designed to let organizations manage workloads using the same interface on the Google Cloud Platform (GCP) or on-premises using GKE On-Prem, and even on rival clouds such as Amazon Web Services (AWS) or Azure. 

In addition to these technologies, GCP offers sophisticated and powerful, compute-optimized machine types like the C2 family in GCE which is built on the latest generation Intel Scalable Processors (Cascade Lake).

GCP is continuing to support open source as well, which benefits users by providing well-supported and a straightforward framework that makes it easy to deliver a final product in a timely manner. Despite this support of open source technology, GCP does not provide native support for the deployment or configuration of a MySQL Galera Cluster. In this blog we will show you the only option available to you if you wish to use this technology, deployment via a compute instance which you have to manage yourself.

The Google Compute Engine (GCE)

GCE has a sophisticated and powerful set of compute nodes available for your consumption. Unlike AWS, GCE has the most powerful compute node available on the market (n1-ultramem-160 having 160 vCPU and 3.75 TB of memory). GCE also just recently introduced a new type of compute instance family called C2 machine-type. Built on the latest generation of Intel Scalable Processors (Cascade Lake), C2 machine types offer up to 3.8 GHz sustained all-core turbo and provide full transparency into the architecture of the underlying server platforms; letting you fine-tune the performance. C2 machine types offer much more computing power, run on a newer platform, and are generally more robust for compute-intensive workloads than the N1 high-CPU machine types. C2 family offerings are limited (as of the time of writing) and it’s not available in all regions and zones. C2 also does not support regional persistent disks though it would be a great add-on for stateful database services that requires redundancy and high availability. The resources of a C2 instance is too much for a Galera node, so we'll focus on the compute nodes instead, which are ideal.

GCE also uses KVM as its virtualization technology software, whereas Amazon is using Xen. Let's take a look at the compute nodes available in GCE which are suitable for running Galera alongside its equivalence in AWS EC2. Prices differs based on region, but for this chart, we use us-east region using on-demand pricing type for AWS.


Machine/Instance Type

Google Compute Engine

AWS EC2

Shared

f1-micro

G1-small


Prices starts at $0.006 -  $0.019 hourly

t2.nano – t3.2xlarge'


Price starts at $0.0058 - $0.3328 hourly

Standard

n1-standard-1 – n1-standard-96


Prices starts at $0.034  - $3.193 hourly

m4.large – m4.16xlarge

m5.large – m5d.metal


Prices starts at $0.1 - $5.424  hourly

High Memory/ Memory Optimized

n1-highmem-2 – n1-highmem-96

n1-megamem-96

n1-ultramem-40 – n1-ultramem-160


Prices starts at $0.083  - $17.651 hourly

r4.large – r4.16xlarge

x1.16xlarge – x1.32xlarge

x1e.xlarge – x1e.32xlarge


Prices starts at $0.133  - $26.688 hourly

High CPU/Storage Optimized

n1-highcpu-2 – n1-highcpu-32


Prices starts at $0.05 - $2.383 hourly

h1.2xlarge – h1.16xlarge

i3.large – i3.metal

I3en.large - i3en.metal

d2.xlarge – d2.8xlarge


Prices starts at $0.156 - $10.848  hourly

GCE has a fewer number of available predefined types of compute nodes to choose from, unlike AWS. When it comes to the type of node, however, it has more granularity. This makes it easier to setup and choose what kind of instance you want to use. For example, you can add a disk and set its physical block size (4 is default) to 16 or you can set its mode either read/write or read-only. This allows you to offer the right type of machine or compute instance ready to manage your Galera node. You may also instantiate your compute nodes using Cloud SDK, or by using Cloud APIs, to automate or integrate it to your Continuous Integration, Delivery, or Deployment (CI/CD). 

Pricing (Compute Instance, Disk, vCPU, Memory, and Network)

The price as well depends on the region where its located, the type of OS or licensing (RHEL vs Suse Linux Enterprise), and also the type of disk storage you're using. 

GCP also offers discounts which allows you to economize your resource consumption. For Compute Engine, it provides different discounts to avail. 

Sustained use discounts apply to the following resources:

Take note that sustained use discounts do not apply to VMs created using App Engine Flexible Environment and Cloud Dataflow.

You can also use Committed Use Discounts when you purchase a VMS which is bound to a contract. This type of choice is ideal for predictable workloads and resource needs. When you purchase a committed use contract you purchase a certain amount of vCPUs, memory, GPUs, and local SSDs at a discounted price in return for committing to paying for those resources for 1 year or 3 years. The discount is up to 57% for most resources like machine types or GPUs. The discount is up to 70% for memory-optimized machine types. Once purchased, you are billed monthly for the resources you purchased for the duration of the term you selected (whether you use the services or not). 

A preemptible VM is an instance that you can create and run at a much lower price than normal instances. Compute Engine may, however, terminate (preempt) these instances if it requires access to those resources for other tasks. Preemptible instances use excess Compute Engine capacity, so their availability varies with usage.

If your applications are fault-tolerant and can withstand possible instance preemptions, then preemptible instances can reduce your Compute Engine costs significantly. For example, batch processing jobs can run on preemptible instances. If some of those instances terminate during processing, the job slows but does not completely stop. Preemptible instances complete your batch processing tasks without placing additional workload on your existing instances, and without requiring you to pay full price for additional normal instances.

For Compute Engine, disk size, machine type memory, and network usage are calculated in gigabytes (GB), where 1 GB is 230 bytes. This unit of measurement is also known as a gibibyte (GiB). This means that GCP offers you to only pay based on the resource consumption you have allocated. 

Now, if you have a high-grade, production database application, it's recommendable (and ideal) to attach or add a separate persistent disk. You would then use that disk as your database volume, as it offers you reliable and consistent disk performance in GCE. The higher the size you setup, the higher the IOPS it offers you.  Checkout their list of persistent disk pricing to determine the price you would get. In addition to this, GCE has regional persistent disk which is suitable in case you require more solid and sustainable high-availability within your database cluster. Regional persistent disk adds more redundancy in the case that your instance terminates or crashes or becomes corrupted. It provides synchronous replication of data between two zones in one region which happens transparently in the VM instance. In the unlikely event of  zone failure, your workload can fail-over to another VM instance in the same, or a secondary, zone. You can then force-attach your regional persistent disk to that instance. Force-attach time is estimated in less than one minute.

If you store backups as part of your disaster recovery solution, and requires a volume that is cluster-wide, GCP offers Cloud Filestore, NetApp Cloud Volumes, and some other alternative file-sharing solutions. These are fully-managed services that offers standard and premium services. You can checkout NetApp's pricing page here and Filestore pricing here.

Galera Encryption on GCP

GCP does not include specific support for the type of encryption available for Galera. GCP, however, encrypts customer data stored at rest by default, with no additional action required from you. GCP also offers another option to encrypt your data using Customer-managed encryption keys (CMEK) with Cloud KMS as well as with Customer-supplied encryption keys (CSEK). GCP also uses SSL/TLS encryption for all communications intercepted as data moves between your site and the cloud provider or between two services. This protection is achieved by encrypting the data before transmission; authenticating the endpoints; and decrypting and verifying the data on arrival.

Because Galera uses MySQL under the hood (Percona, MariaDB, or Codership build), you can take advantage of the File Key Management Encryption Plugin by MariaDB or by using the MySQL Keyring plugins. Here's an external blog by Percona which is a good resource on how you can implement this.

Galera Cluster Multi-AZ/Multi-Region/Multi-Cloud Deployments with GCP

Similarly to AWS, GCP does not offer direct support to deploy a Galera cluster on a Multi-AZ/-Region/-Cloud.

Galera Cluster High Availability, Scalability, and Redundancy on GCP

One of the primary reasons to use a Galera node cluster is the high-availability, redundancy, and it's ability to scale. If you are serving traffic globally, it's best that you cater your traffic based by regions with your architectural design including a geo-distribution of your database nodes. In order to achieve this, multi-AZ and multi-region or multi-cloud/multi-datacenter deployment is recommendable and achievable. This prevents the cluster from going down or a cluster malfunction due to lack of quorum. 

To help you more with your scalability design, GCP also has an autoscaler you can set up with an autoscaling group. This will work as long as you created your cluster as managed instance groups. For example, you can monitor the CPU utilization or relying on the metrics from Stackdriver defined in your autoscaling policy. This allows you to provision and automate instances when a certain threshold is reached, or terminate the instances when it goes back to its normal state.

For multi-region or multi-cloud deployment, Galera has its own parameter called gmcast.segment for which you can set this upon server start. This parameter is designed to optimize the communication between the Galera nodes and minimize the amount of traffic sent between network segments. This includes writeset relaying and IST and SST donor selection. This type of setup allows you to deploy multiple nodes in different regions. Aside from that, you can also deploy your Galera nodes on a different cloud vendor routing from GCP, AWS, Microsoft Azure, or within on-premise. 

We recommend you to check out our blog Multiple Data Center Setups Using Galera Cluster for MySQL or MariaDB and Zero Downtime Network Migration With MySQL Galera Cluster Using Relay Node to gather more information on how to implement these types of deployments.

Galera Cluster Database Performance on GCP

Since there's no available support for Galera in GCP your choices depend on the requirements and design of your application’s traffic and resource demands. For queries that are high on memory consumption, you can start with n1-highmem-2 instance. High CPU instances (n1-highcpu* family) can be a good fit if this is a high-transactional database, or a good fit for gaming applications.

Choosing the right storage and required IOPS for your database volume is a must. Generally, SSD-based persistent disk is your choice here. It depends on the volume of traffic is required, you might have to checkout the GCP storage options so you can determine the right size for your application.

We also recommend you to check and read our blog How to Improve Performance of Galera Cluster for MySQL or MariaDB to learn more about optimizing your Galera Cluster.

Galera Data Backups on GCP

Not only does your MySQL Galera data has to be backed-up, you should also backup the entire tier which comprises your database application. This includes log files (logical or binary), external files, temporary files, dump files, etc. Google recommends that you always create a snapshot of your persistent disks volumes which are being used by your GCE instances. You can easily create and schedule snapshots. GCP Snapshots are stored in Cloud Storage and you can select your desired location or region where the backup will be located. You can also setup a schedule for your snapshots as well as set a snapshot retention policy.

You can also use external services like, ClusterControl, which provides you both monitoring and backup solutions. Check this out if you want to know more.

Galera Cluster Database Monitoring on GCP

GCP does not offer database monitoring when using GCE. Monitoring your of instance health can be done through Stackdriver. For the database, though, you will need to grab an external monitoring tool which has advanced, highly-granular database metrics. There are a lot of choices you can choose from such as PMM by Percona, DataDog, Idera, VividCortex, or our very own ClusterControl (Monitoring is FREE with ClusterControl Community.)

Galera Cluster Database Security on GCP

As discussed in our previous blog, you can take the same approach for securing your database in the public cloud. In GCP you can setup a private subnet, firewall rules to only allow the ports required for running Galera (particularly ports 3306, 4444, 4567, 4568). You can use NAT Gateway or setup a bastion host to access your private database nodes. When these nodes are encapsulated they cannot be accessed from the outside of the GCP premises. You can read our previous blog Deploying Secure Multicloud MySQL Replication on AWS and GCP with VPN on how we set this up.

In addition to this, you can secure your data-in-transit by using a TLS/SSL connection or by encrypting your data when it's at rest. If you're using ClusterControl, deploying a secure data in-transit is simple and easy. You can check out our blog SSL Key Management and Encryption of MySQL Data in Transit if you want to try out. For data at-rest, you can follow the discussion I have stated earlier in the Encryption section of this blog.

Galera Cluster Troubleshooting 

GCP offers Stackdriver Logging which you can leverage to help you with observability, monitoring, and notification requirements. The great thing about Stackdriver Logging is that it offers integration with AWS. With it you can catch the events selectively and then raise an alert based on that event. This can keep you in the loop on certain issues which may arise and help you during troubleshooting. GCP also has Cloud Audit Logs which provide you more traceable information from inside the GCP environment, from admin activity, data access, and system events. 

If you're using ClusterControl, going to Logs -> System Logs, and you'll be able to browse the captured error logs taken from the MySQL Galera node itself. Apart from this, ClusterControl provides real-time monitoring that would amplify your alarm and notification system in case an emergency or if your MySQL Galera node(s) is kaput.

Conclusion

The Google Cloud Platform offers a wide-variety of efficient and powerful services that you can leverage. There are indeed pros and cons for each of public cloud platforms, but GCP proves that AWS doesn’t have a lock on the cloud. 

It's interesting that big companies such as Vimeo are moving to GCP coming from on-premise and they experienced some interesting results in their technology stack. Bloomberg as well is happy with GCP and is using Percona XtraDB Cluster (a Galera variant). Let us know what you think about using GCP for MySQL Galera setups in the comments below.

Viewing all 210 articles
Browse latest View live