Quantcast
Channel: Severalnines - Galera Cluster
Viewing all 210 articles
Browse latest View live

Comparing Galera Cluster Cloud Offerings: Part Three Microsoft Azure

$
0
0

Microsoft Azure is known to many as an alternative public cloud platform to Amazon AWS. It's not easy to directly compare these two giant companies. Microsoft's cloud business -- dubbed commercial cloud -- includes everything from Azure to Office 365 enterprise subscriptions to Dynamics 365 to LinkedIn services. After LinkedIn was acquired by Microsoft it began moving its infrastructure to Azure. While moving LinkedIn to Azure could take some time, it demonstrates Microsoft Azure’s capabilities and ability to handle millions of transactions. Microsoft's strong enterprise heritage, software stack, and data center tools offer both familiarity and a hybrid approach to cloud deployments.

Microsoft Azure is built as an Infrastructure as a Service (IaaS) as well as a Platform as a Service (PaaS). The Azure Virtual machine offers per-second billing and it's currently a multi-tenant compute. It has, however, recently previewed its new offering which allows virtual machines to run on single-tenant physical servers. The offering is called Azure Dedicated Hosts

Azure also offers specialized large instances (such as for SAP HANA). There are multitenant blocks, file storage, and many  other additional IaaS and PaaS capabilities. These include object storage (Azure Blob Storage), a CDN, a Docker-based container service (Azure Container Service), a batch computing service (Azure Batch), and event-driven “serverless computing” (Azure Functions). The Azure Marketplace offers third-party software and services. Colocation needs are met via partner exchanges (Azure ExpressRoute) offered from partners like Equinix and CoreSite.

With all of these offerings Microsoft Azure has stepped up its game to play a vital role in the public cloud market. The PaaS infrastructure offered to its consumers has garnered a lot of trust and many are moving their own infrastructure or private cloud to Microsoft Azure's public cloud infrastructure. This is especially advantageous for consumers who need integration with other Windows Services, such as Visual Studio.

So what’s different between Azure and the other clouds we have looked at in this series? Microsoft has focused heavily on AI, analytics, and the Internet of Things. AzureStack is another “cloud-meets-data center” effort that has been a real differentiator in the market.

Microsoft Azure Migration Pros & Cons

There are several things you should consider when moving your legacy applications or infrastructure to Microsoft Azure.

Strengths

  • Enterprises that are strategically committed to Microsoft technology generally choose Azure as their primary IaaS+PaaS provider. The integrated end-to-end experience for enterprises building .NET applications using Visual Studio (and related services) is unsurpassed. Microsoft is also leveraging its tremendous sales reach and ability to co-sell Azure with other Microsoft products and services in order to drive adoption.
  • Azure provides a well-integrated approach to edge computing and Internet of Things (IoT), with offerings that reach from its hyperscale data center out through edge solutions such as AzureStack and Data Box Edge.
  • Microsoft Azure’s capabilities have become increasingly innovative and open. 50% of the workloads are Linux-based alongside numerous open-source application stacks. Microsoft has a unique vision for the future that involves bringing in technology partners through native, first-party offerings such as those from VMware, NetApp, Red Hat, Cray and Databricks.

Cautions

  • Microsoft Azure’s reliability issues continue to be a challenge for customers, largely as a result of Azure’s growing pains. Since September 2018, Azure has had multiple service-impacting incidents, including significant outages involving Azure Active Directory. These outages leave customers with no ability to mitigate the downtime.
  • Gartner clients often experience challenges with executing on-time implementations within budget. This comes from Microsoft often providing unreasonably high expectations for customers. Much of this stems from the Microsoft’s field sales teams being “encouraged” to appropriately position and sell Azure within its customer base.
  • Enterprises frequently lament the quality of Microsoft technical support (along with the increasing cost of support) and field solution architects. This negatively impacts customer satisfaction, and slows Azure adoption and therefore customer spending.

Microsoft may not be your first choice as it has been seen as a “not-so-open-source-friendly” tech giant, but in fairness it has embraced a lot of activity and support within the Open Source world. Microsoft Azure offers fully-managed services to most of the top open source RDBMS database like PostgreSQL, MySQL, and MariaDB.  

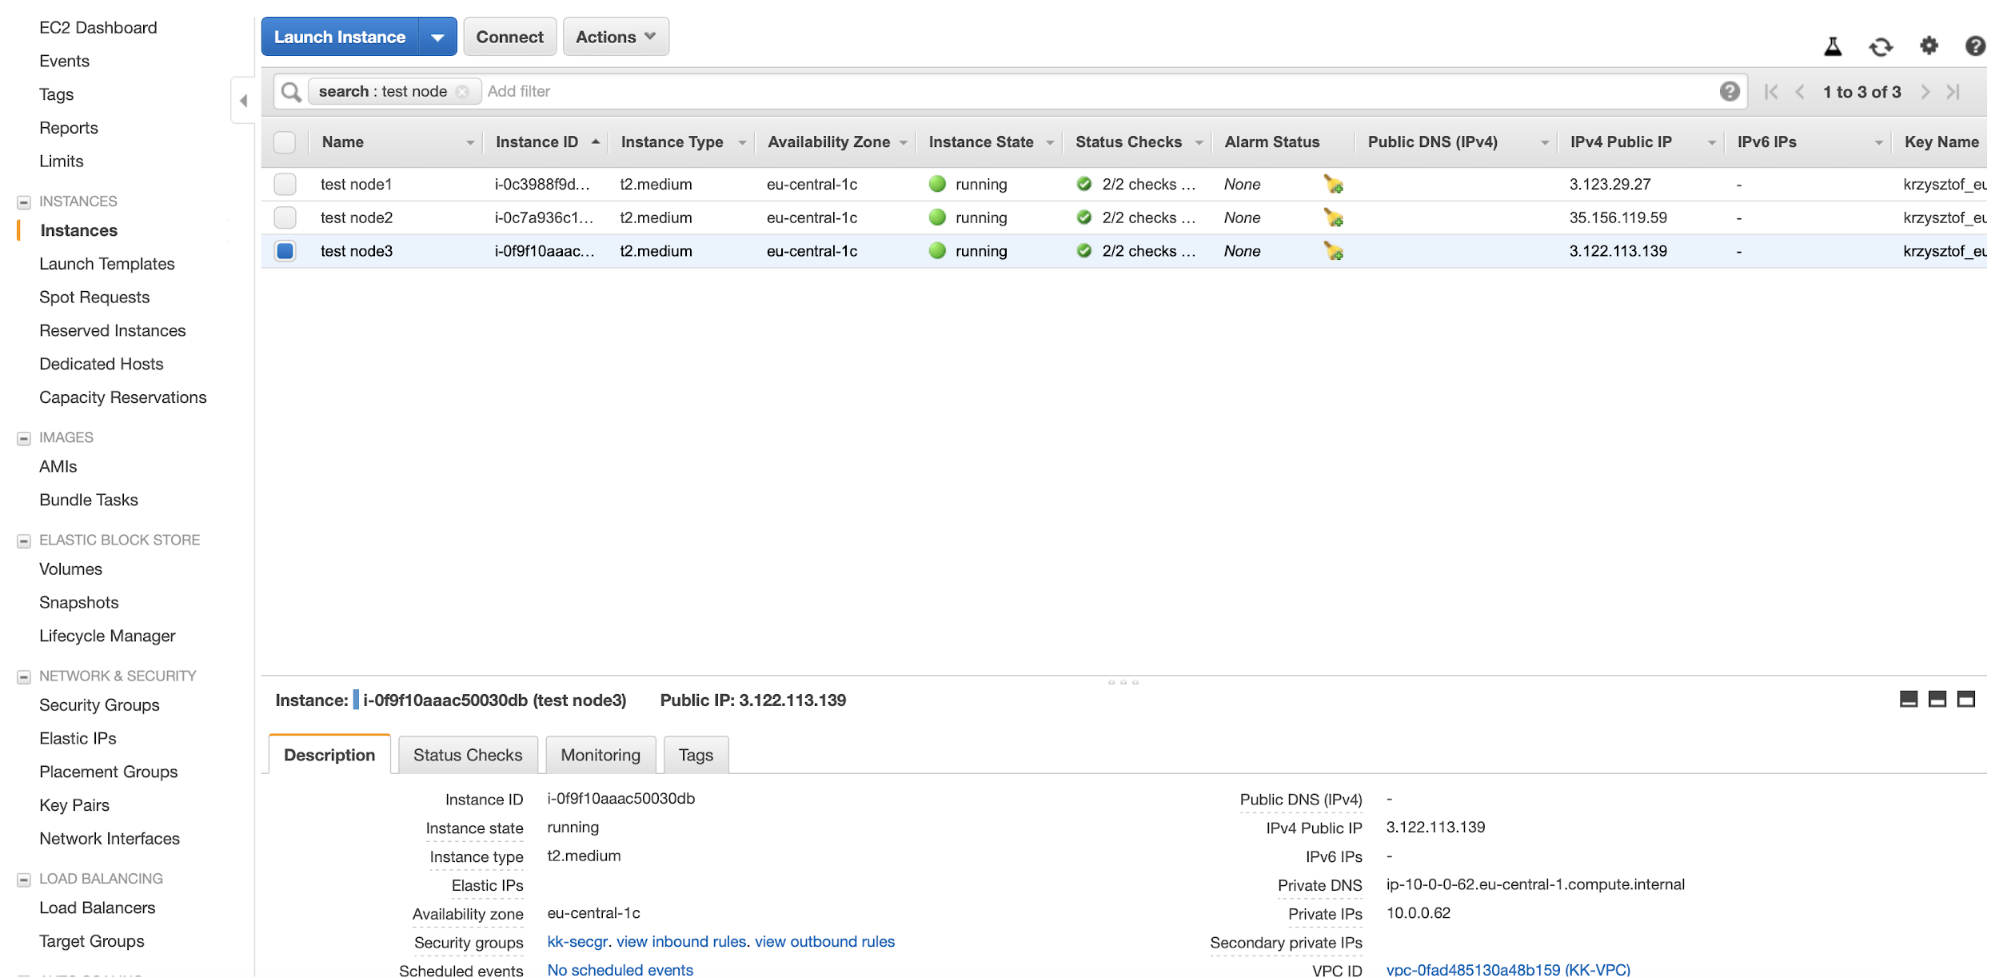
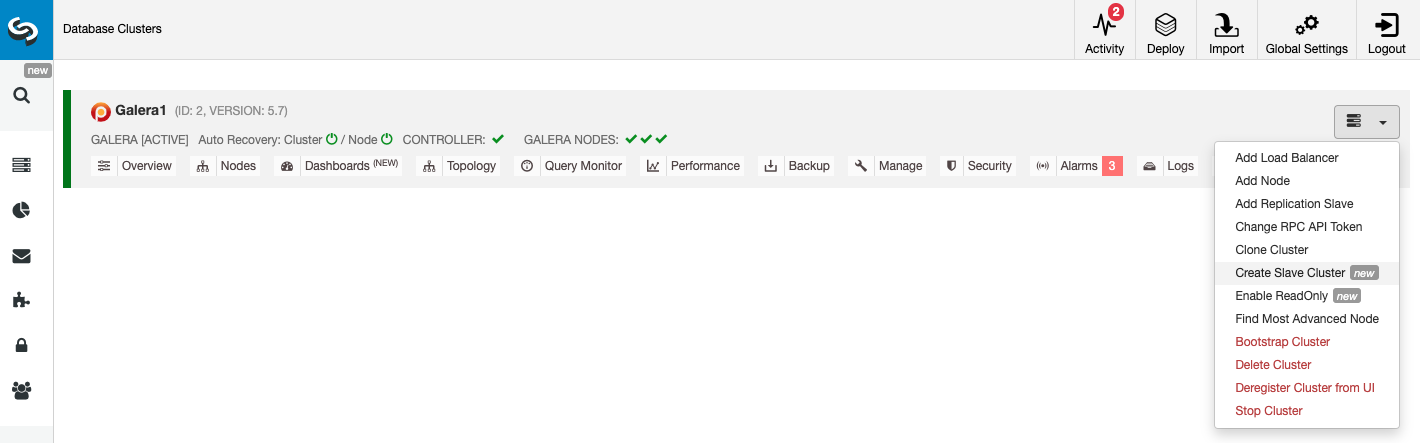
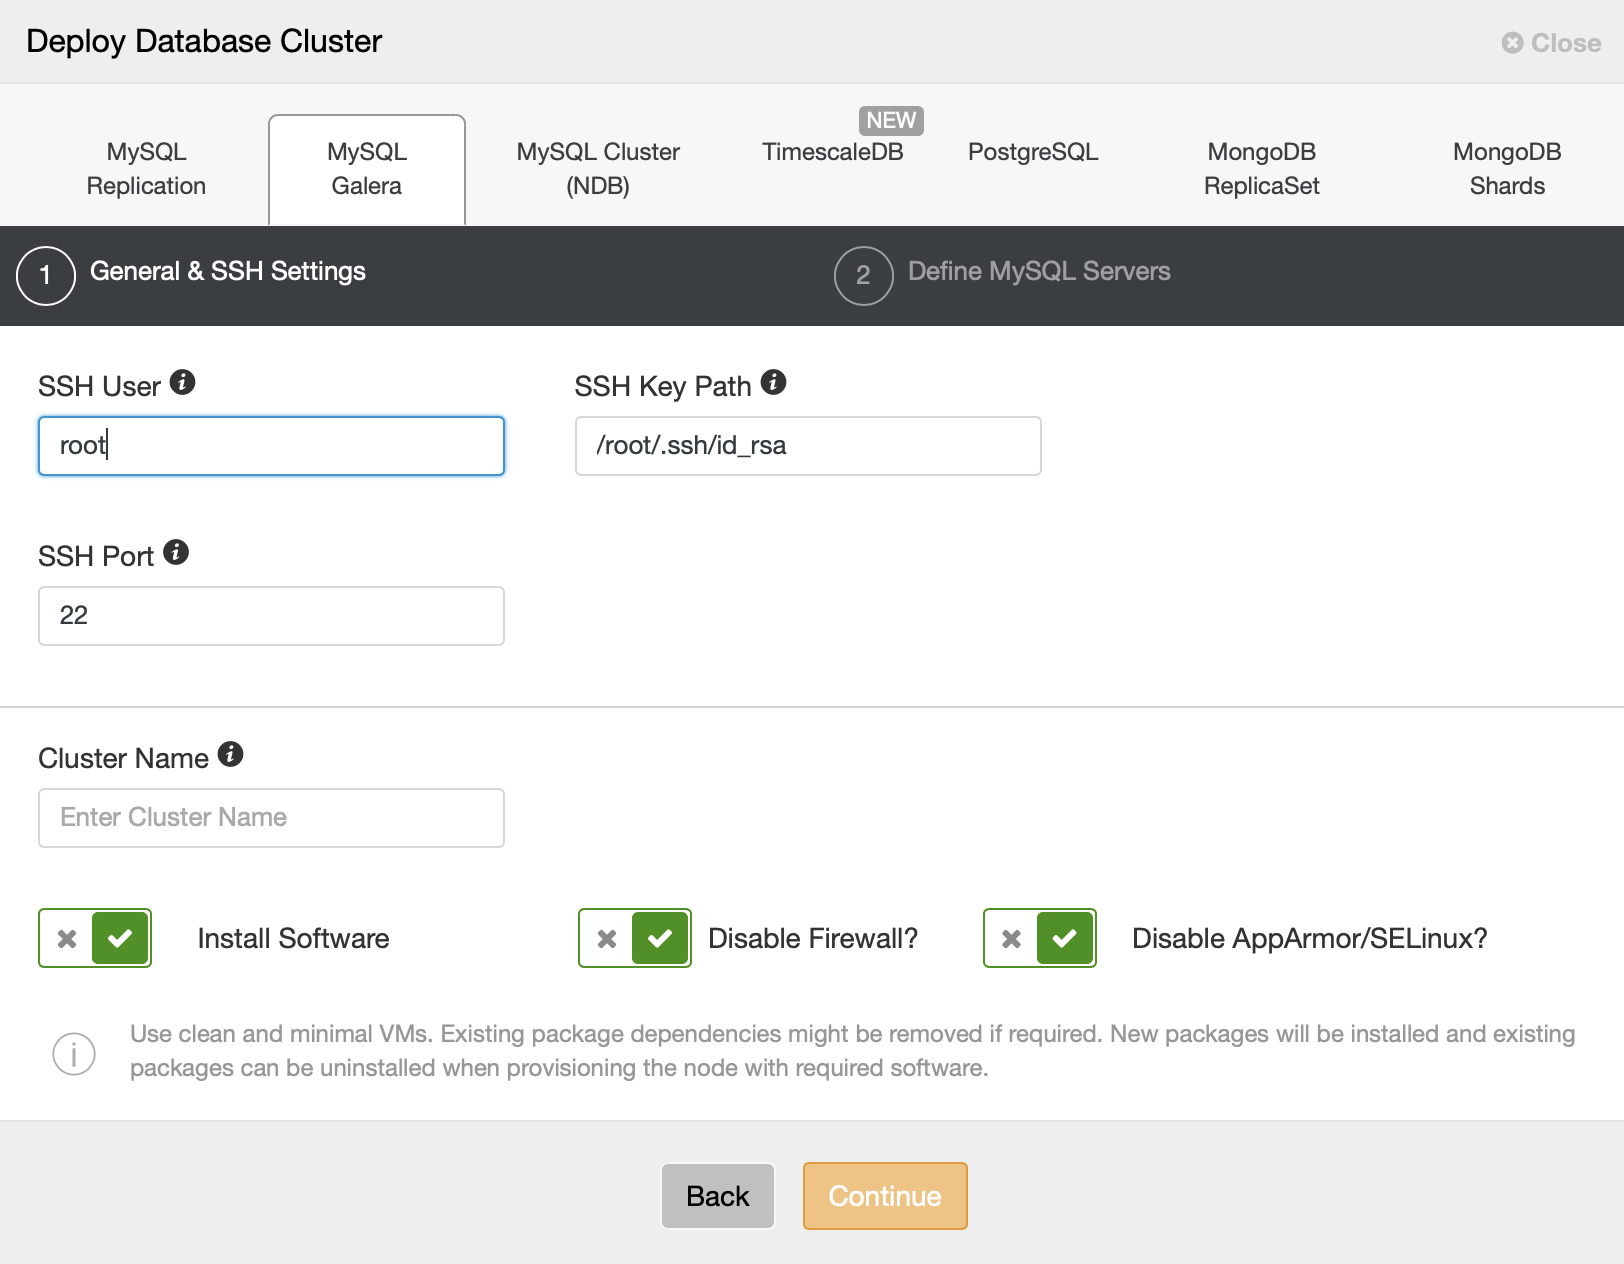
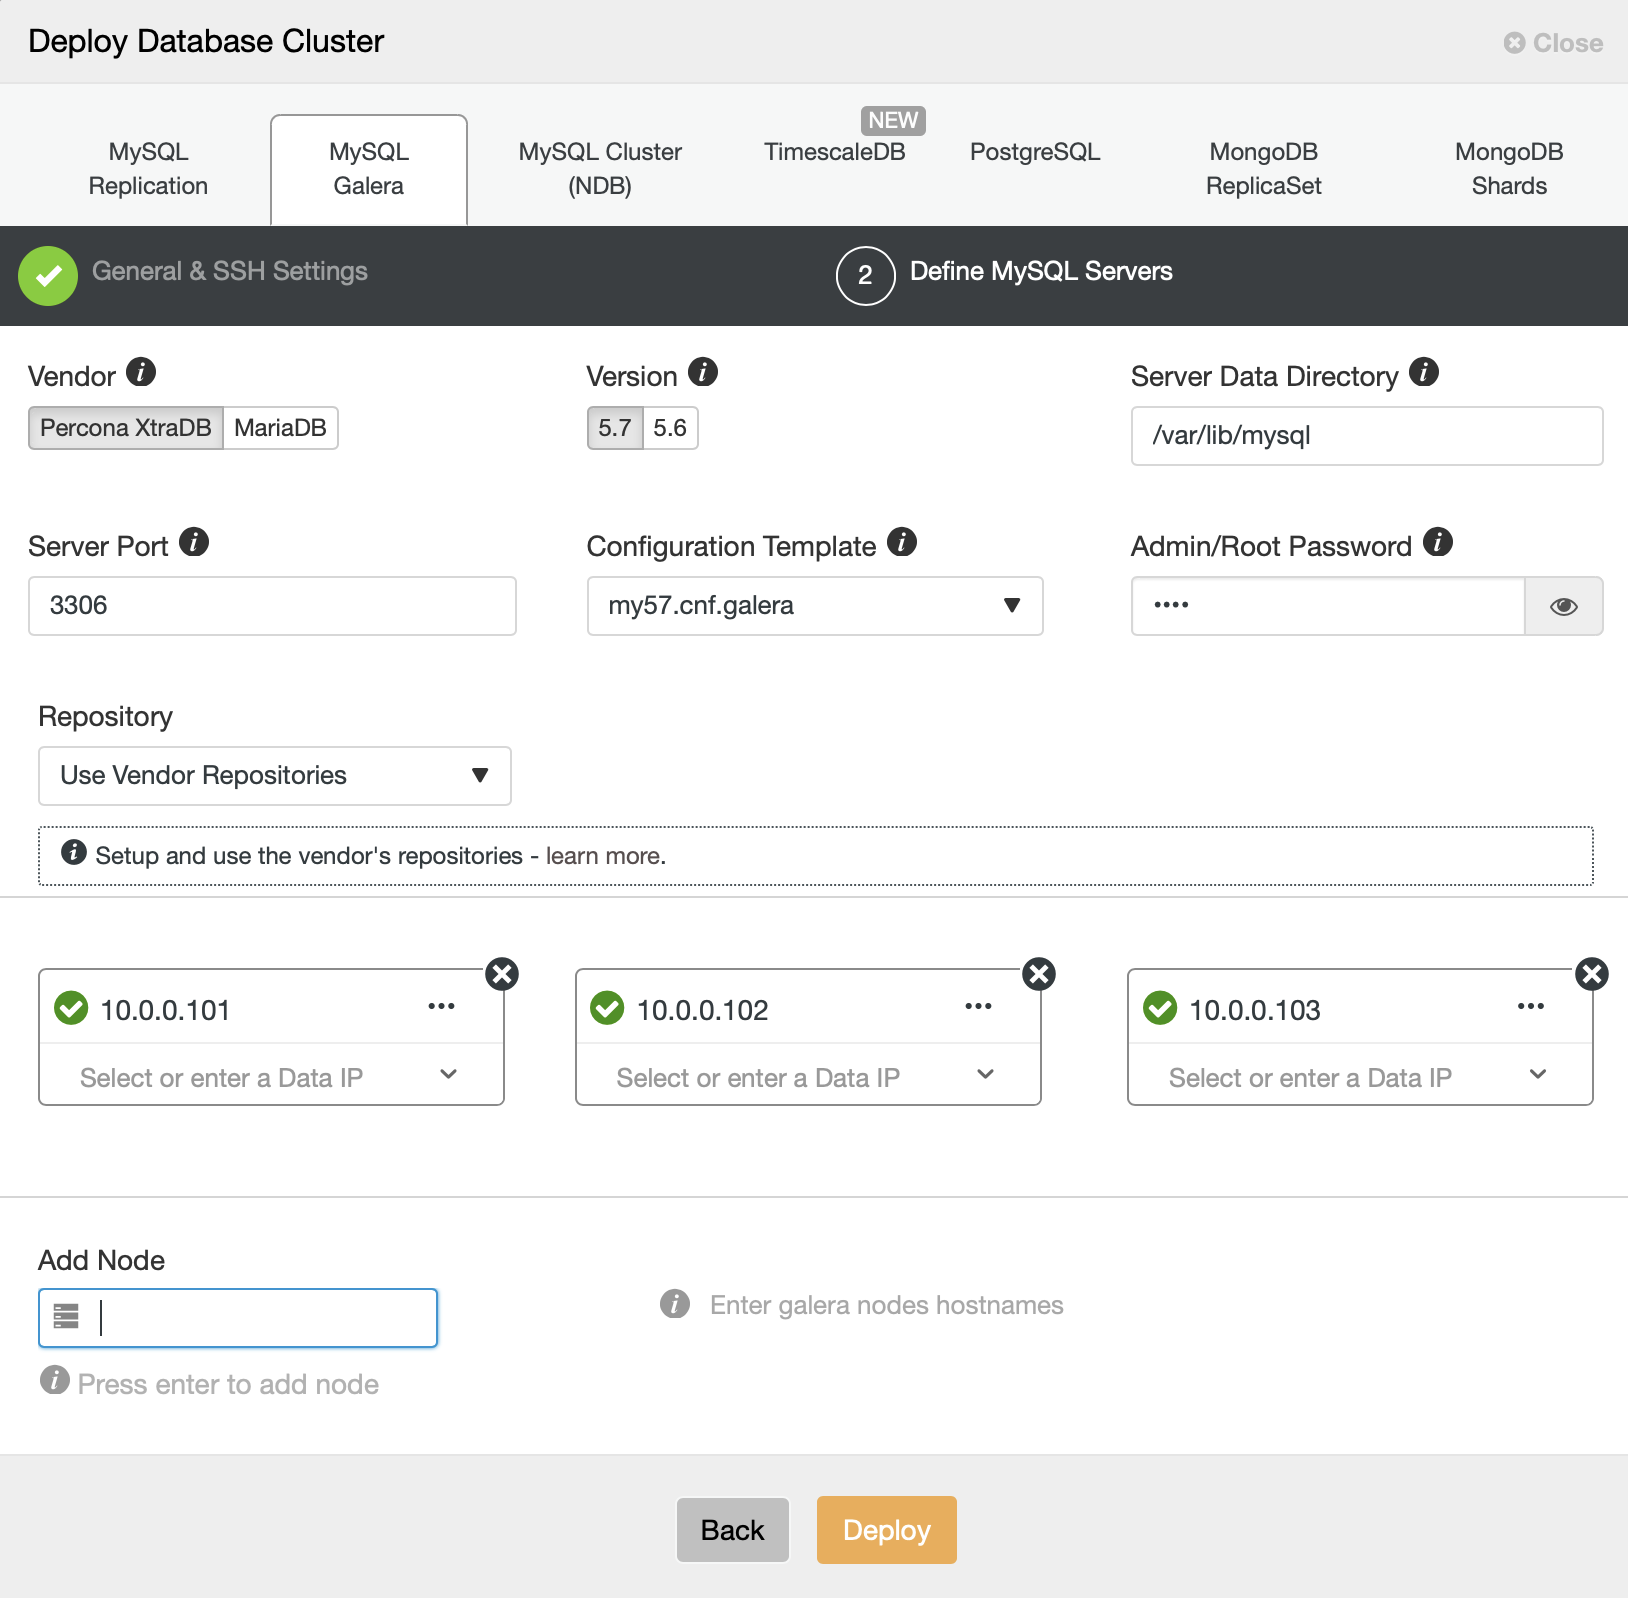
Galera Cluster (Percona, Codership, or MariaDB) variants, unfortunately, aren't supported by Azure. The only way you can deploy your Galera Cluster to Azure is by means of a Virtual Machine. You may also want to check their blog on using MariaDB Enterprise Cluster (which is based on Galera) on Azure.

Azure's Virtual Machine

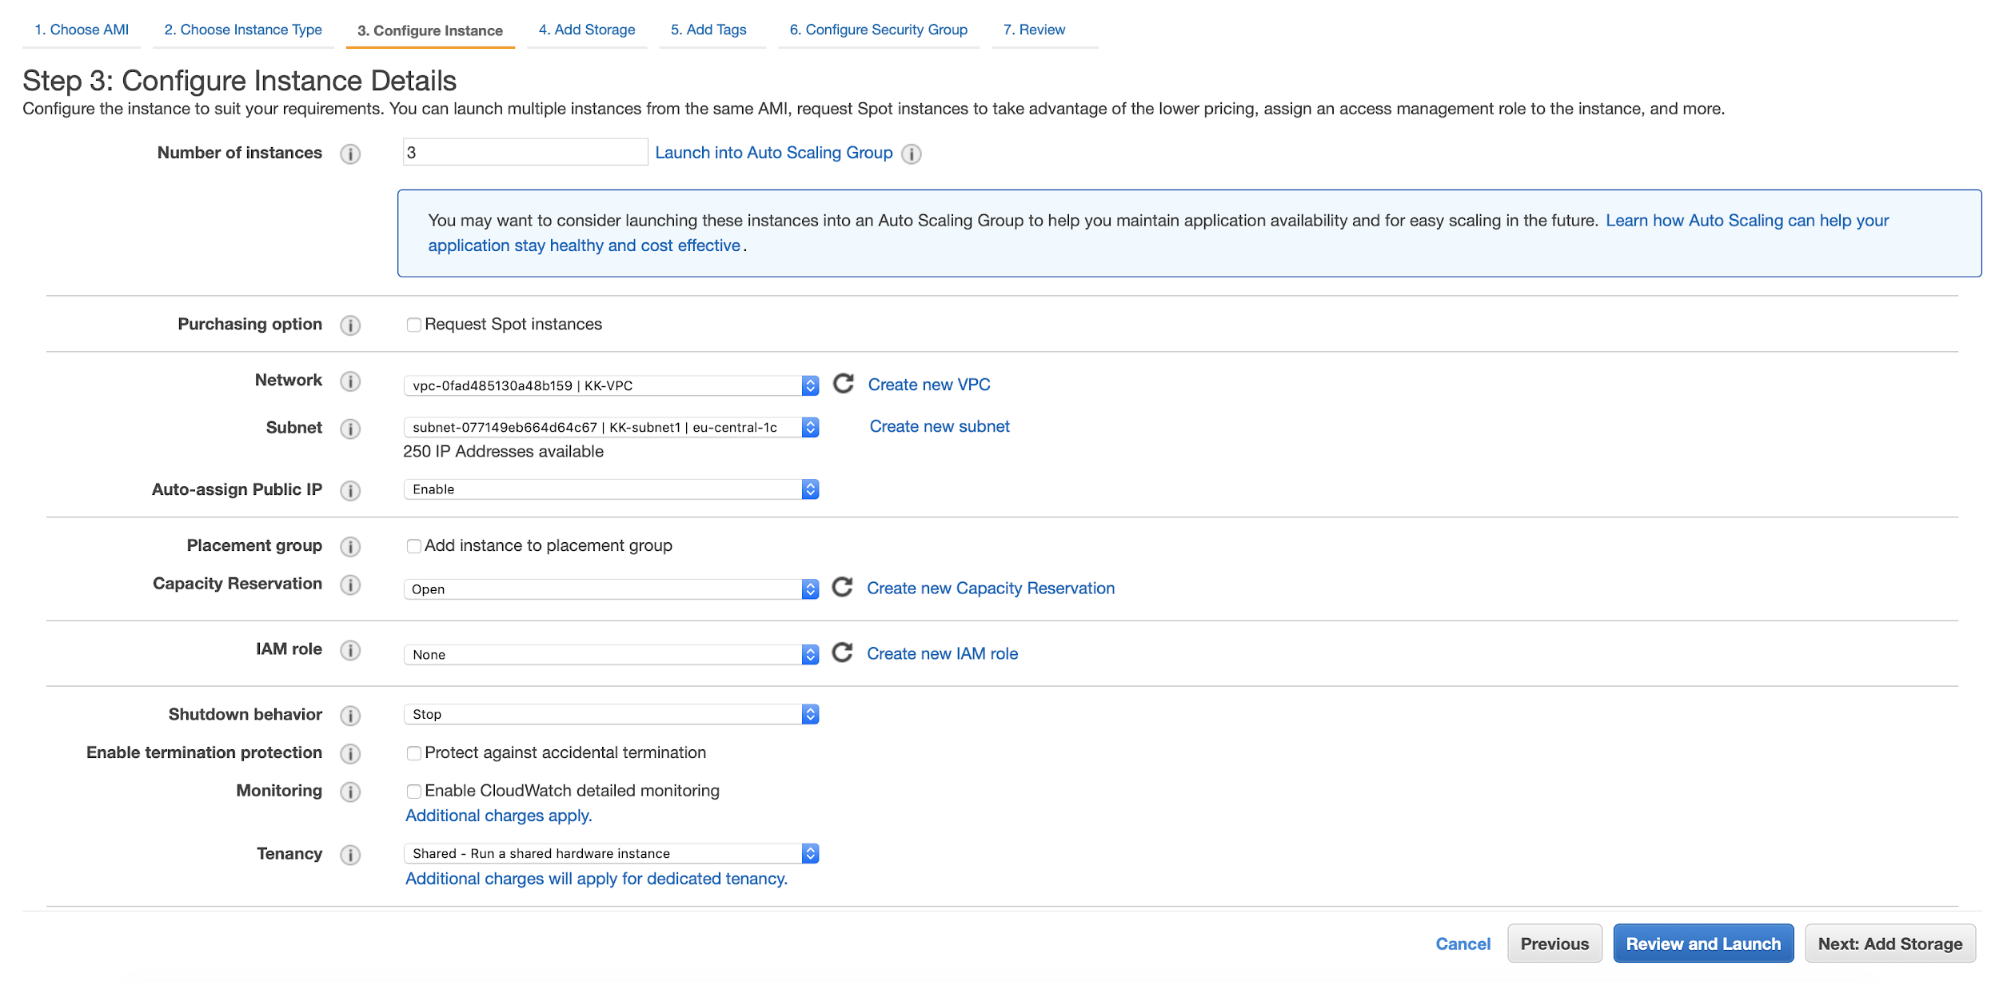
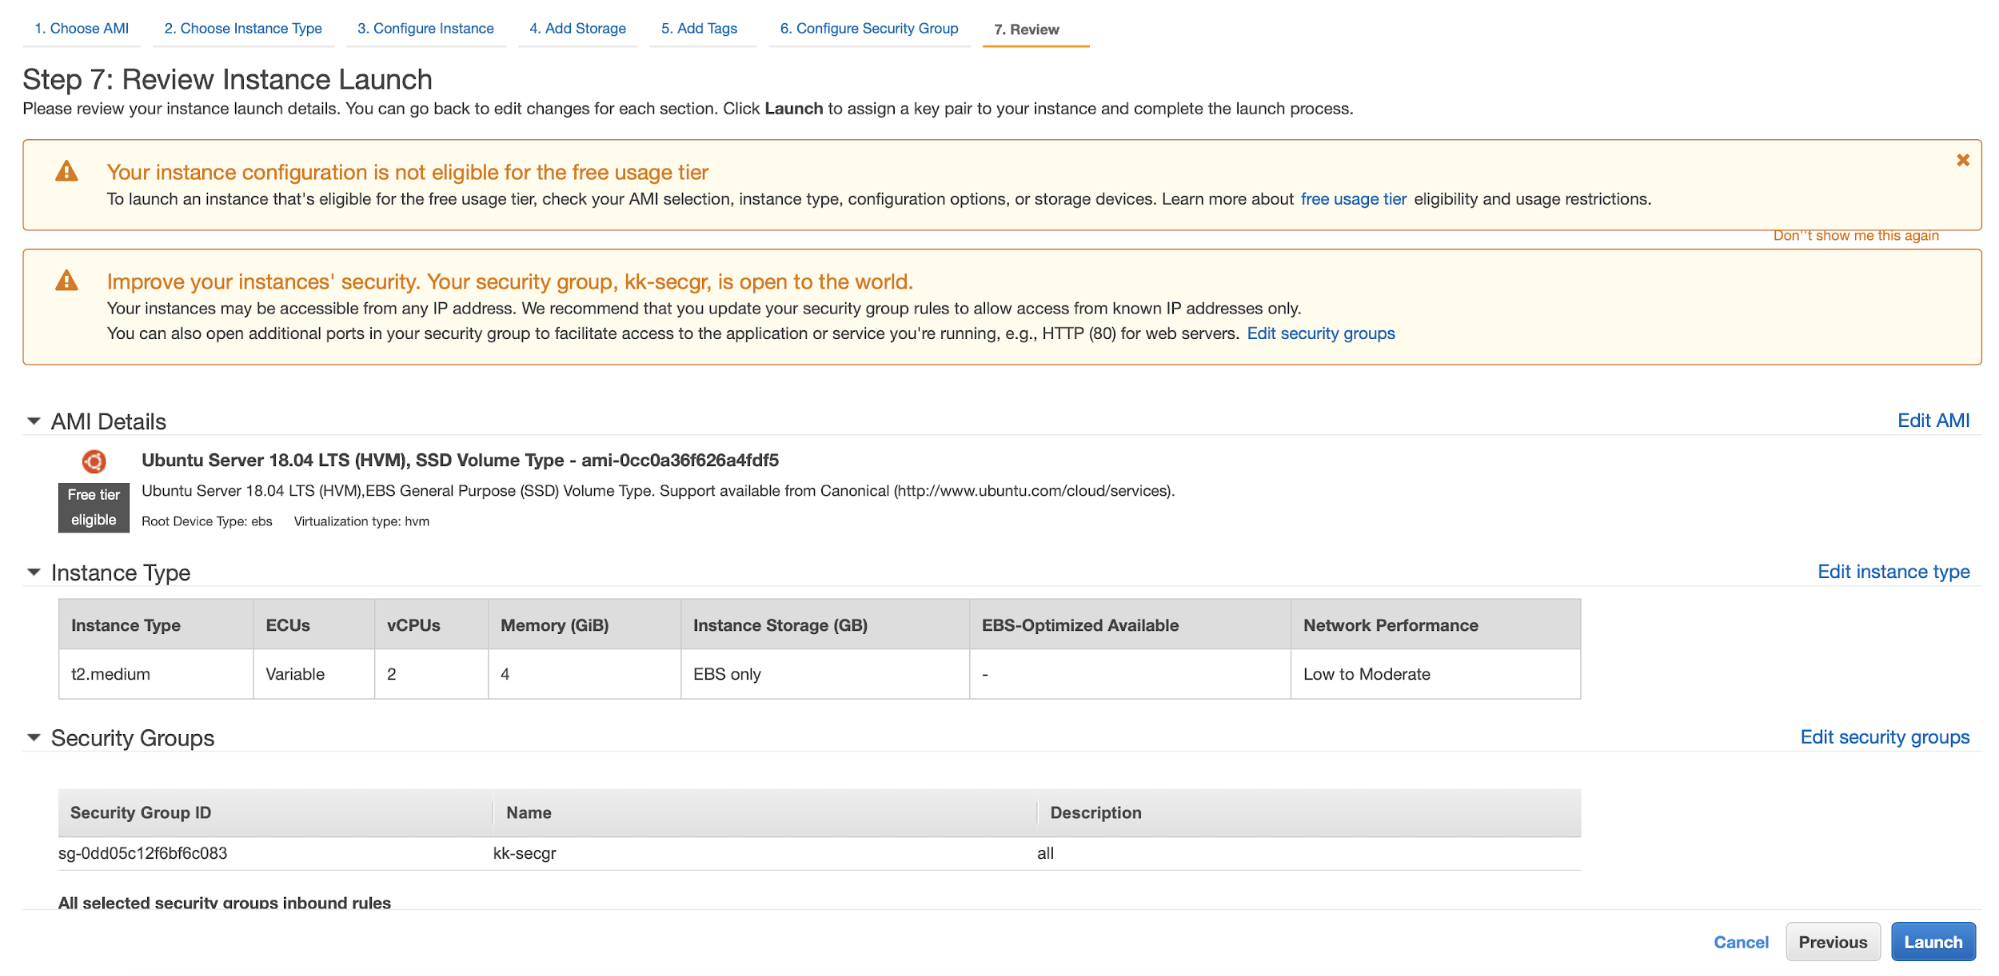
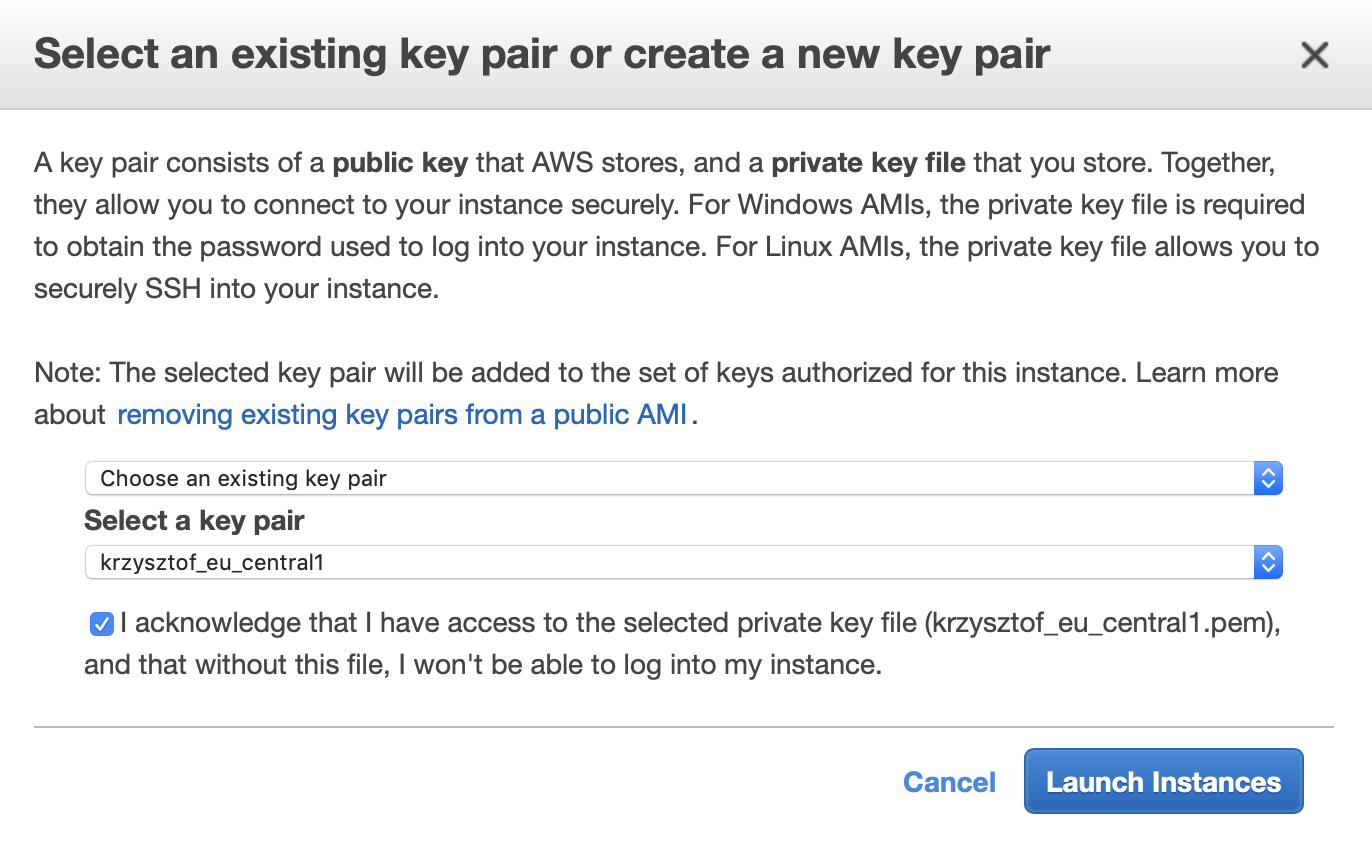
Virtual Machine is the equivalent offering for compute instances in GCP and AWS. An Azure Virtual Machine is an on-demand, high-performance computing server in the cloud and can be deployed in Azure using various methods. These might include the user interface within the Azure portal, using pre-configured images in the Azure marketplace, scripting through Azure PowerShell, deploying from a template that is defined by using a JSON file, or by deploying directly through Visual Studio.

Azure uses a deployment model called the Azure Resource Manager (ARM), which defines all resources that form part of your overall application solution, allowing you to deploy, update, or delete your solution in a single operation.

Resources may include the storage account, network configurations, and IP addresses. You may have heard the term “ARM templates”, which essentially means the JSON template which defines the different aspects of your solution which you are trying to deploy.

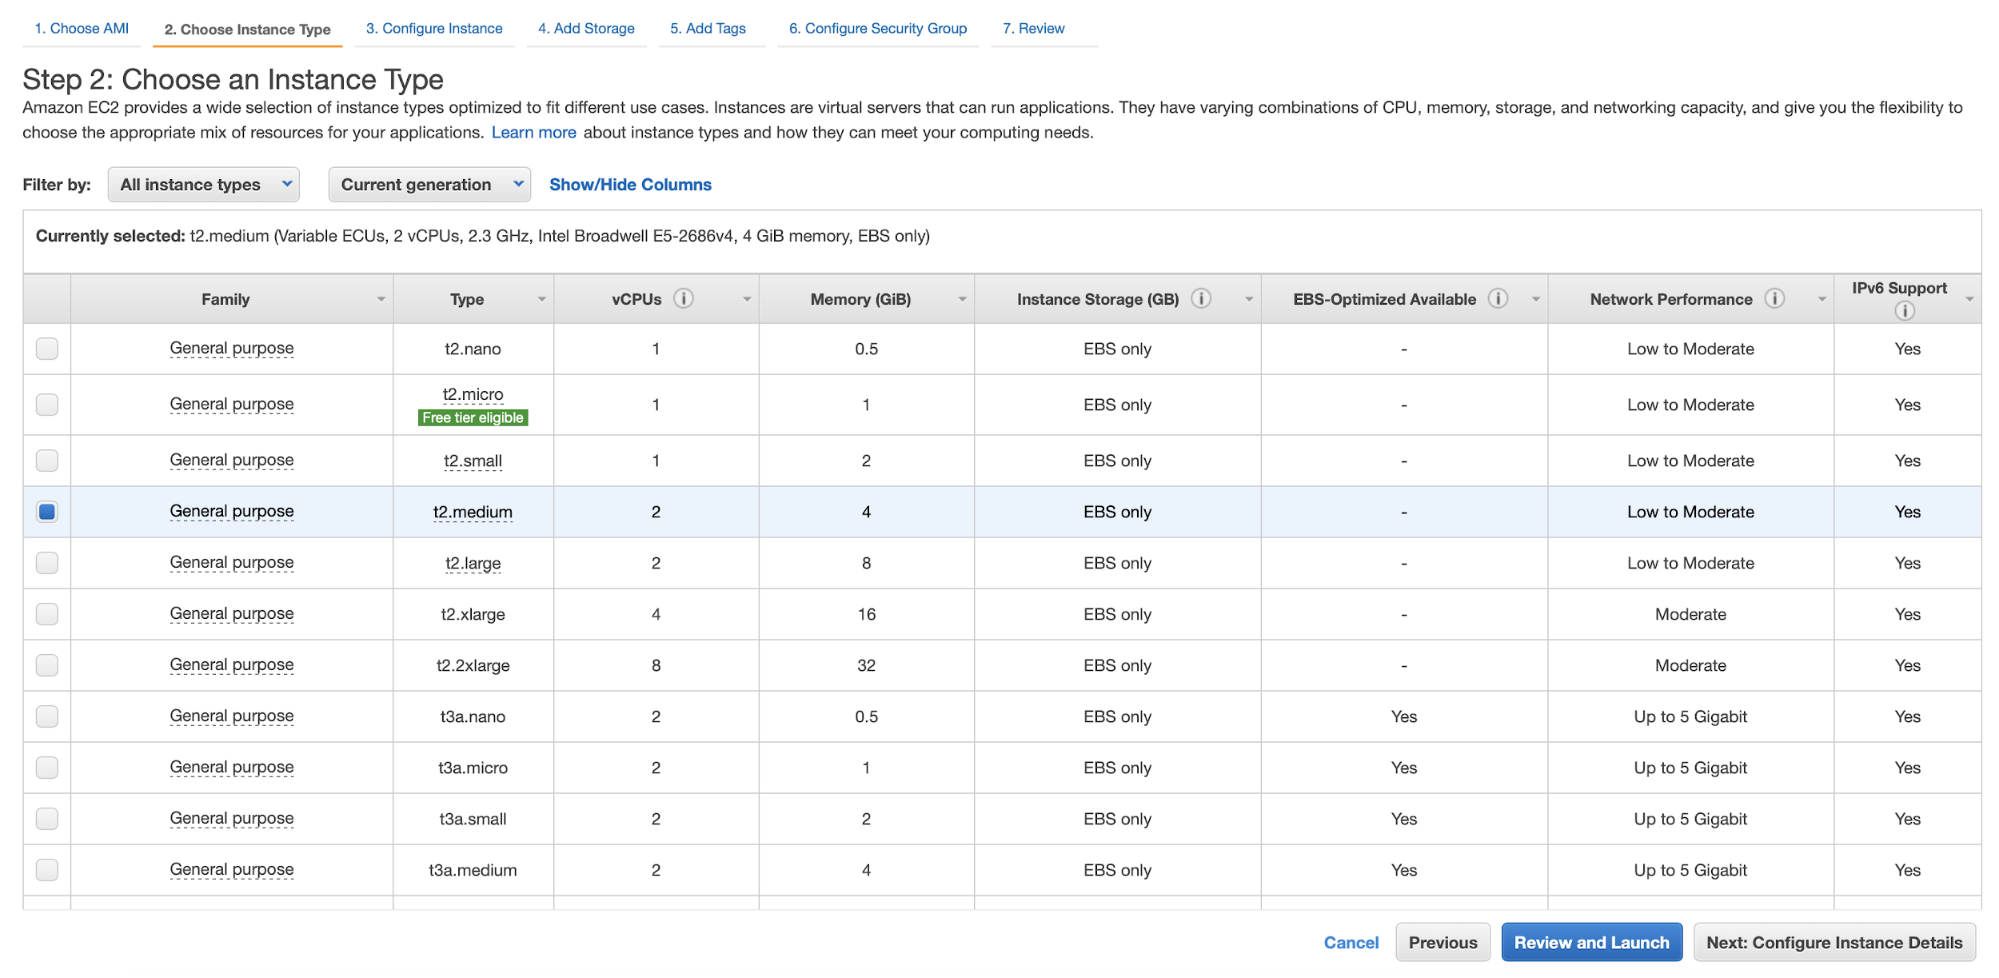
Azure Virtual Machines come in different types and sizes, with names beginning with A-series to N-series. Each VM type is built with specific workloads or performance needs in mind, including general purpose, compute optimized, storage optimized or memory optimized. You can also deploy less common types like GPU or high performance compute VMs.

Similar to other public cloud offerings, you can do the following in your virtual machine instances...

  • Encrypt your disk on virtual machine. Although this does not come easily when compared to GCP and AWS. Encrypting your virtual machine requires a more manual approach. It requires you to complete the Azure Disk Encryption prerequisites. Since Galera does not support Windows, we're only talking here about Linux-based images. Basically, it requires you to have dm-crypt and vfat modules present in the system. Once you get that piece right, then you can encrypt the VM using the Azure CLI. You can check out how to Enable Azure Disk Encryption for Linux IaaS VMs to see how to do it. Encrypting your disk is very important, especially if your company or organization requires that your Galera Cluster data must follow the standards mandated by laws and regulations such as PCI DSS or GDPR.
  • Creating a snapshot. You can create a snapshot either using the Azure CLI or through the portal. Check their manual on how to do it.
  • Use auto scaling or Virtual Machine Scale Sets if you require horizontal scaling. Check out the overview of autoscaling in Azure or the overview of virtual machine scale sets.
  • Multi Zone Deployment. Deploy your virtual machine instances into different availability zones to avoid single-point of failure.

You can also create (or get information from) your virtual machines in different ways. You can use the Azure portal, Azure PowerShell, REST APIs, Client SDKs, or with the Azure CLI. Virtual machines in the Azure virtual network can also easily be connected to your organization’s network and treated as an extended datacenter.

Microsoft Azure Pricing

Just like other public cloud providers, Microsoft Azure also offers a free tier with some free services. It also offers pay-as-you-go options and reserved instances to choose from. Pay-as-you-go starts at $0.008/hour - $0.126/hour.

Microsoft Azure Pricing

For reserved instances, the longer you commit and contract with Azure, the more you save on the cost. Microsoft Azure claims to help subscribers save up to 72% of their billing costs compared to its pay-as-you-go model when subscribers sign up for a one to three year term for a Windows or Linux Virtual Machine. Microsoft also offers added flexibility in the sense that if your business needs change, you can cancel your Azure RI subscription at any time and return the remaining unused RI to Microsoft as an early termination fee.

Let's checkout it's pricing in comparison between GCP, AWS EC2, and an Azure Virtual Machine. This is based on us-east1 region and we will compare the price ranges for the compute instances required to run your Galera Cluster.

Machine/
Instance
Type

Google
Compute Engine

AWS EC2

Microsoft
Azure

Shared

f1-micro

G1-small

Prices starts at $0.006 -  $0.019 hourly

t2.nano – t3a.2xlarge

Price starts at $0.0058 - $0.3328 hourly

B-Series

Price starts at $0.0052 - $0.832 hourly

Standard

n1-standard-1 – n1-standard-96

Prices starts at $0.034  - $3.193 hourly

m4.large – m4.16xlarge

m5.large – m5d.metal

Prices starts at $0.1 - $5.424  hourly

Av2 Standard, D2-64 v3 latest generation, D2s-64s v3 latest generation, D1-5 v2, DS1-S5 v2, DC-series

Price starts at $0.043 - $3.072 hourly

High Memory/ Memory Optimized

n1-highmem-2 – n1-highmem-96

n1-megamem-96

n1-ultramem-40 – n1-ultramem-160

Prices starts at $0.083  - $17.651 hourly

r4.large – r4.16xlarge

x1.16xlarge – x1.32xlarge

x1e.xlarge – x1e.32xlarge

Prices starts at $0.133  - $26.688 hourly

D2a – D64a v3, D2as – D64as v3, E2-64 v3 latest generation, E2a – E64a v3, E2as – E64as v3, E2s-64s v3 latest generation, D11-15 v2, DS11-S15 v2, M-series, Mv2-series, Instances, Extreme Memory Optimized

Price starts at $0.043 - $44.62 hourly

High CPU/Storage Optimized

n1-highcpu-2 – n1-highcpu-32

Prices starts at $0.05 - $2.383 hourly

h1.2xlarge – h1.16xlarge

i3.large – i3.metal

I3en.large - i3en.metal

d2.xlarge – d2.8xlarge

Prices starts at $0.156 - $10.848  hourly

Fsv2-series, F-series, Fs-Series

Price starts at $0.0497 - $3.045 hourly


Data Encryption on Microsoft Azure

Microsoft Azure does not offer encryption support directly for Galera Cluster (or vice-versa). There are, however, ways you can encrypt data either at-rest or in-transit.

Encryption in-transit is a mechanism for protecting data when it's transmitted across networks. With Azure Storage, you can secure data by using:

Microsoft uses encryption to protect customer data when it’s in-transit between customers realm and Microsoft cloud services. More specifically, Transport Layer Security (TLS) is the protocol that Microsoft’s data centers will use to negotiate with client systems that are connected to Microsoft cloud services.  

Perfect Forward Secrecy (PFS) is also employed so that each connection between customers’ client systems and Microsoft’s cloud services use unique keys. Connections to Microsoft cloud services also take advantage of RSA based 2,048-bit encryption key lengths.

Encryption At-Rest

For many organizations, data encryption at-rest is a mandatory step towards achieving data privacy, compliance, and data sovereignty. Three Azure features provide encryption of data at-rest:

  • Storage Service Encryption is always enabled and automatically encrypts storage service data when writing it to Azure Storage. If your application logic requires your MySQL Galera Cluster database to store valuable data, then storing to Azure Storage can be an option.
  • Client-side encryption also provides the feature of encryption at-rest.
  • Azure Disk Encryption enables you to encrypt the OS disks and data disks that an IaaS virtual machine uses. Azure Disk Encryption also supports enabling encryption on Linux VMs that are configured with disk striping (RAID) by using mdadm, and by enabling encryption on Linux VMs by using LVM for data disks

Galera Cluster Multi-AZ/Multi-Region/Multi-Cloud Deployments with GCP

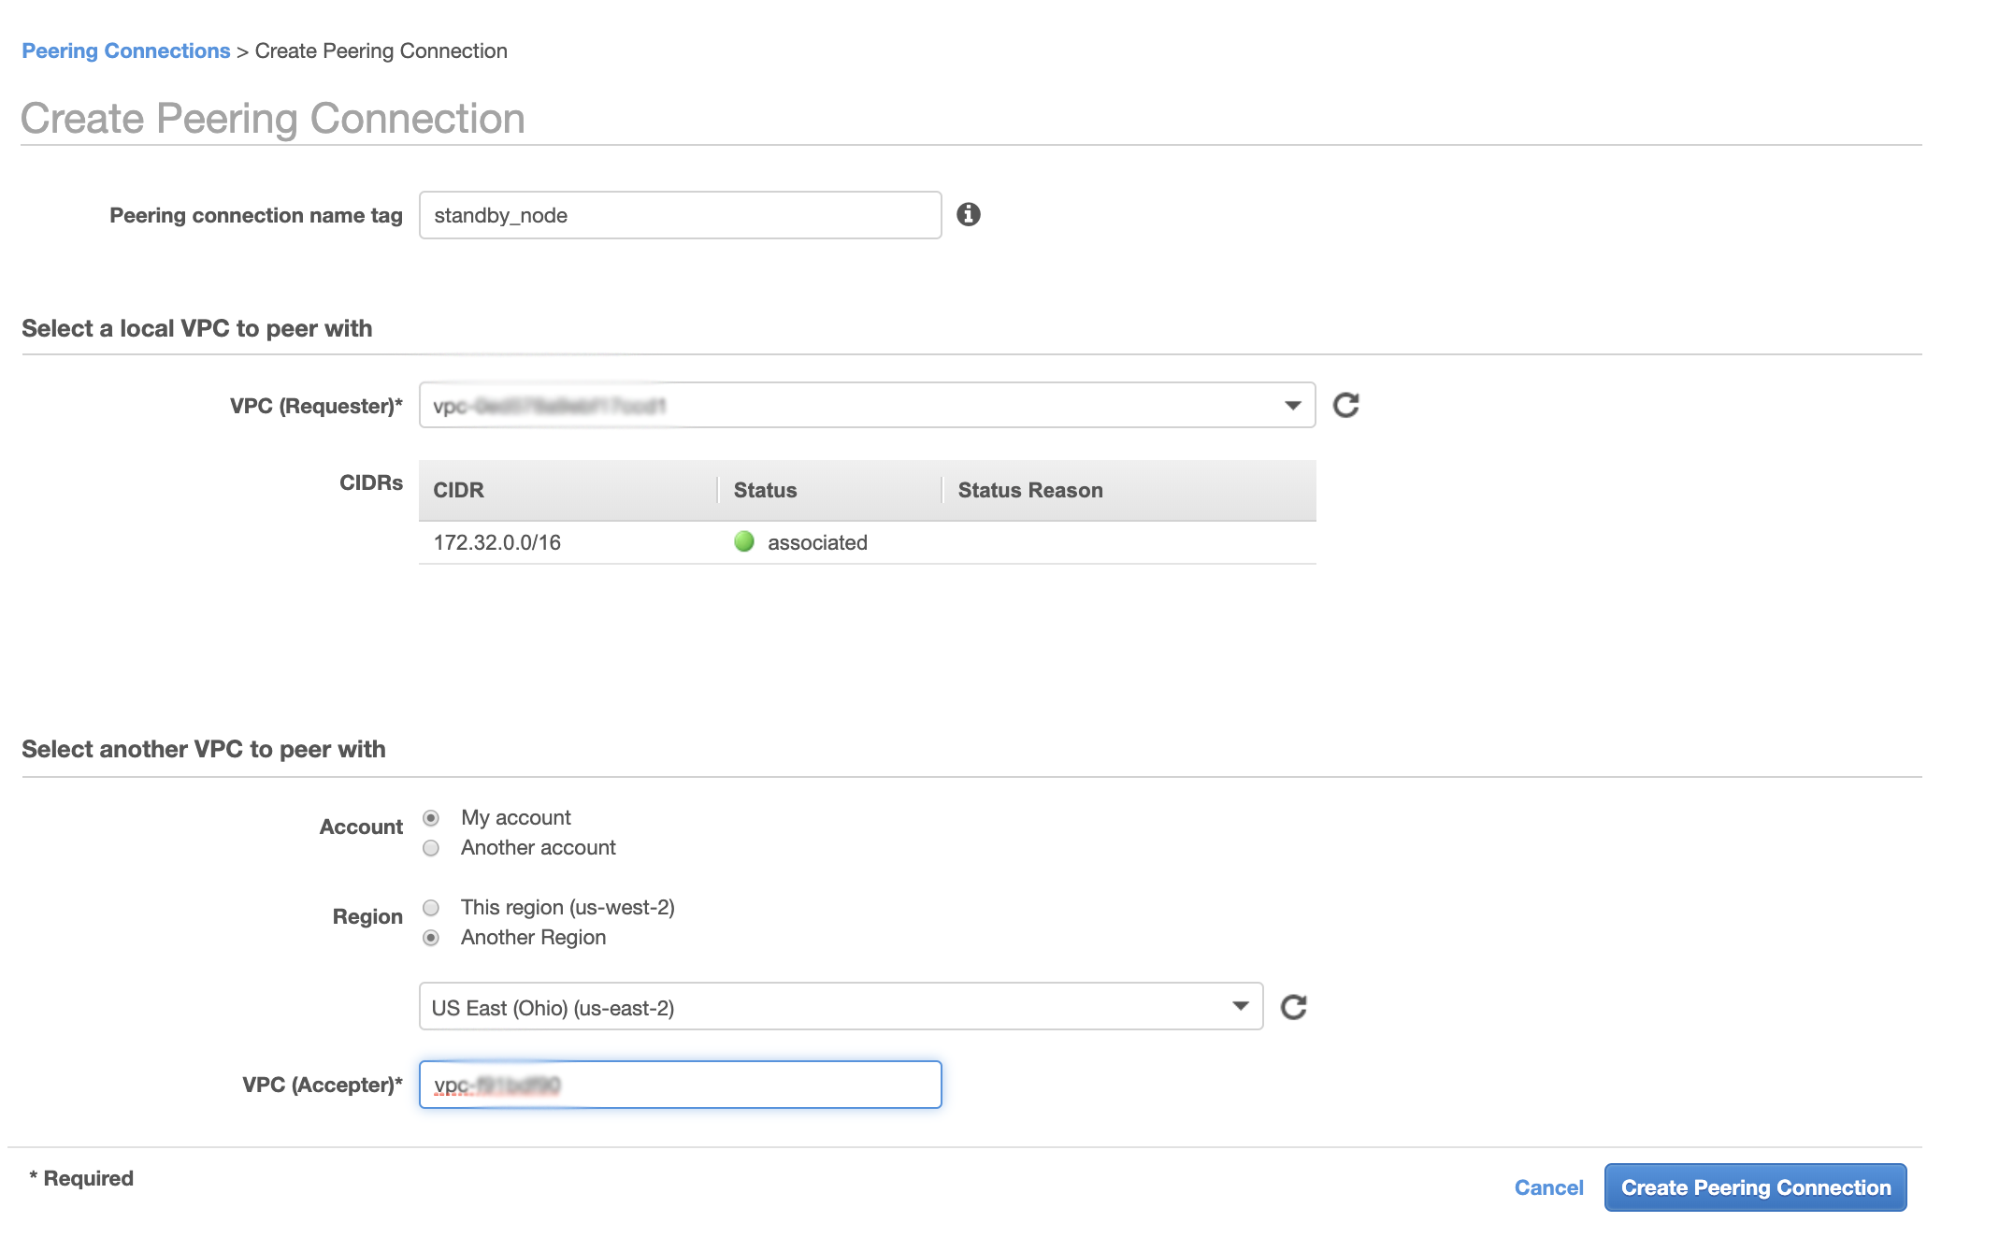
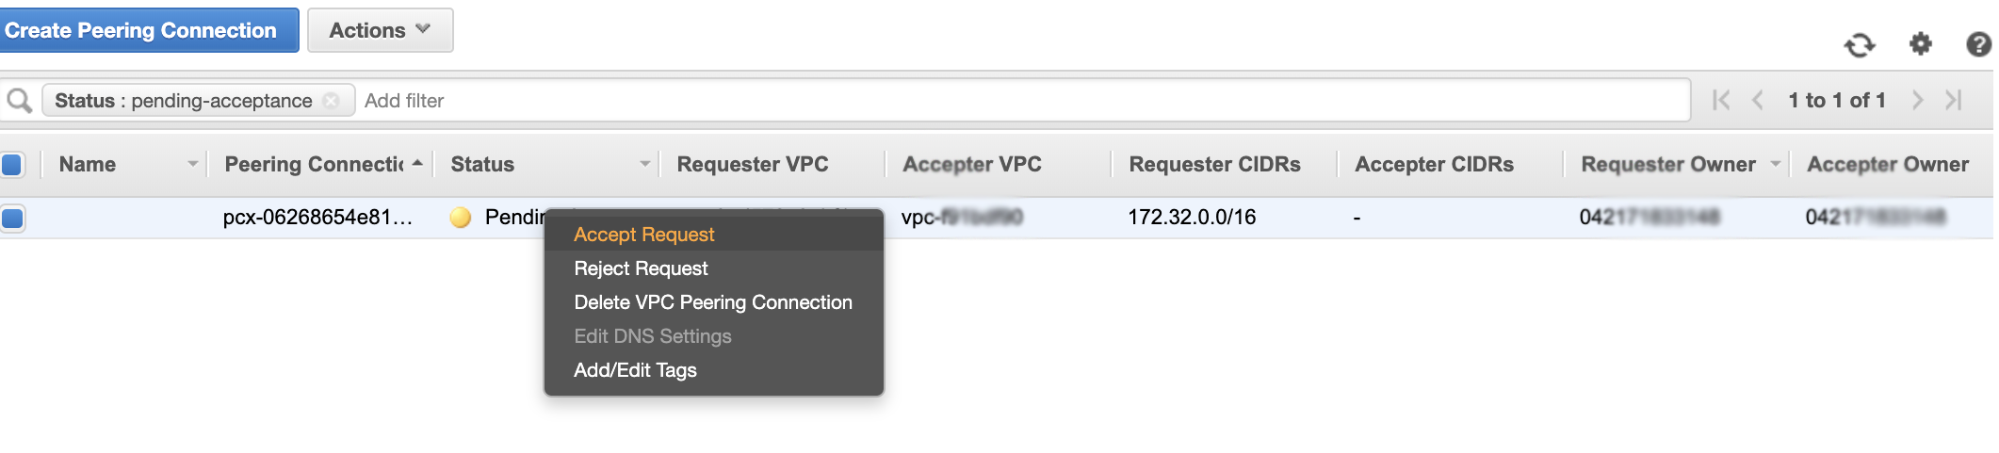
Similar to AWS and GCP, Microsoft Azure does not offer direct support for deploying a Galera Cluster onto a Multi-AZ/-Region/-Cloud. You can, however, deploy your nodes manually as well as creating scripts using PowerShell or Azure CLI to do this for you. Alternatively, when you provision your Virtual Machine instance you can place your nodes in different availability zones. Microsoft Azure also offers another type of redundancy, aside from having its availability zone, which is called Virtual Machine Scale Sets. You can check the differences between virtual machine and scale sets.

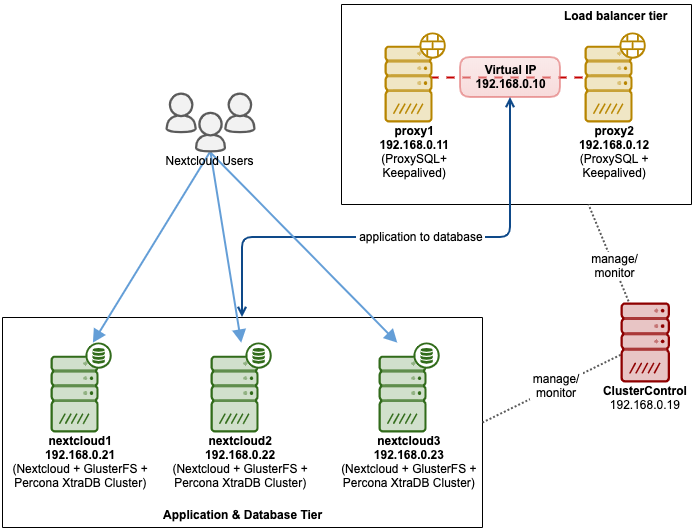
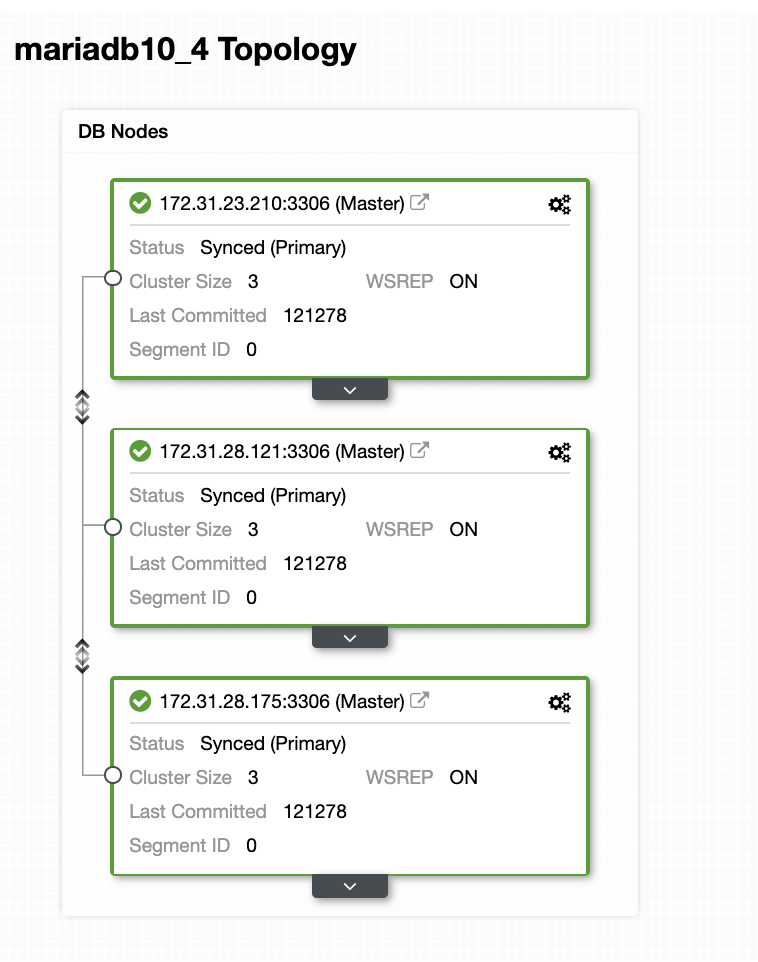
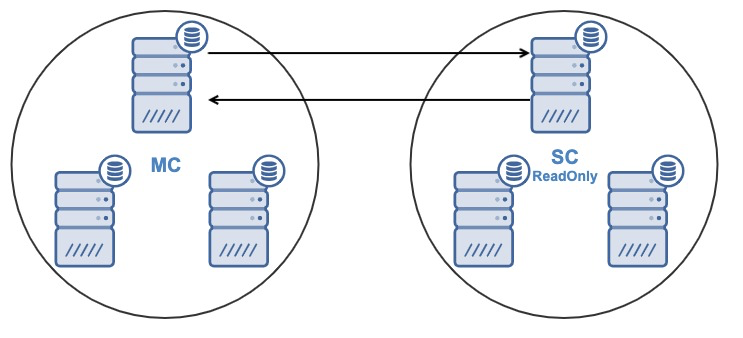
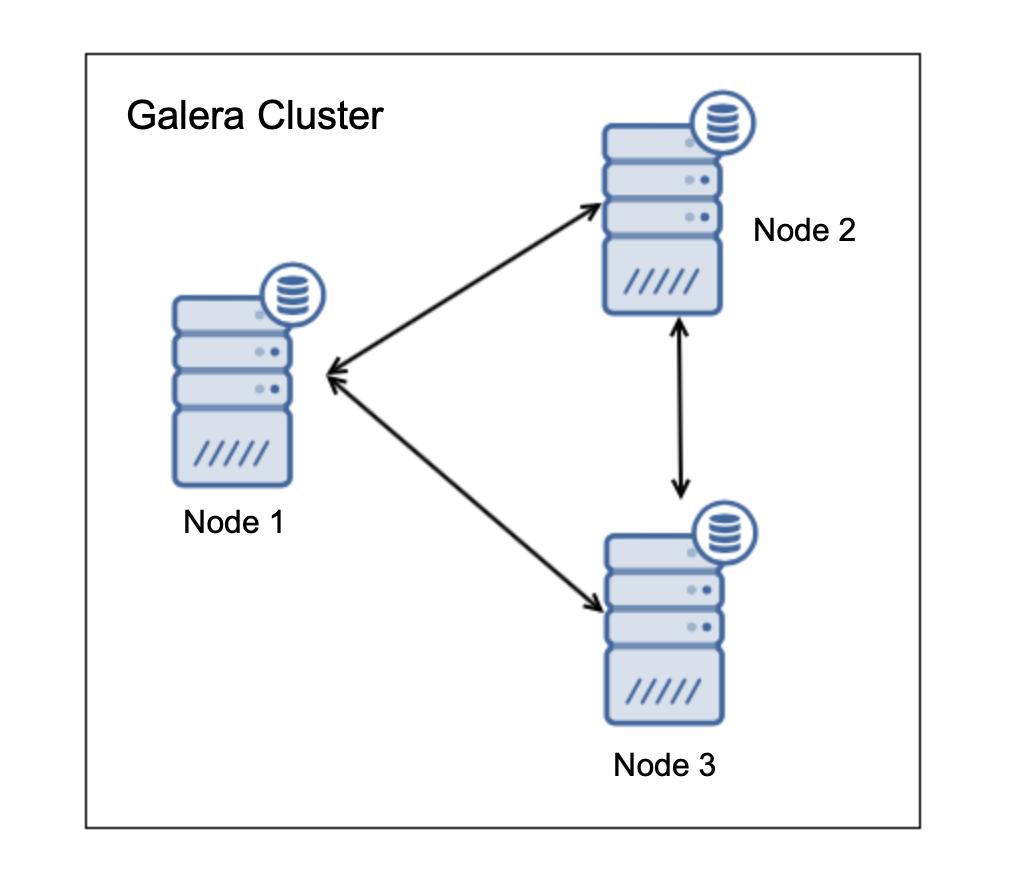
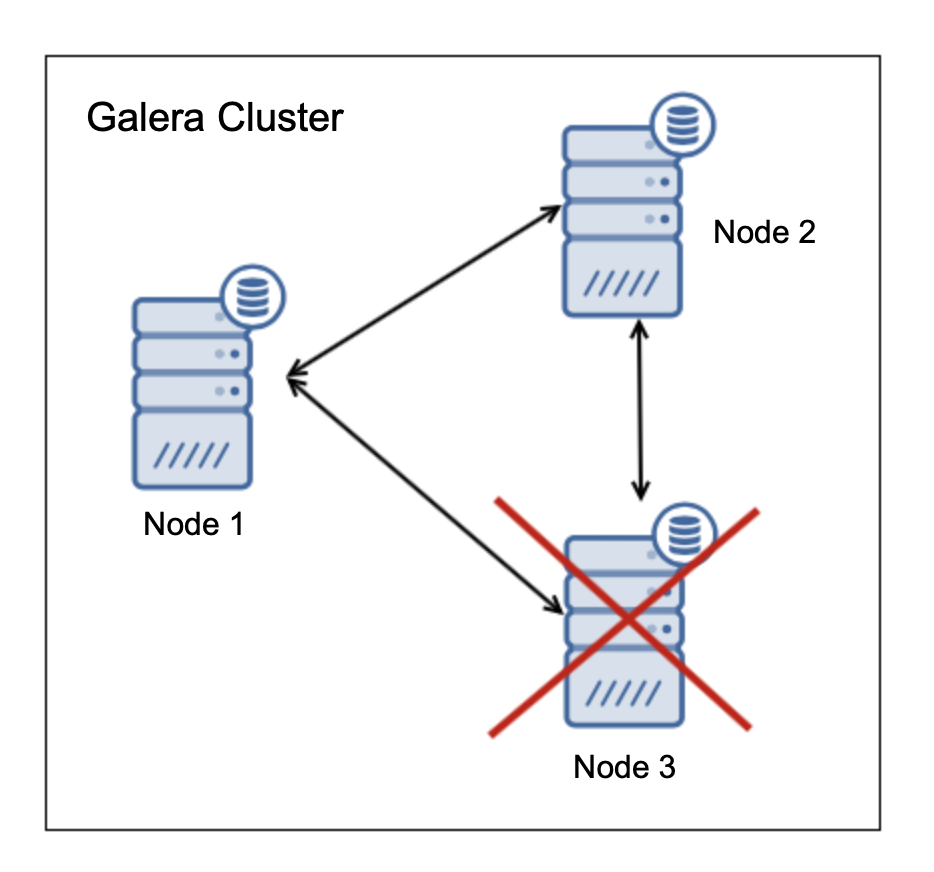
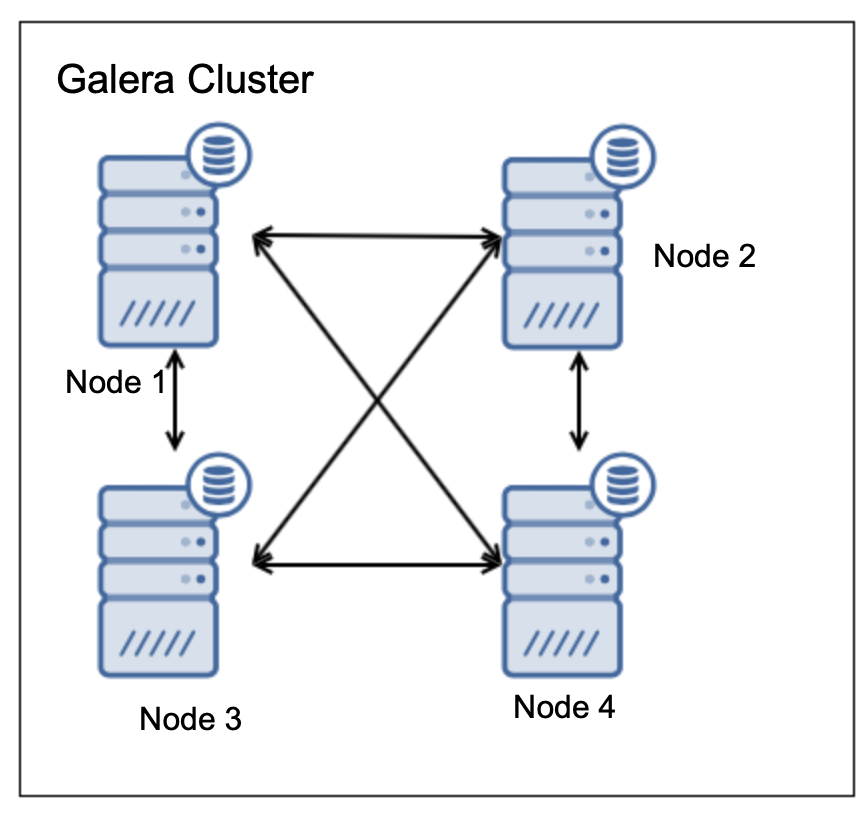
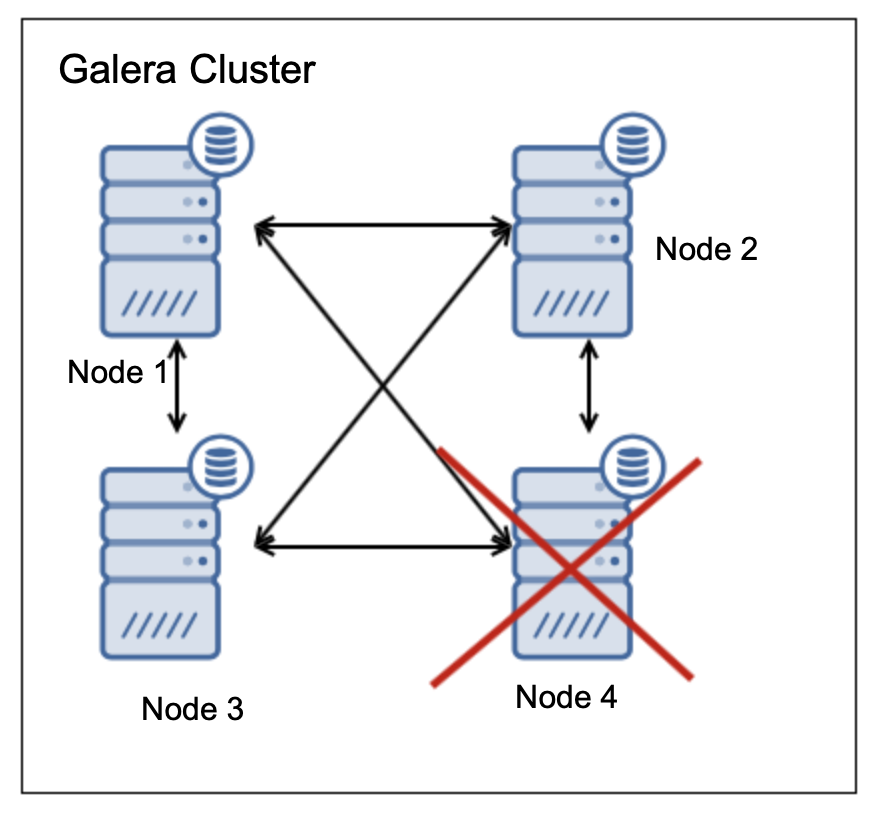
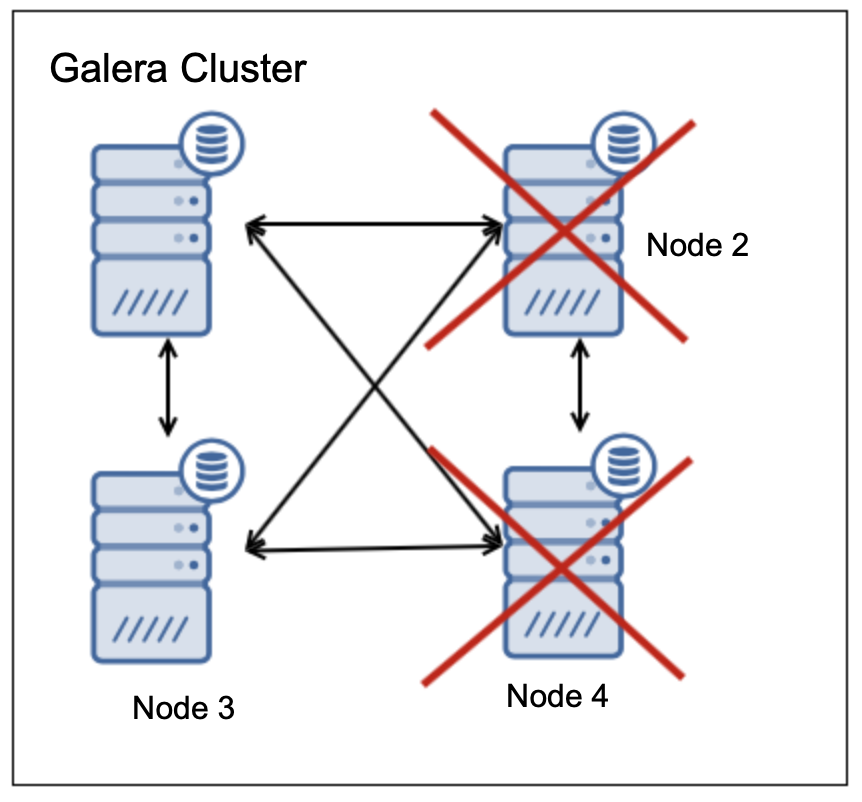
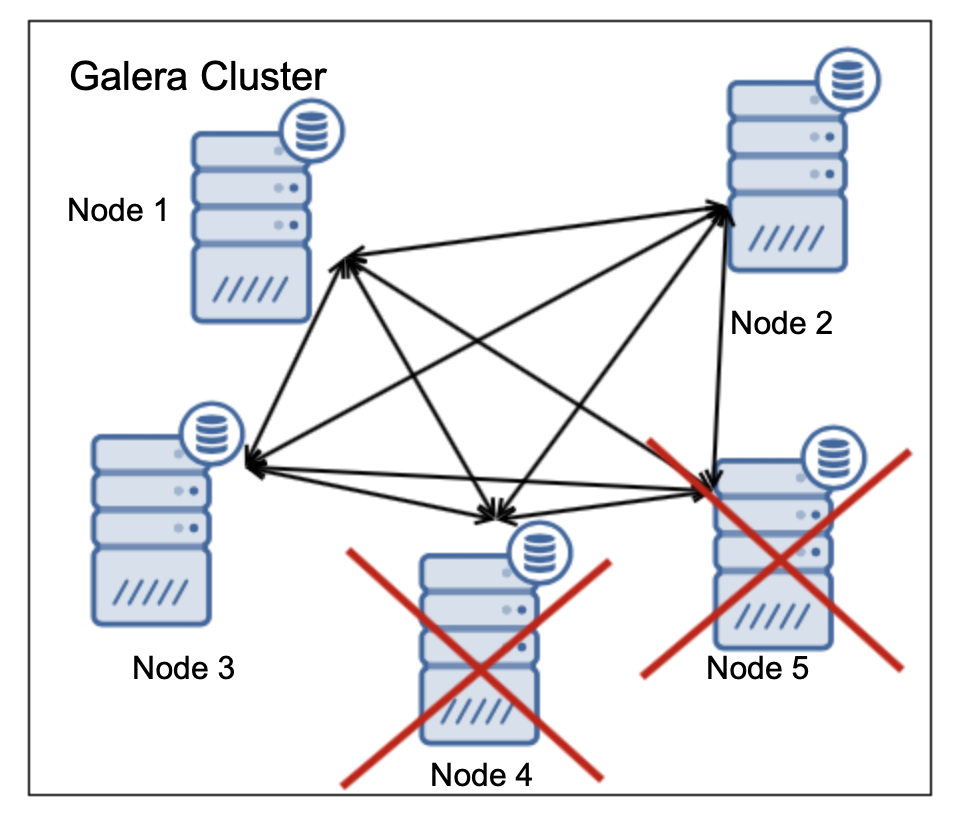
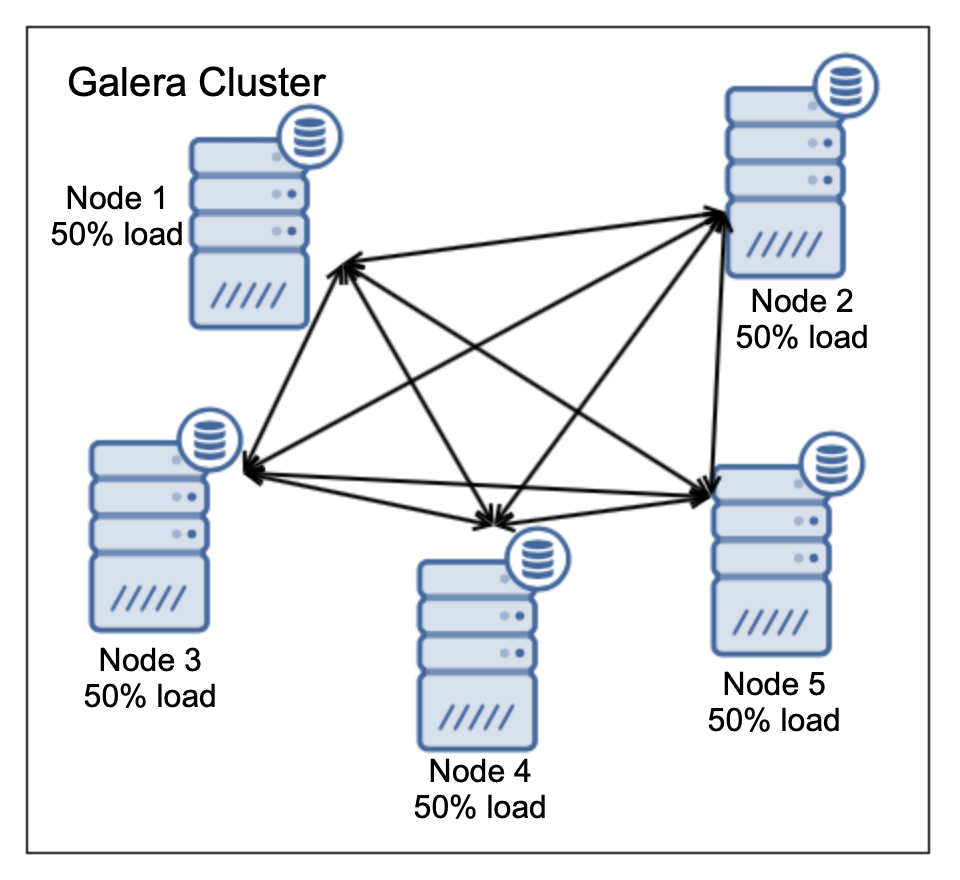
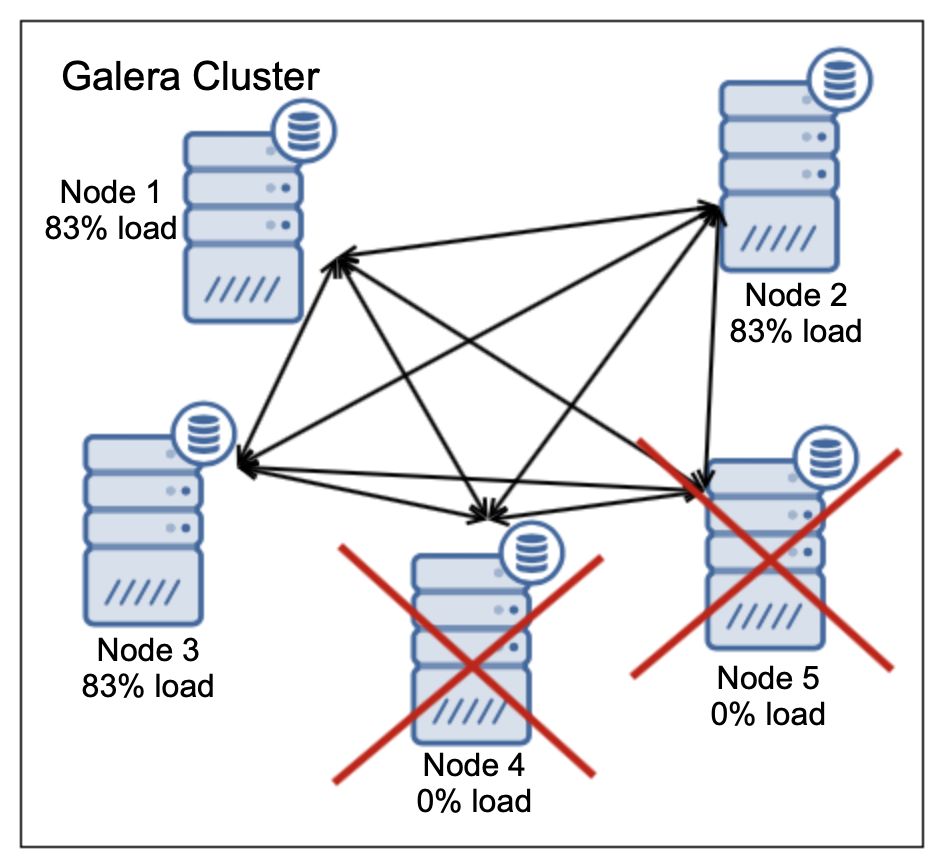
Galera Cluster High Availability, Scalability, and Redundancy on Azure

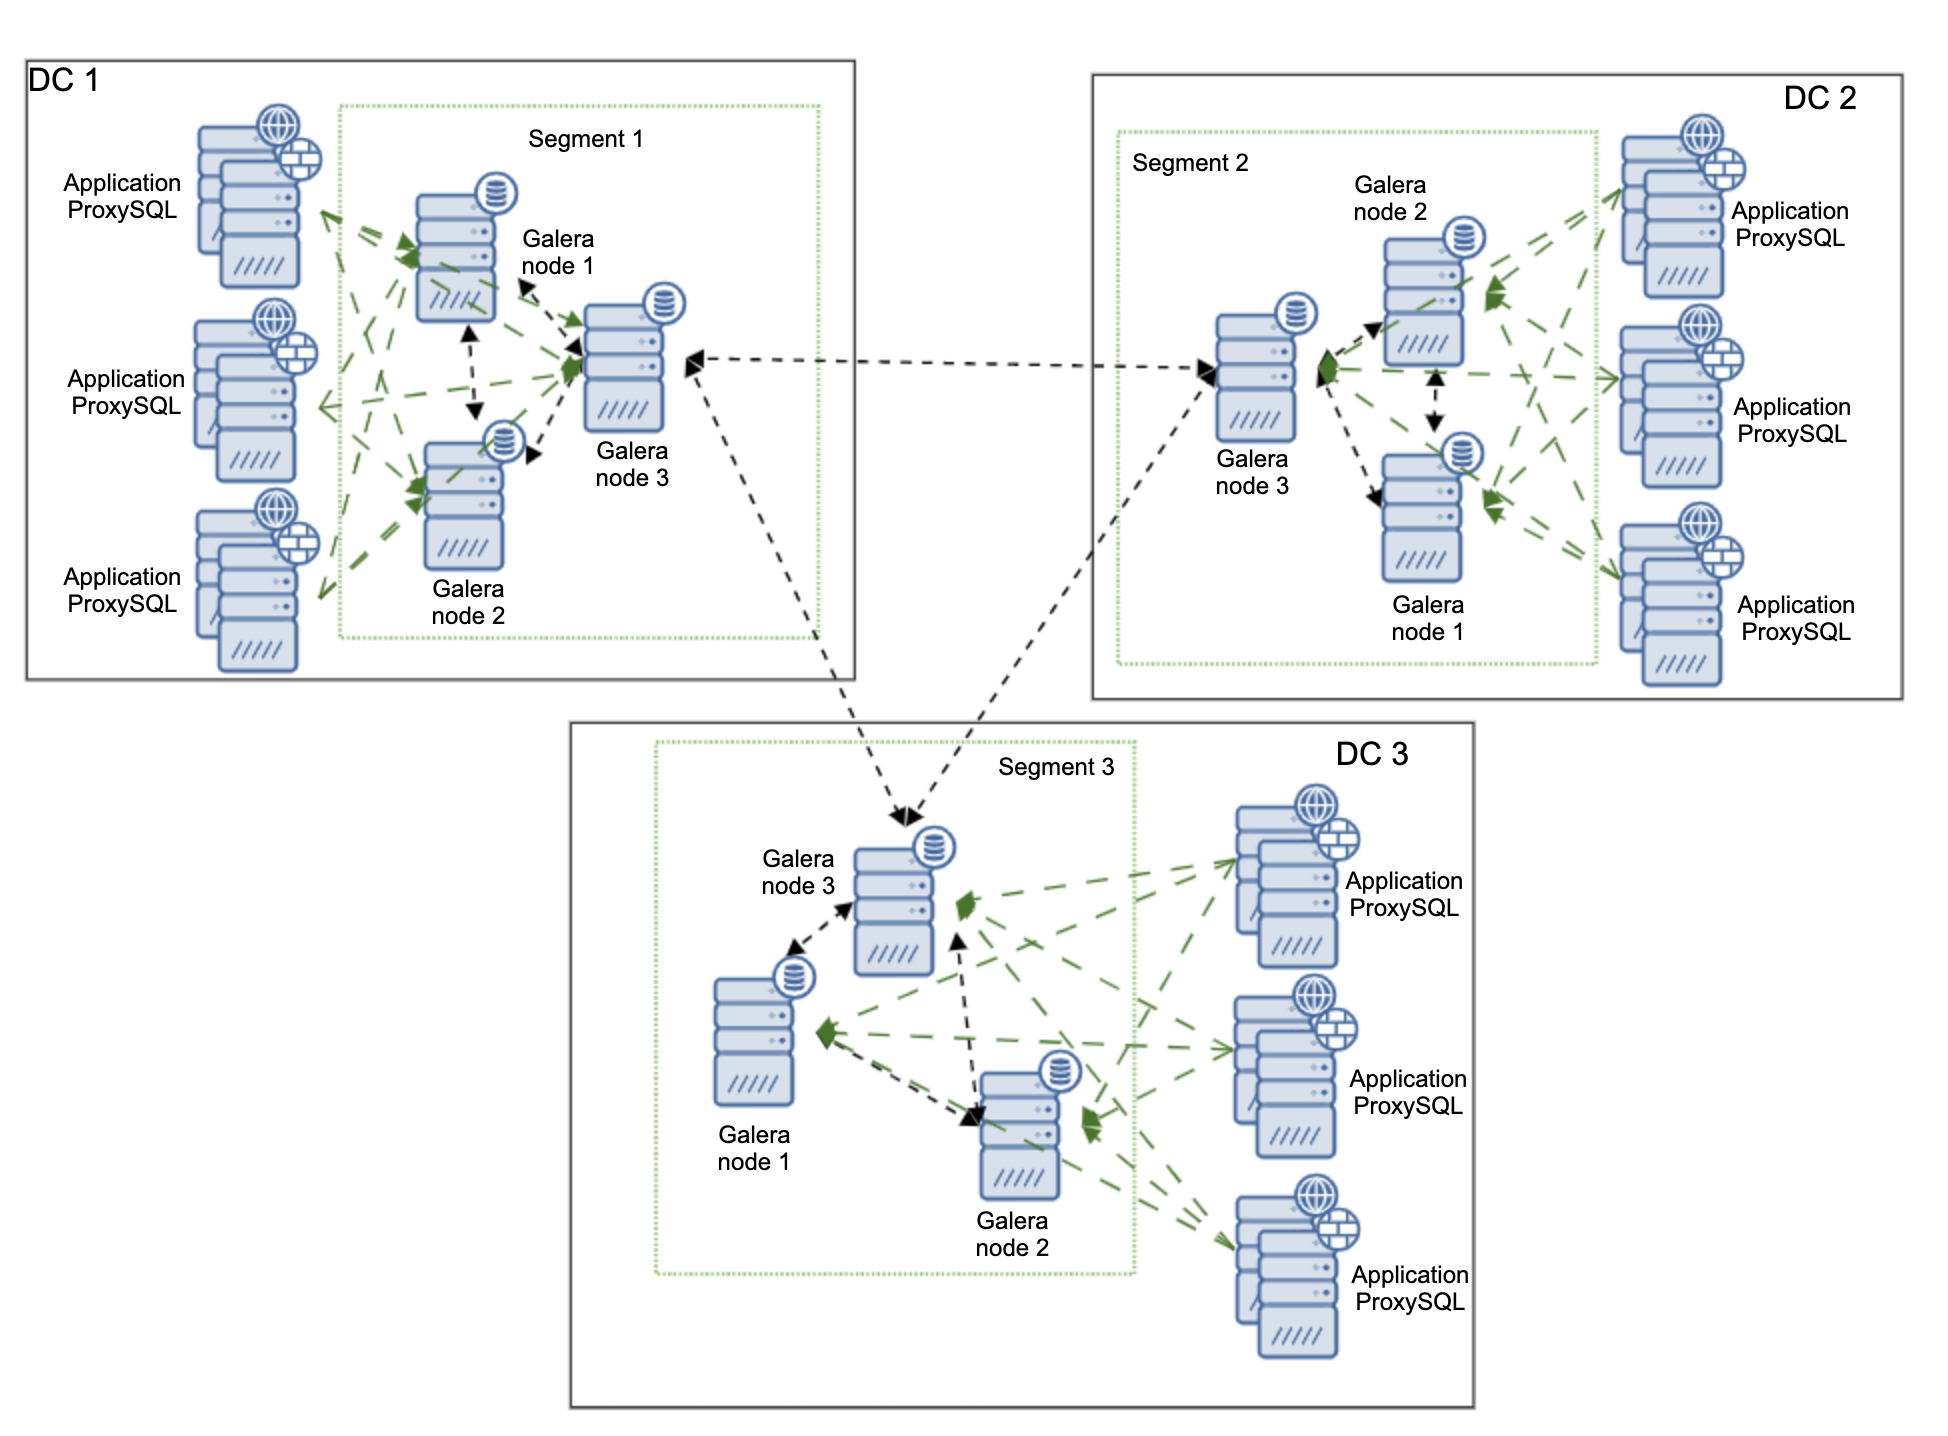
One of the primary reasons for using a Galera node cluster is for high-availability, redundancy, and for its ability to scale. If you are serving traffic globally, it's best that you cater your traffic by region. You should ensure your architectural design includes geo-distribution of your database nodes. In order to achieve this, multi-AZ, multi-region, or multi-cloud/multi-datacenter deployments are recommended. This prevents the cluster from going down as well as a malfunction due to lack of quorum. 

As mentioned earlier, Microsoft Azure has an auto scaling solution which can be leveraged using scale sets. This allows you to autoscale a node when a certain threshold has been met (based on what you are monitoring). This depends on which health status items you are monitoring before it then vertically scales. You can check out their tutorial on this topic here.

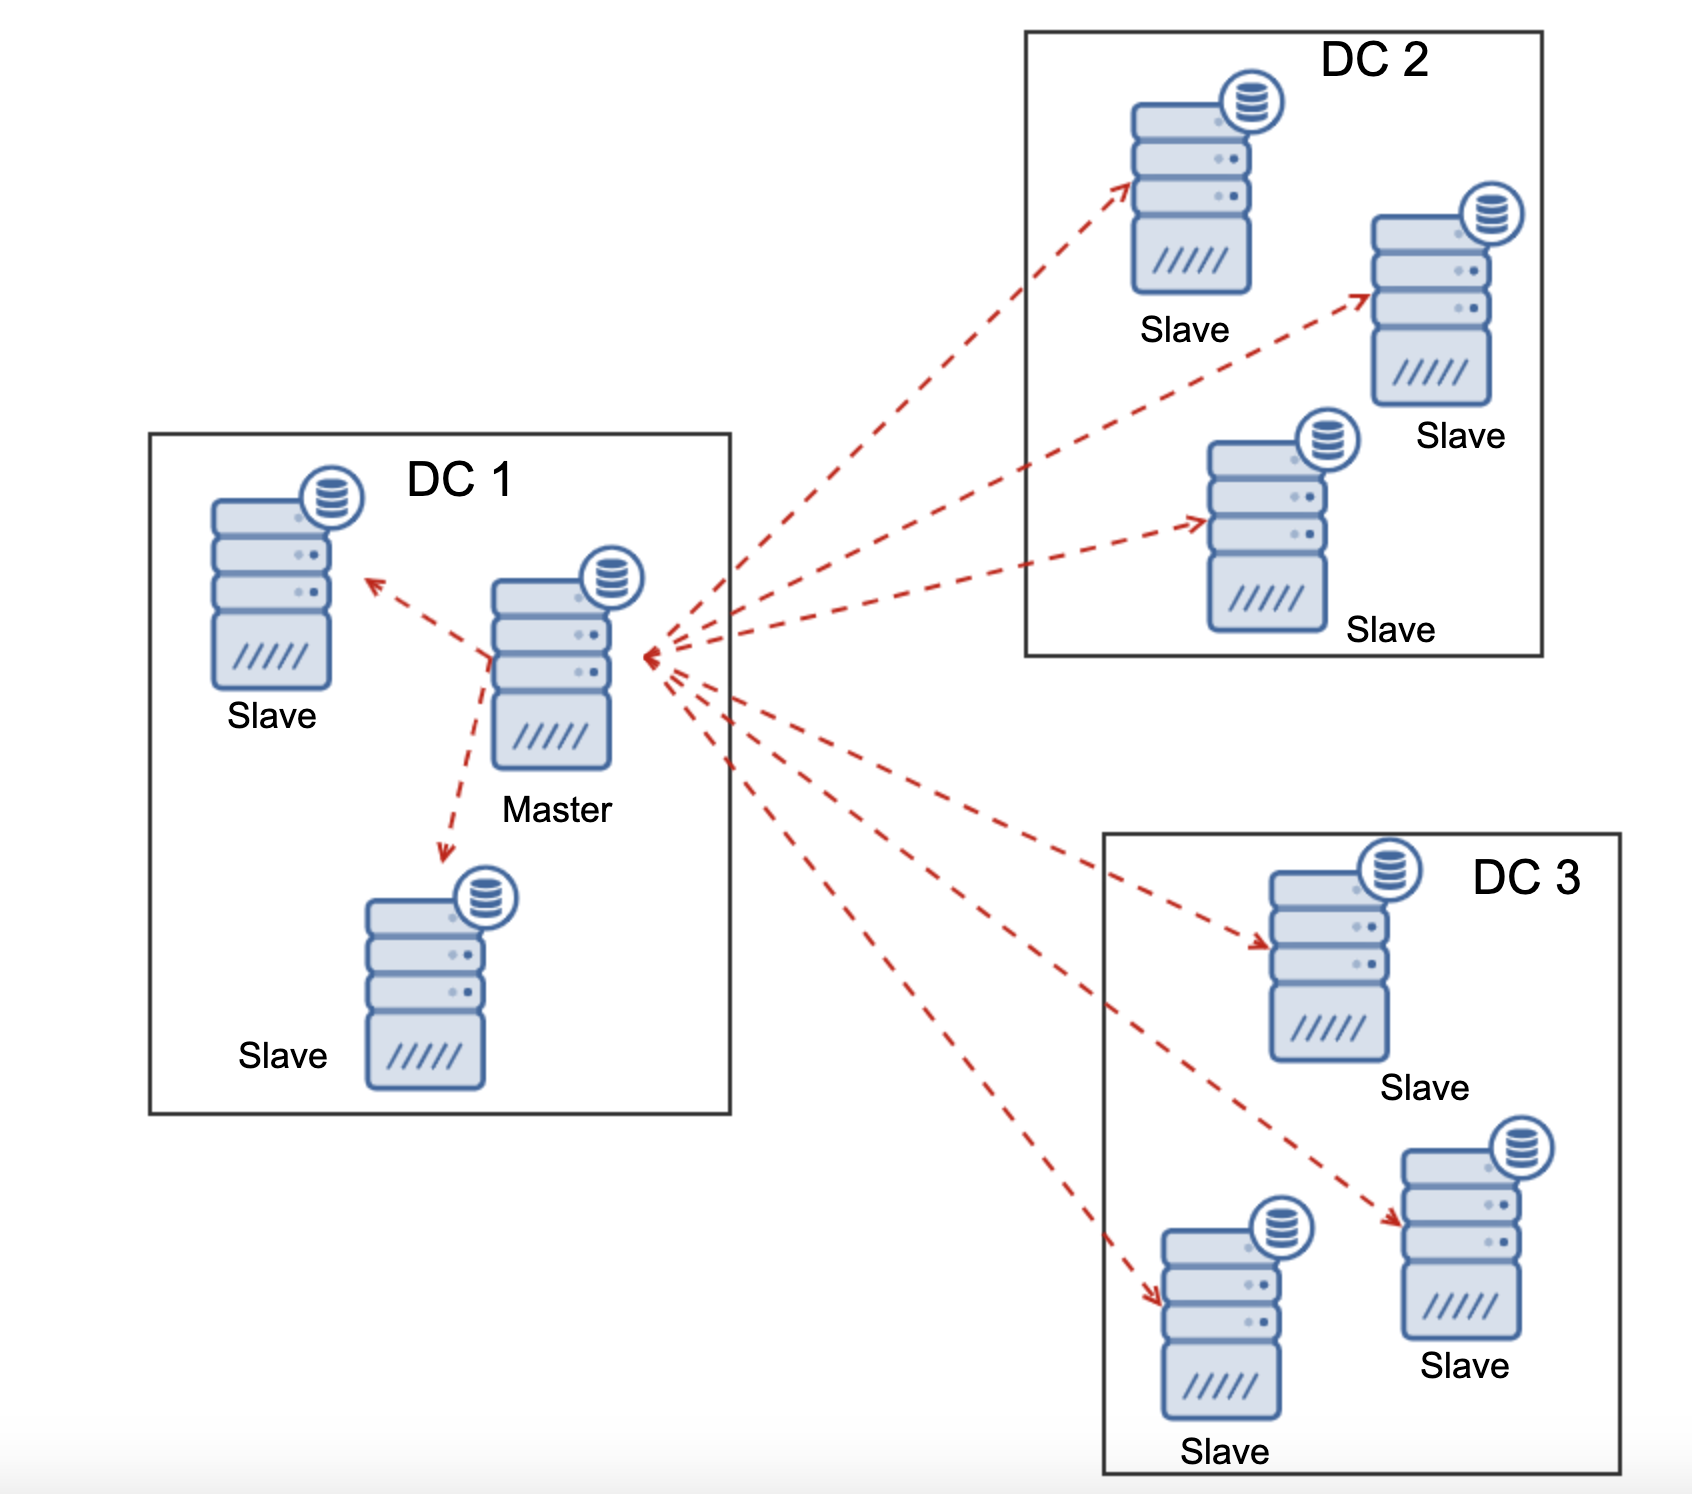
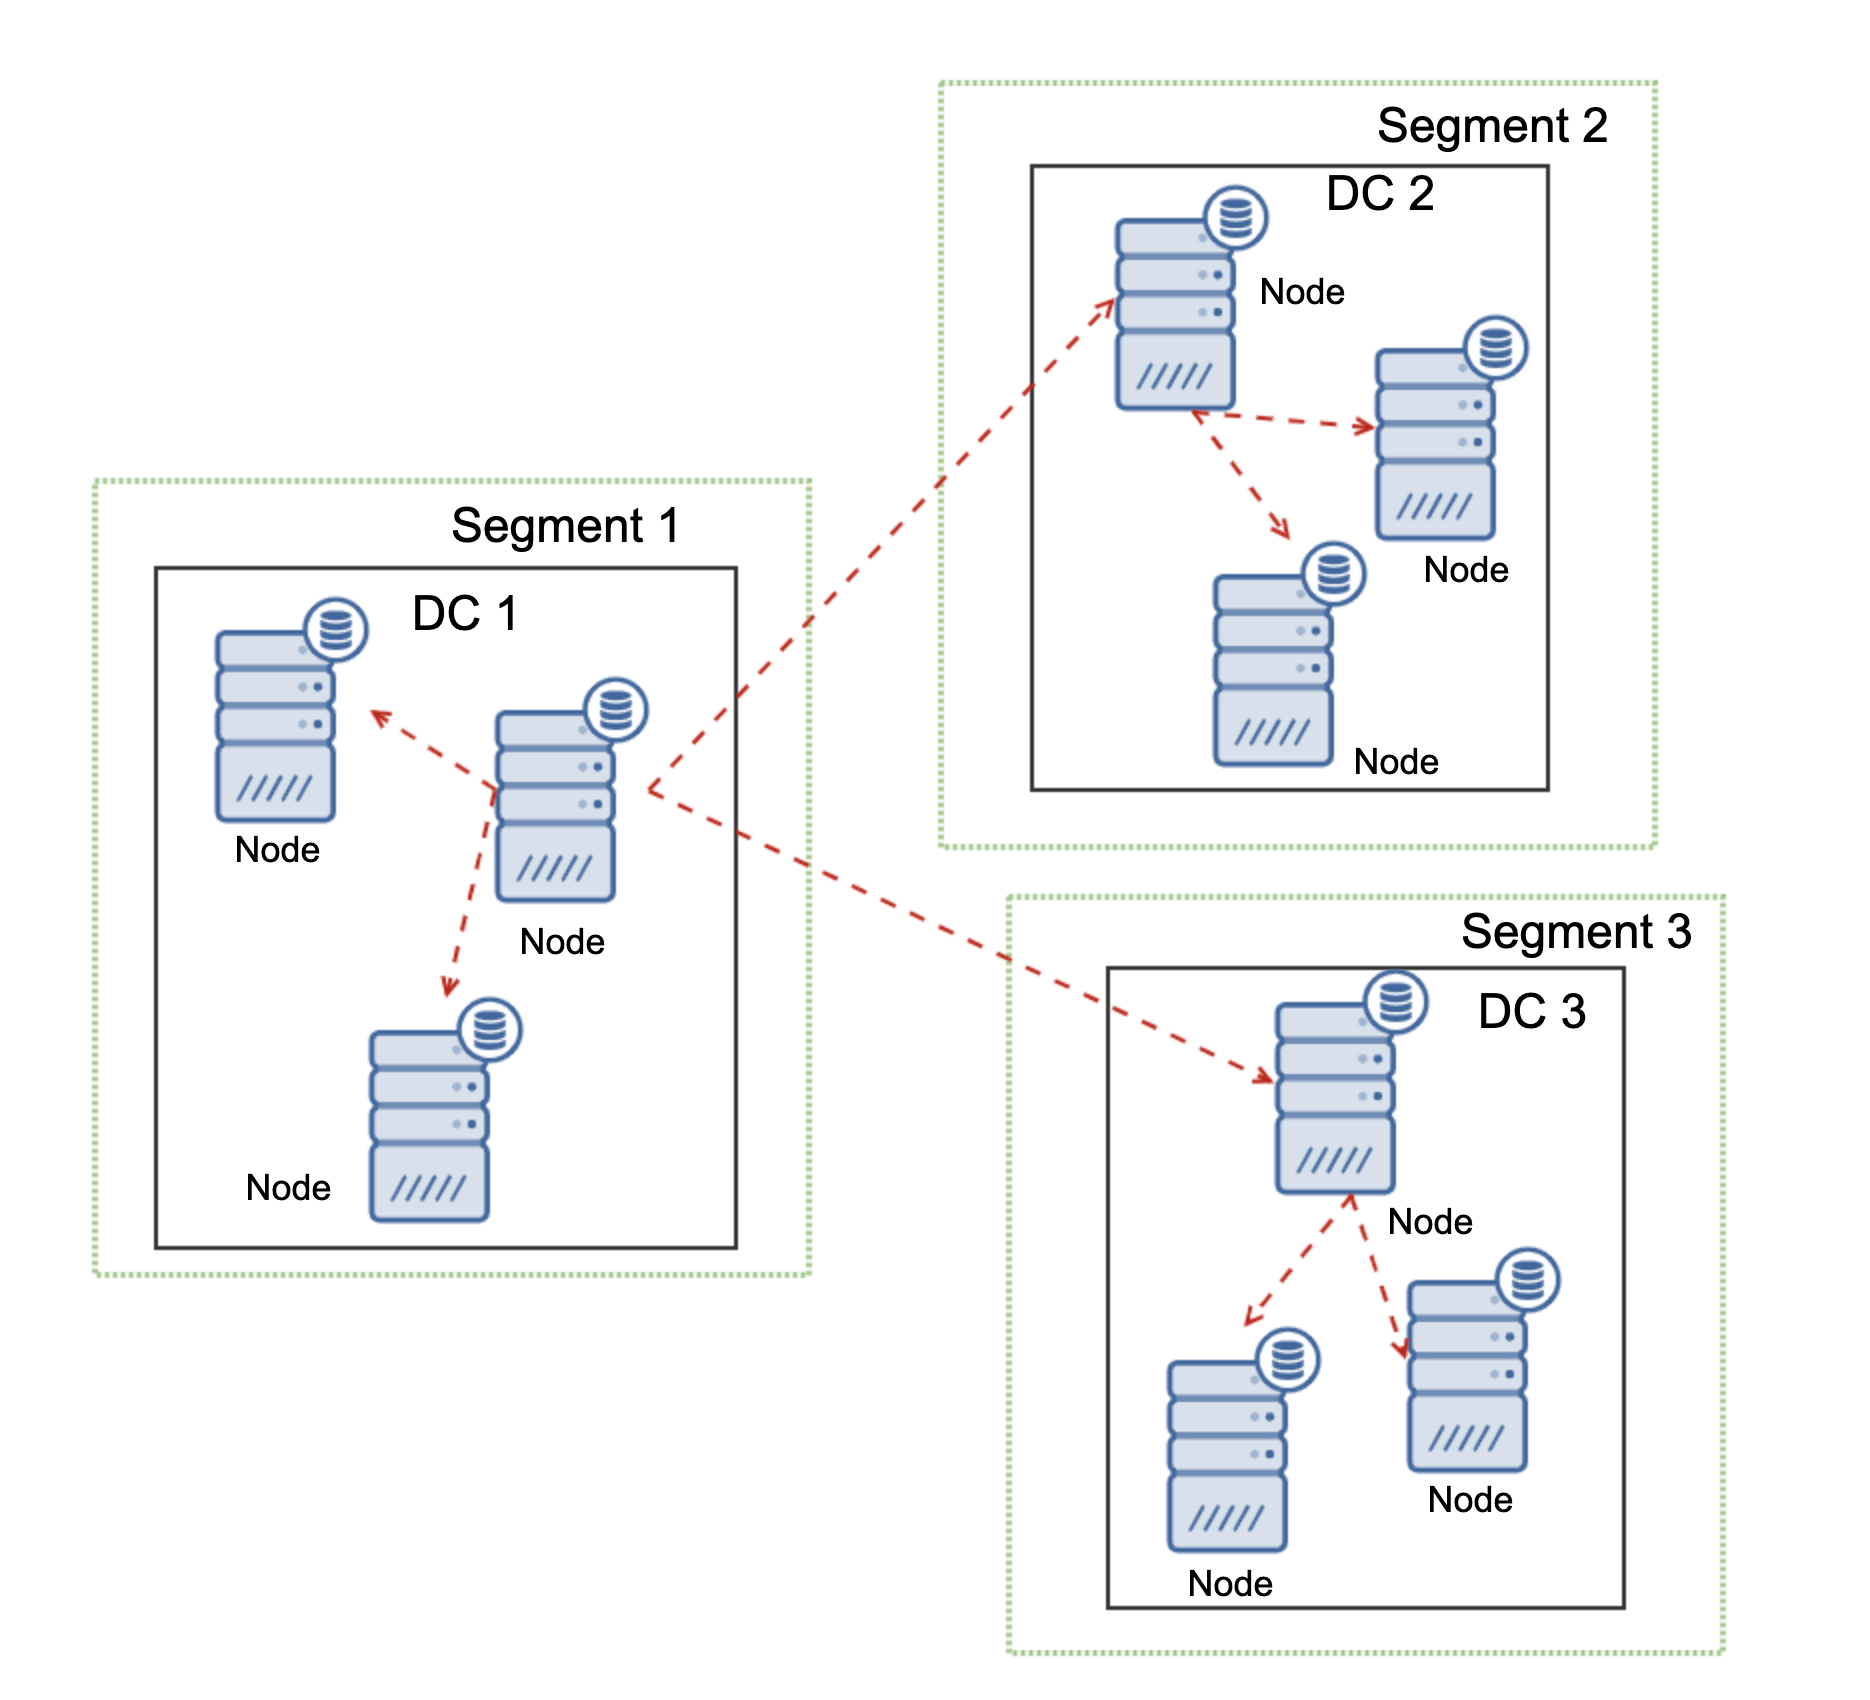
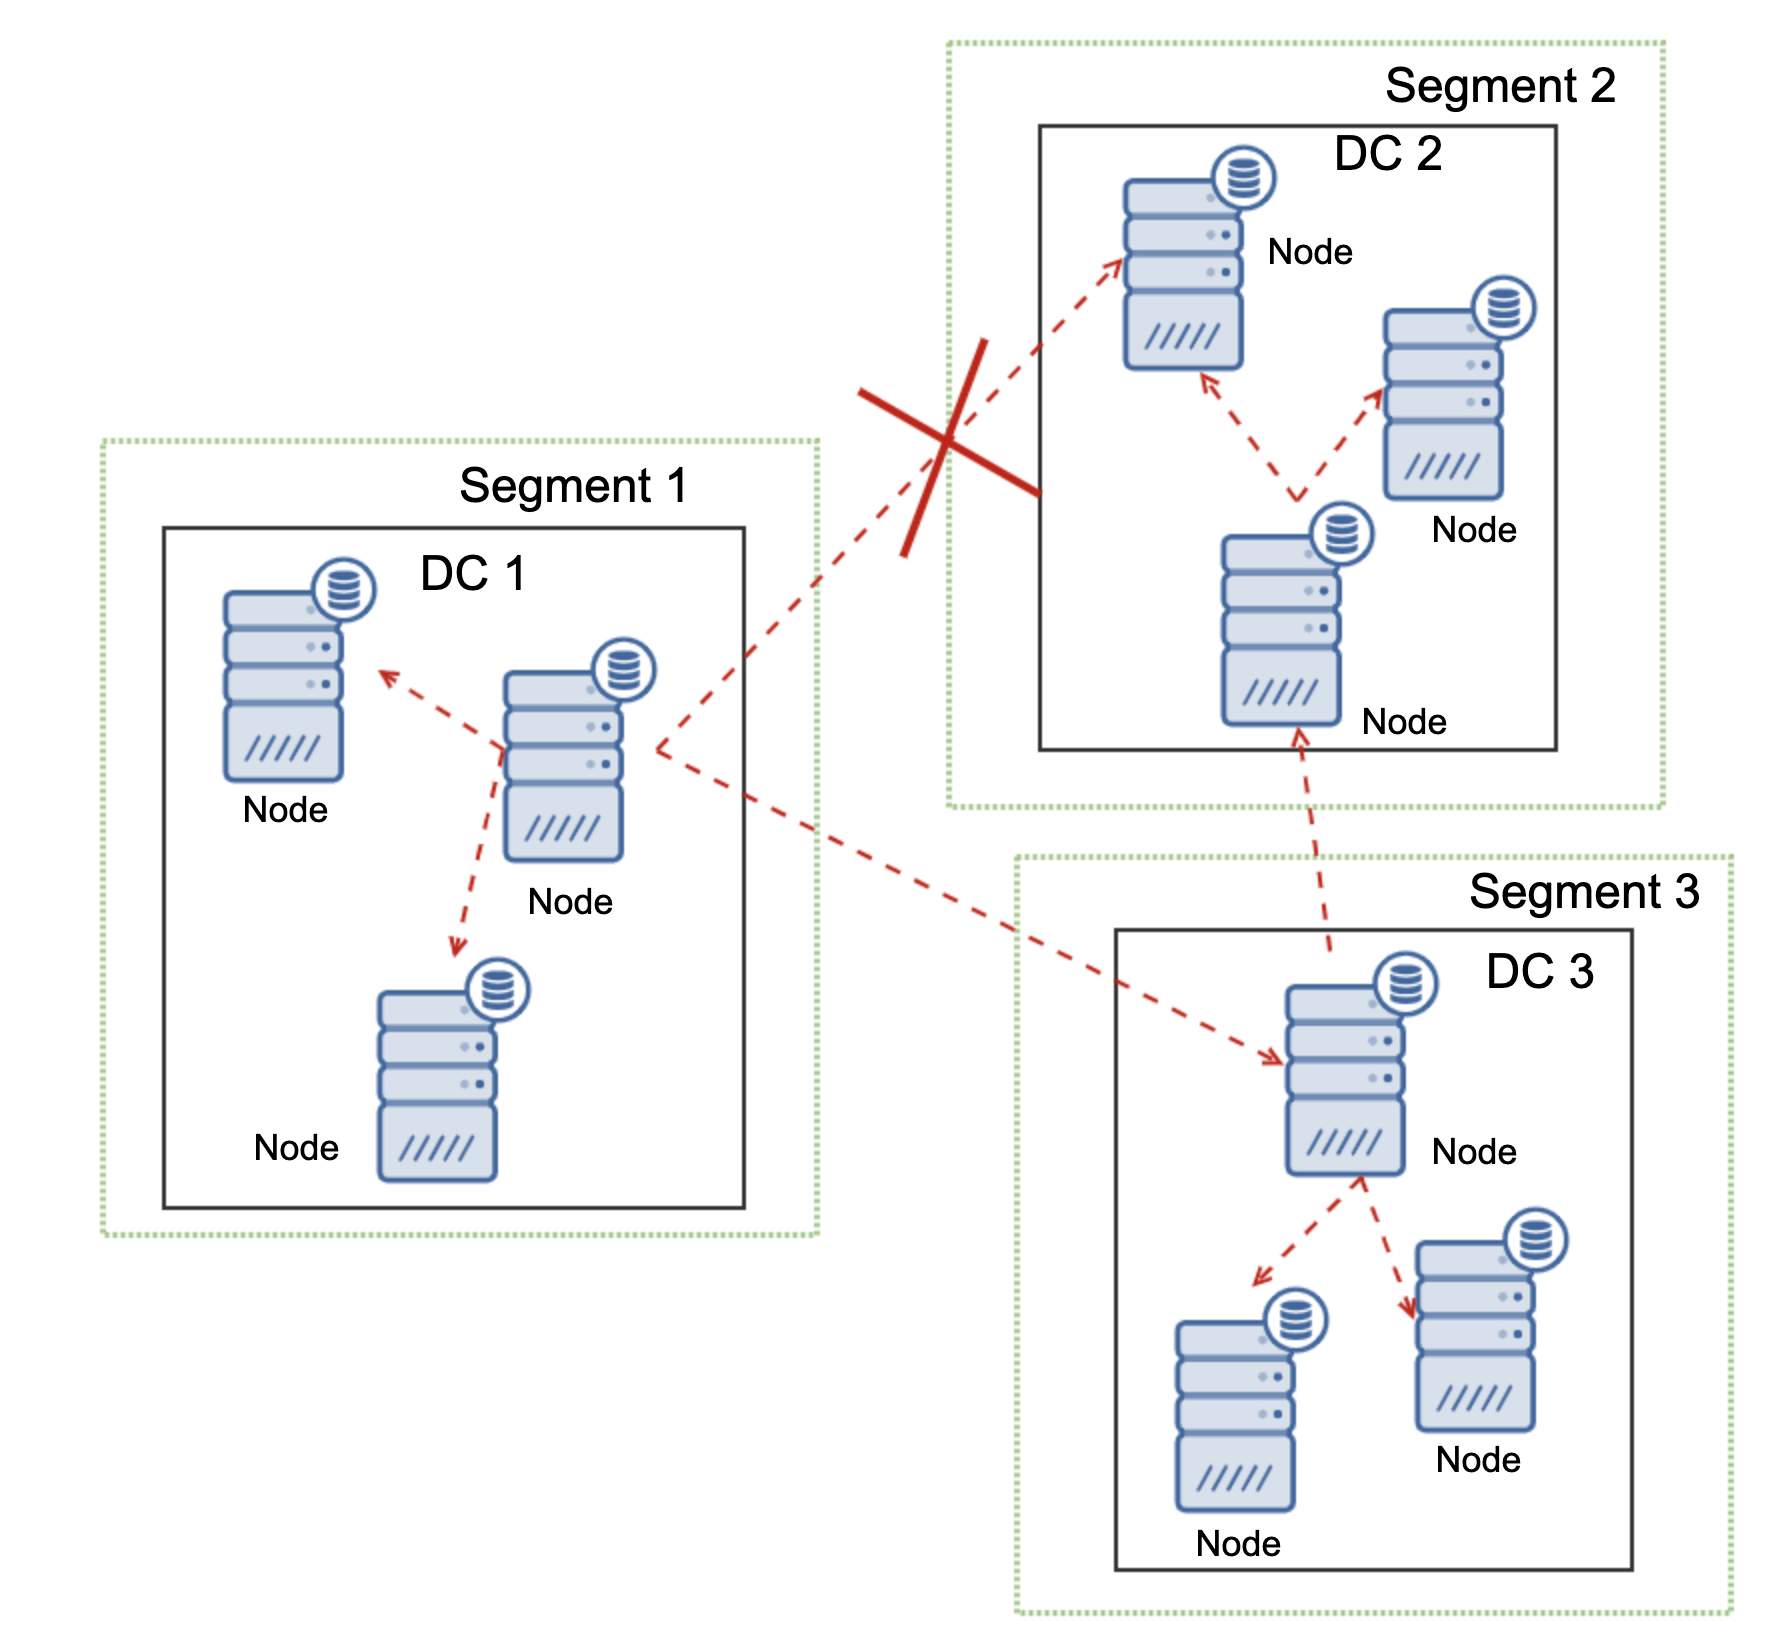
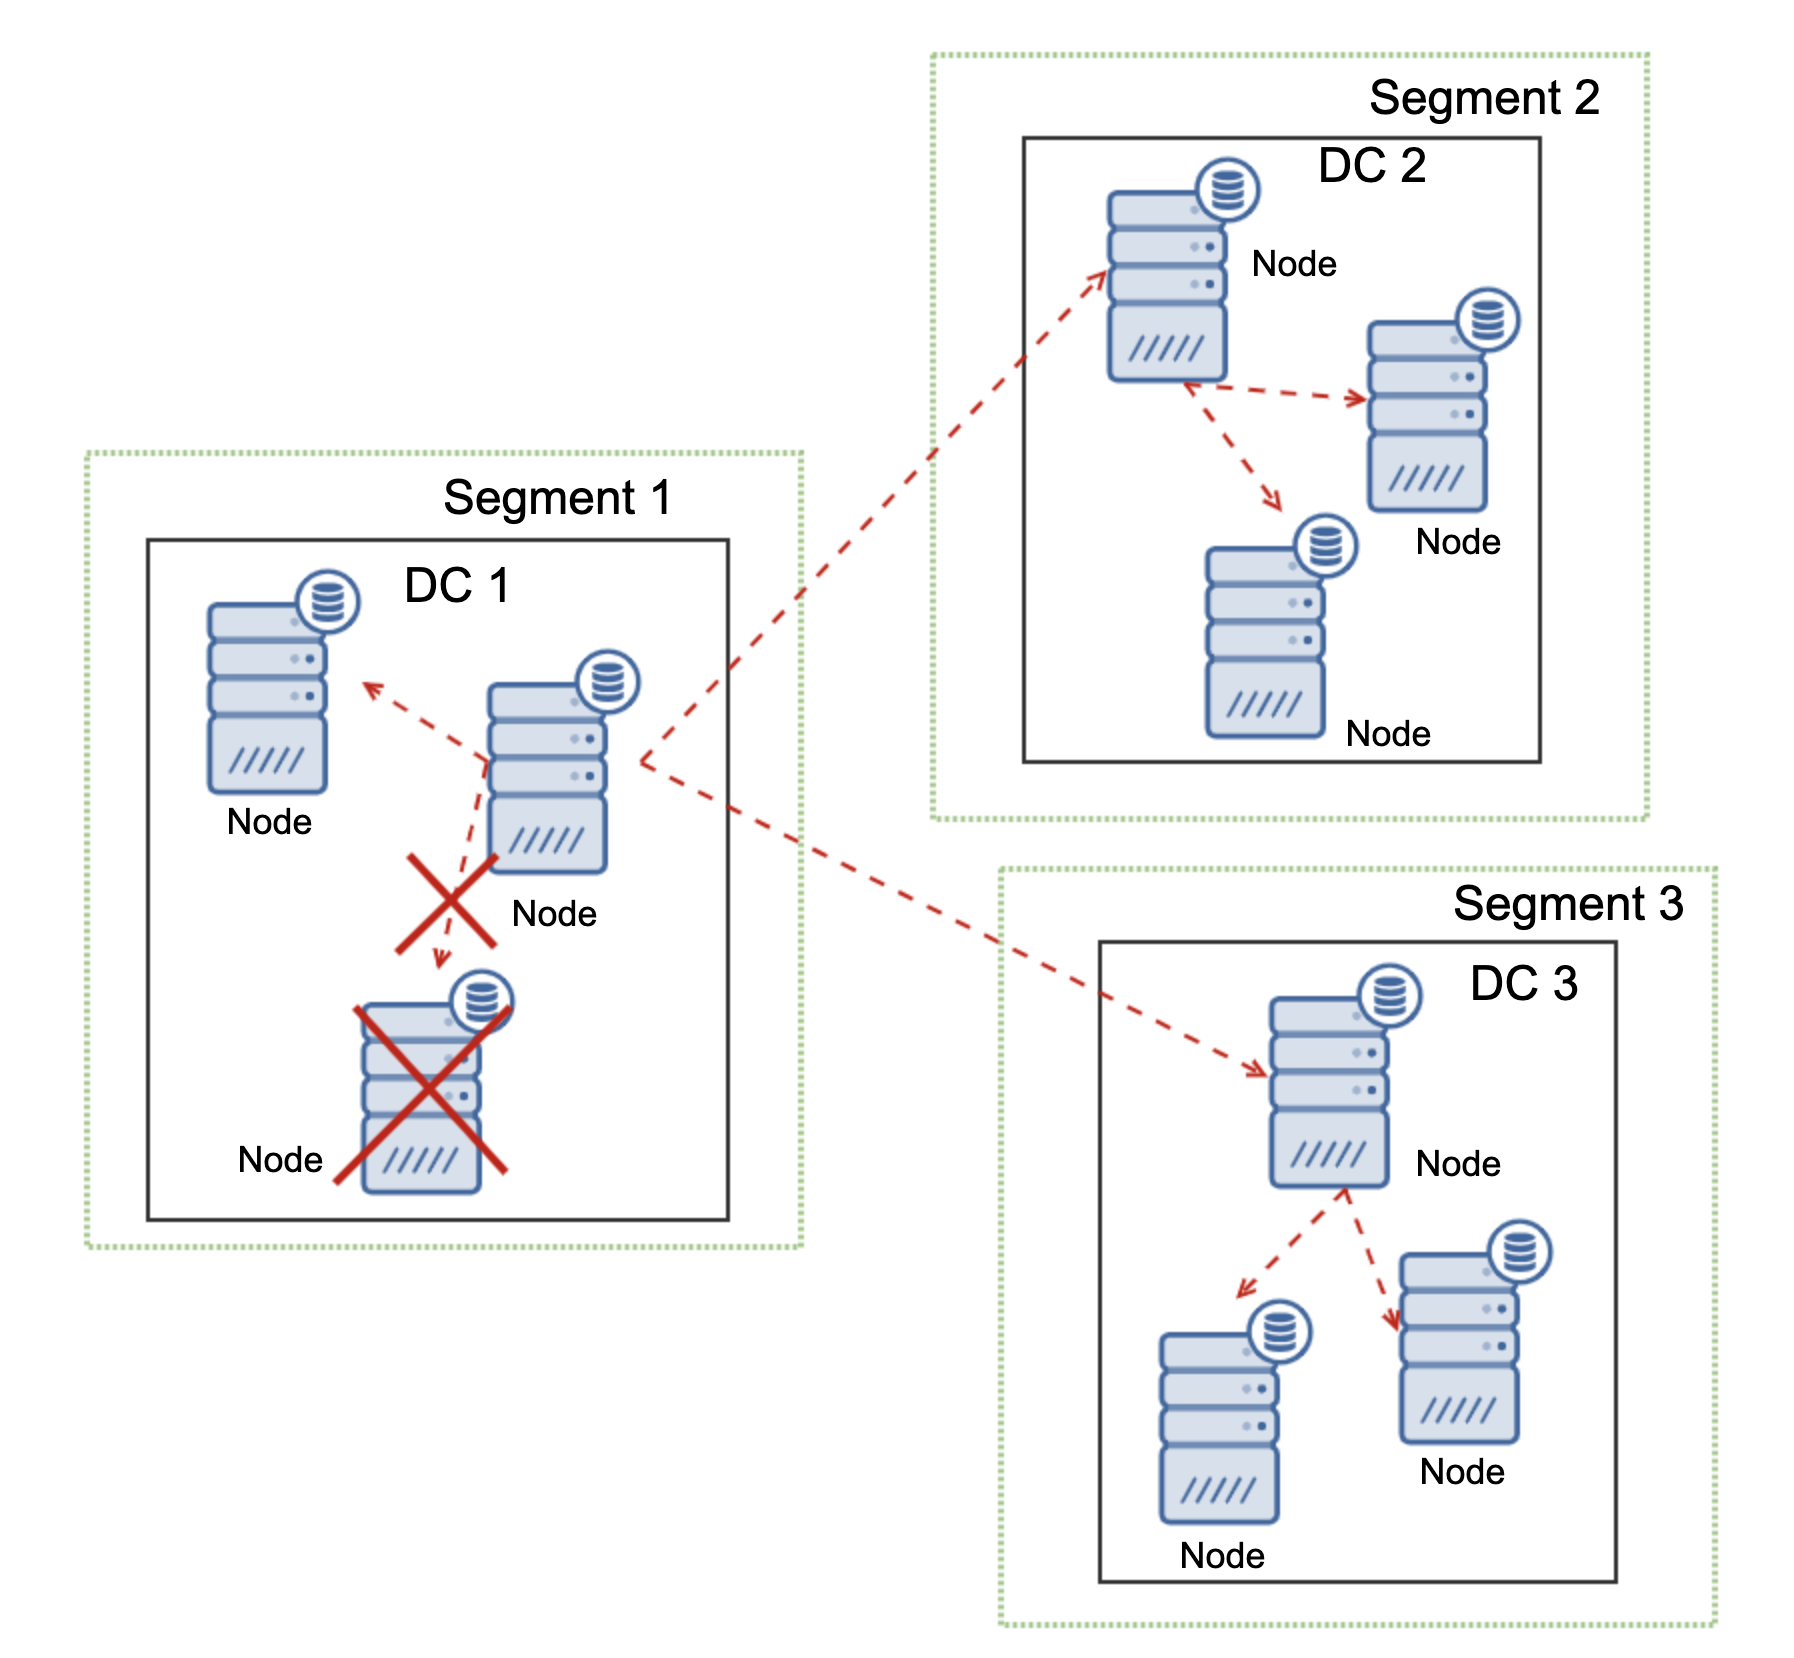
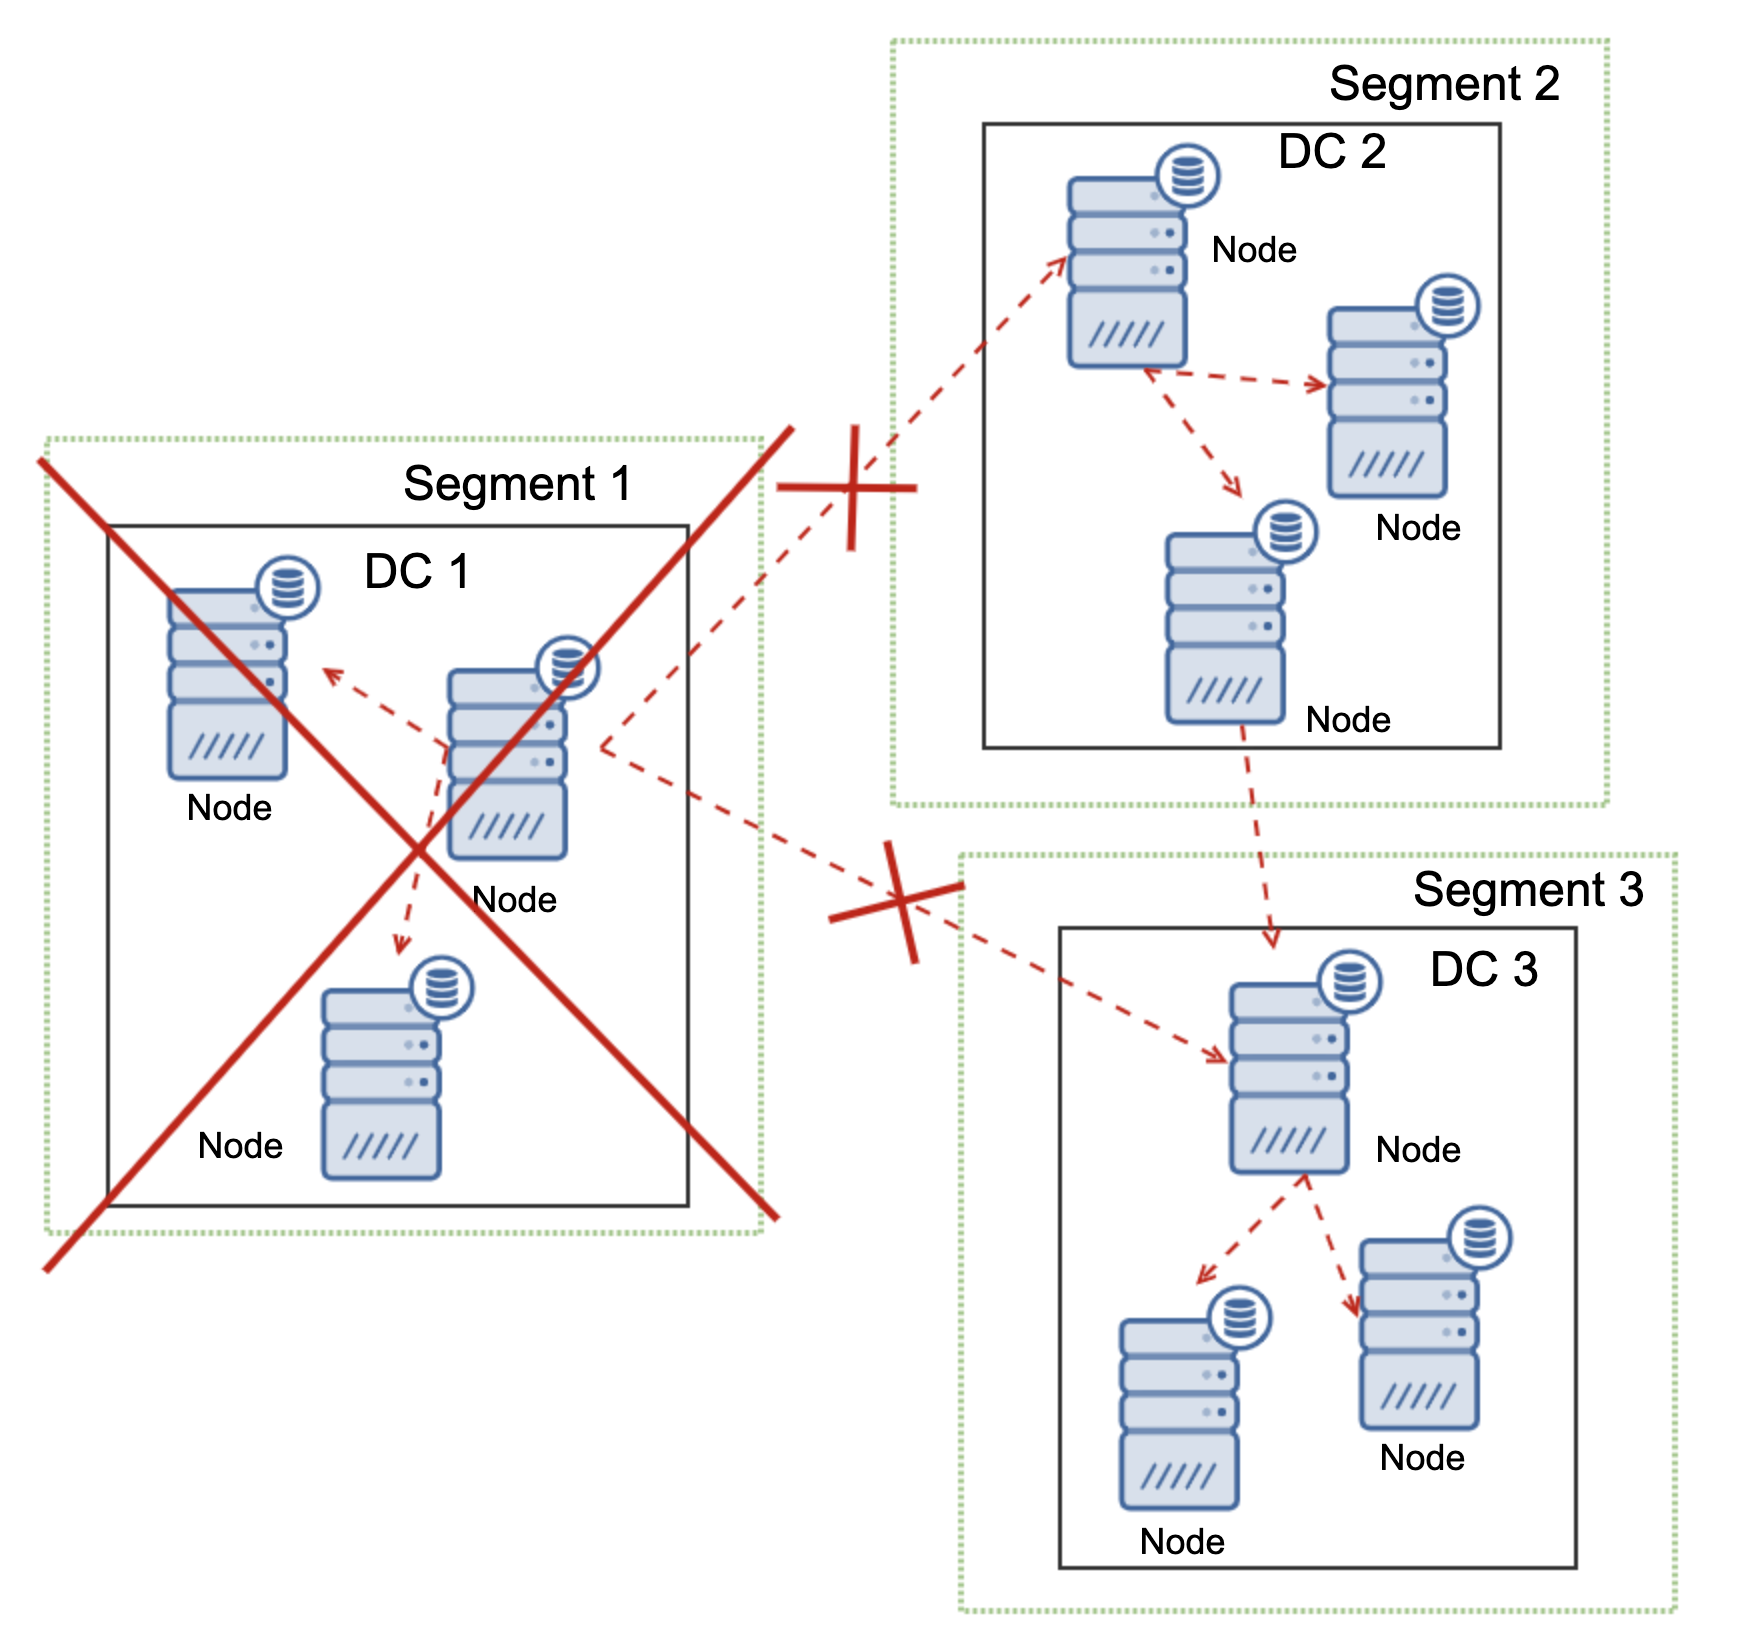
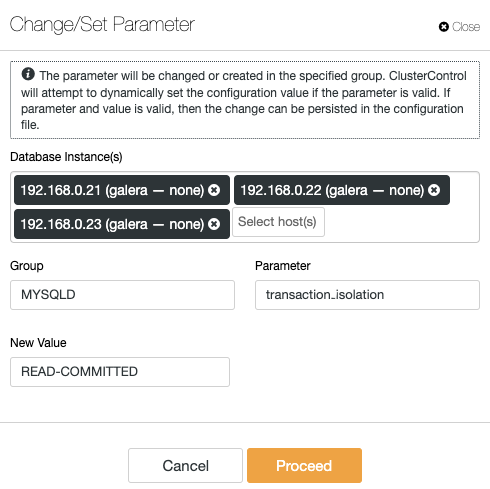
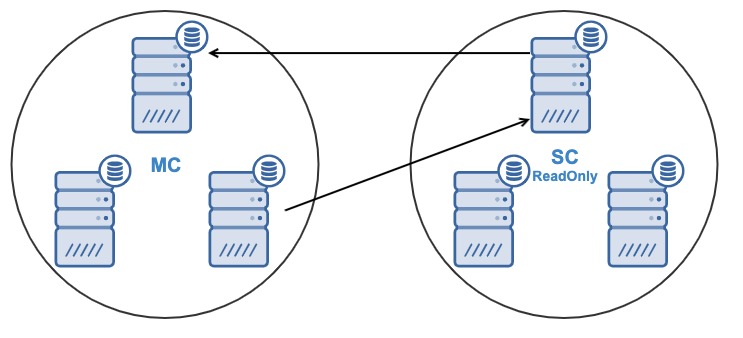
For multi-region or multi-cloud deployments, Galera has its own parameter called gmcast.segment for which can be set upon server start. This parameter is designed to optimize the communication between the Galera nodes and minimize the amount of traffic sent between network segments. This includes writeset relaying and IST and SST donor selection. This type of setup allows you to deploy multiple nodes in different regions. Aside from that, you can also deploy your Galera nodes on a different cloud vendors routing from GCP, AWS, Microsoft Azure, or within an on-premise setup. 

We recommend you to check out our blog Multiple Data Center Setups Using Galera Cluster for MySQL or MariaDB and Zero Downtime Network Migration With MySQL Galera Cluster Using Relay Node to gather more information on how to implement these types of deployments.

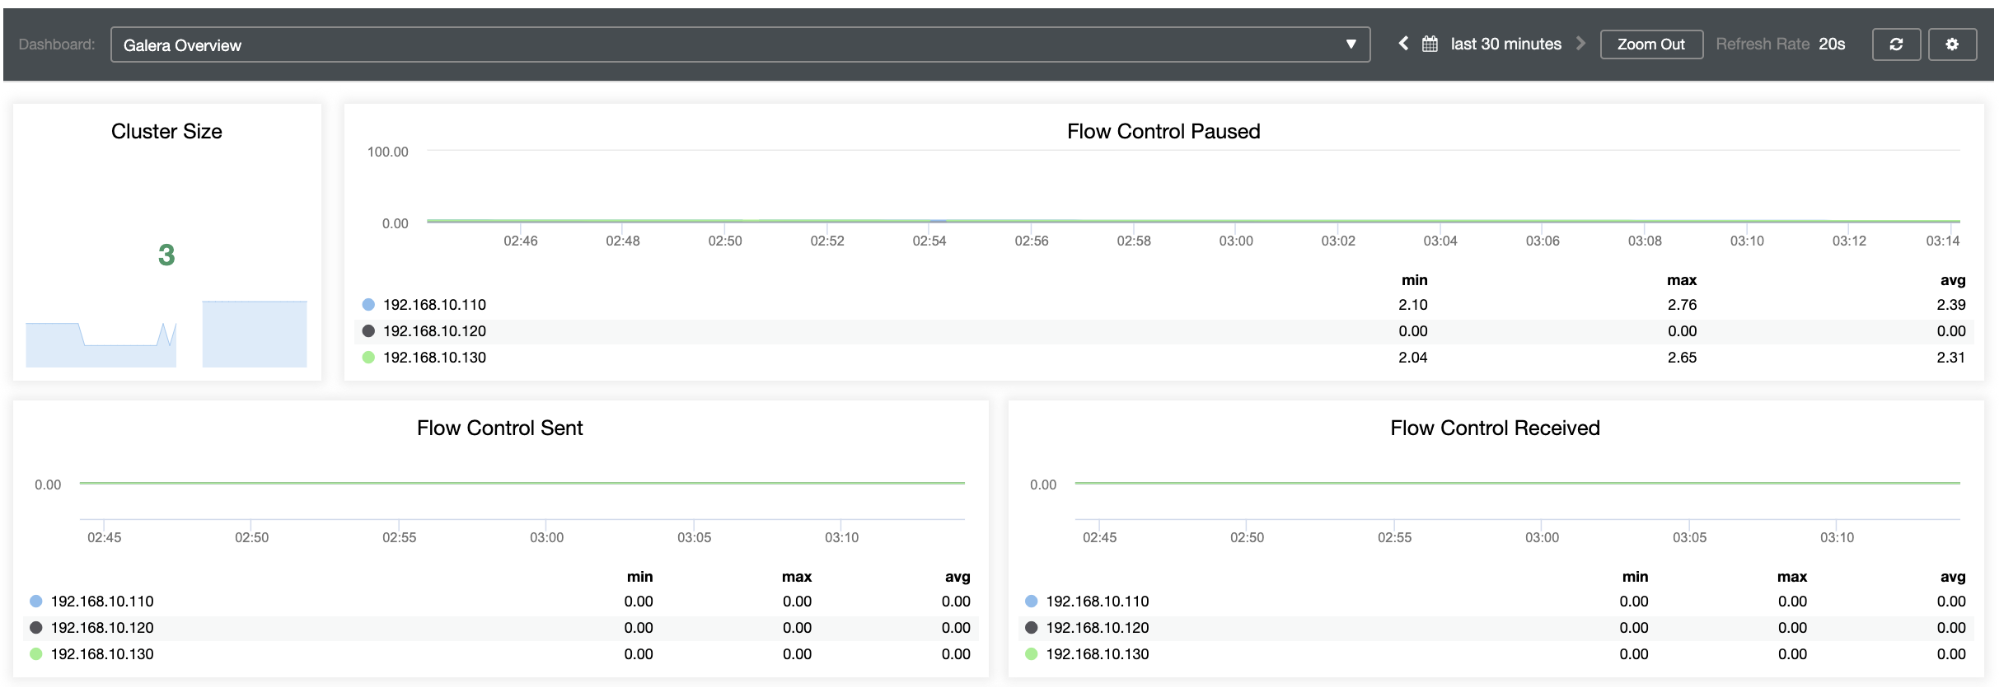
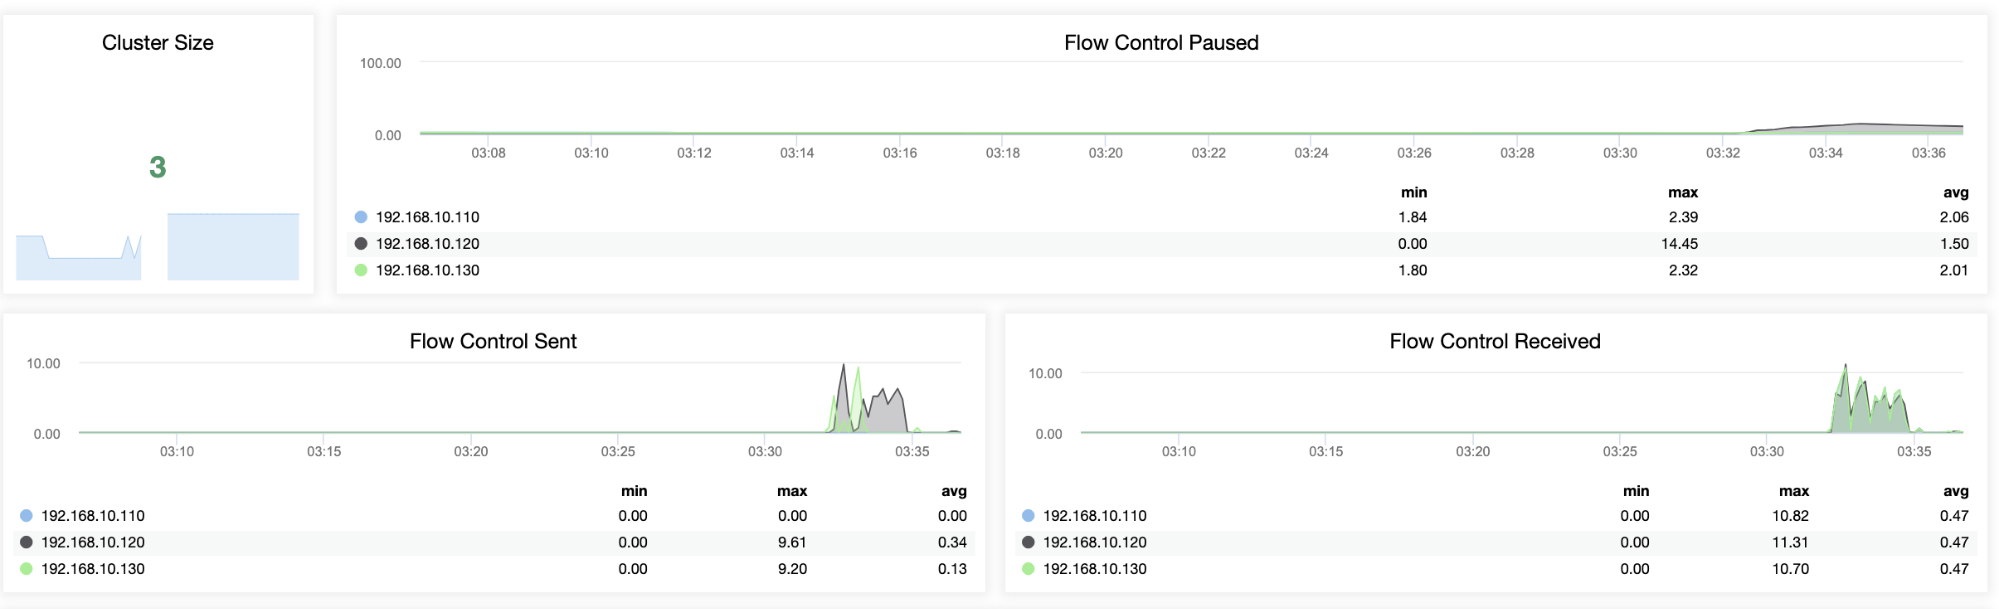
Galera Cluster Database Performance on Microsoft Azure

The underlying host machines used by virtual machines in Azure are, in fact, very powerful. The newest VM's in Azure have already been equipped with network optimization modules. You can check this in your kernel info by running (e.g. in Ubuntu).

uname -r|grep azure

Note: Make certain that your command has the "azure" string on it. 

For Centos/RHEL, installing any Linux Integration Services (LIS) since version 4.2 contains network optimization. To learn more about this, visit the page on optimizing network throughput.

If your application is very sensitive to network latency, you might be interested in looking at the proximity placement group. It's currently in preview (and not yet recommended for production use) but this helps optimize your network throughput. 

For the type of virtual machine you would consume, then this would depend on the requirement of your application traffic and resource demands. For queries that are high on memory consumption, you can start with Dv3. However, for memory-optimized, then start with the Ev3 series. For High CPU requirements, such as high-transactional database or gaming applications, then start with Fsv2 series.

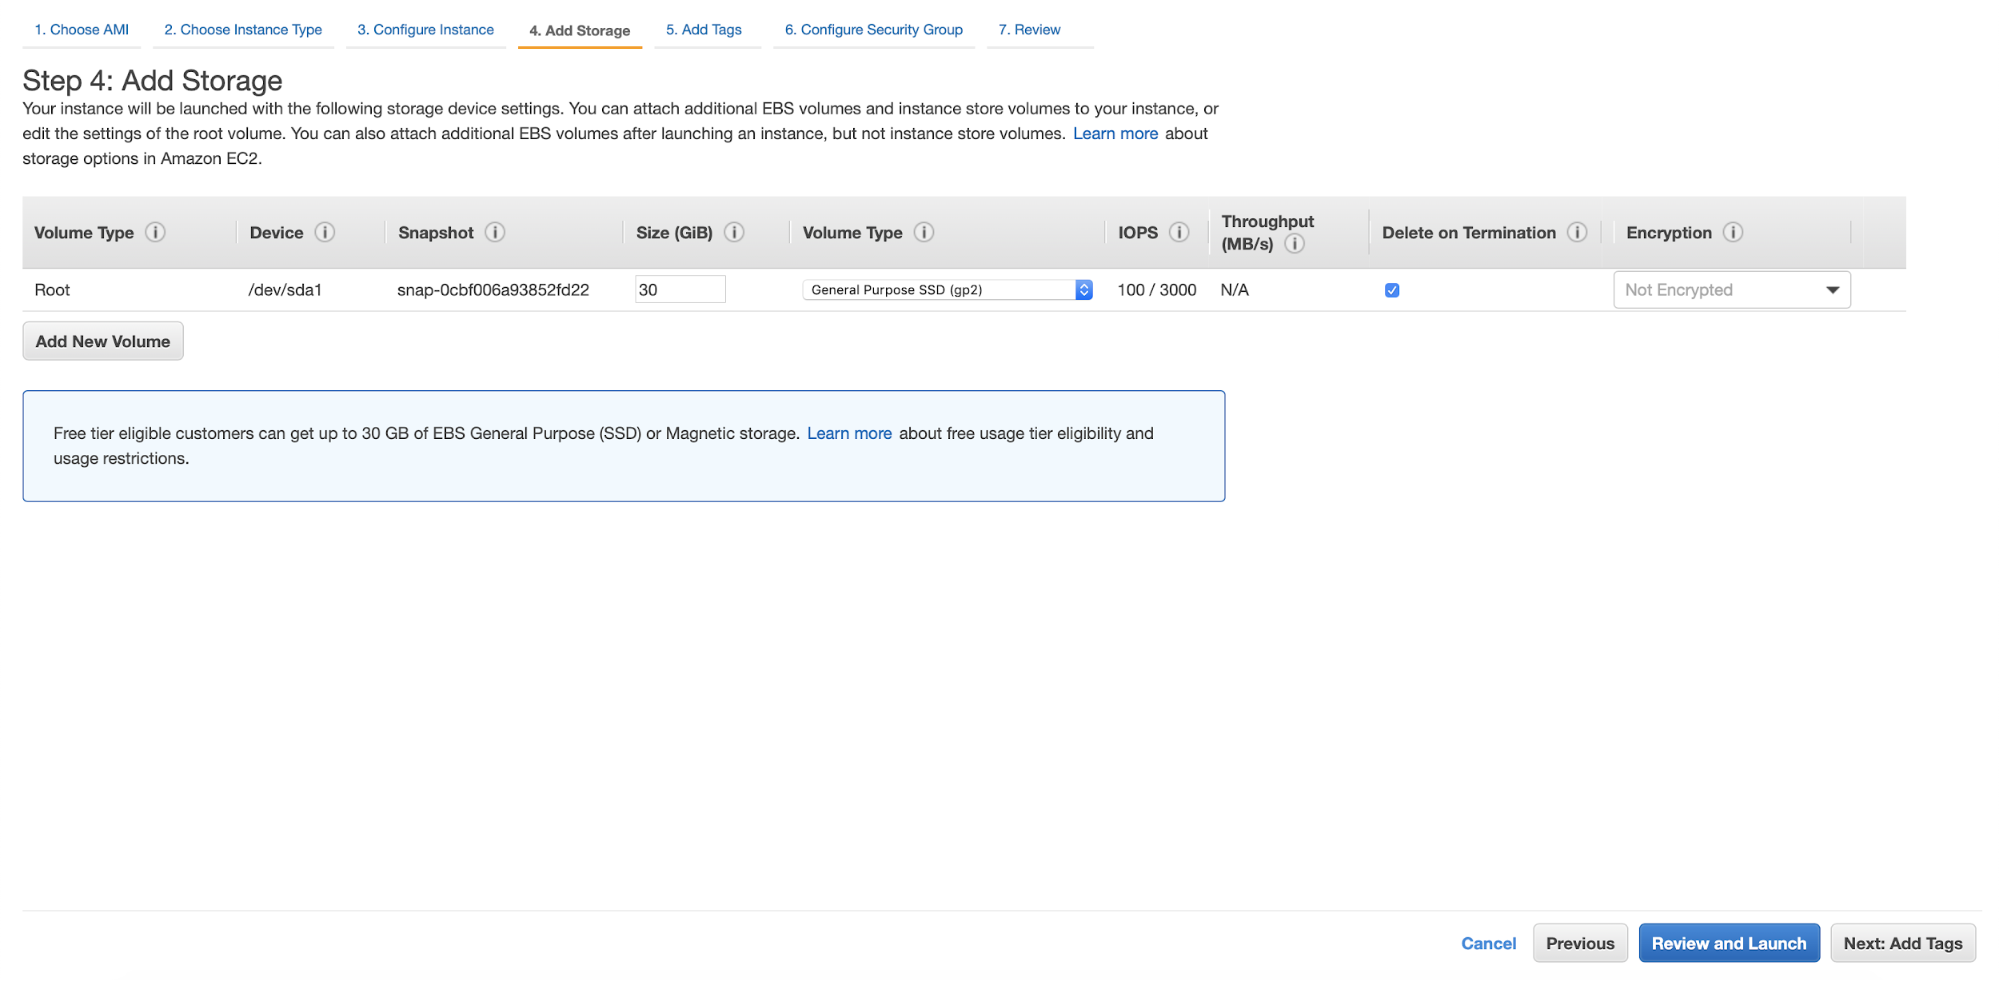
Choosing the right storage and required IOPS for your database volume is a must. Generally, a SSD-based persistent disk is your ideal choice. Begin with Standard SSD which is cost-effective and offers consistent performance. This decision, however, might depend on if you need more IOPS in the long run. If this is the case, then you should go for Premium SSD storage.

We also recommend you to check and read our blog How to Improve Performance of Galera Cluster for MySQL or MariaDB to learn more about optimizing your Galera Cluster.

Database Backup for Galera Nodes on Azure

There's no existing naitve backup support for your MySQL Galera data in Azure, but you can take a snapshot. Microsoft Azure offers Azure VM Backup which takes a snapshot which can be scheduled and encrypted. 

Alternatively, if you want to backup the data files from your Galera Cluster, you can also use external services like ClusterControl, use Percona Xtrabackup for your binary backup, or use mysqldump or mydumper for your logical backups. These tools provide backup copies for your mission-critical data and you can read this if you want to learn more.

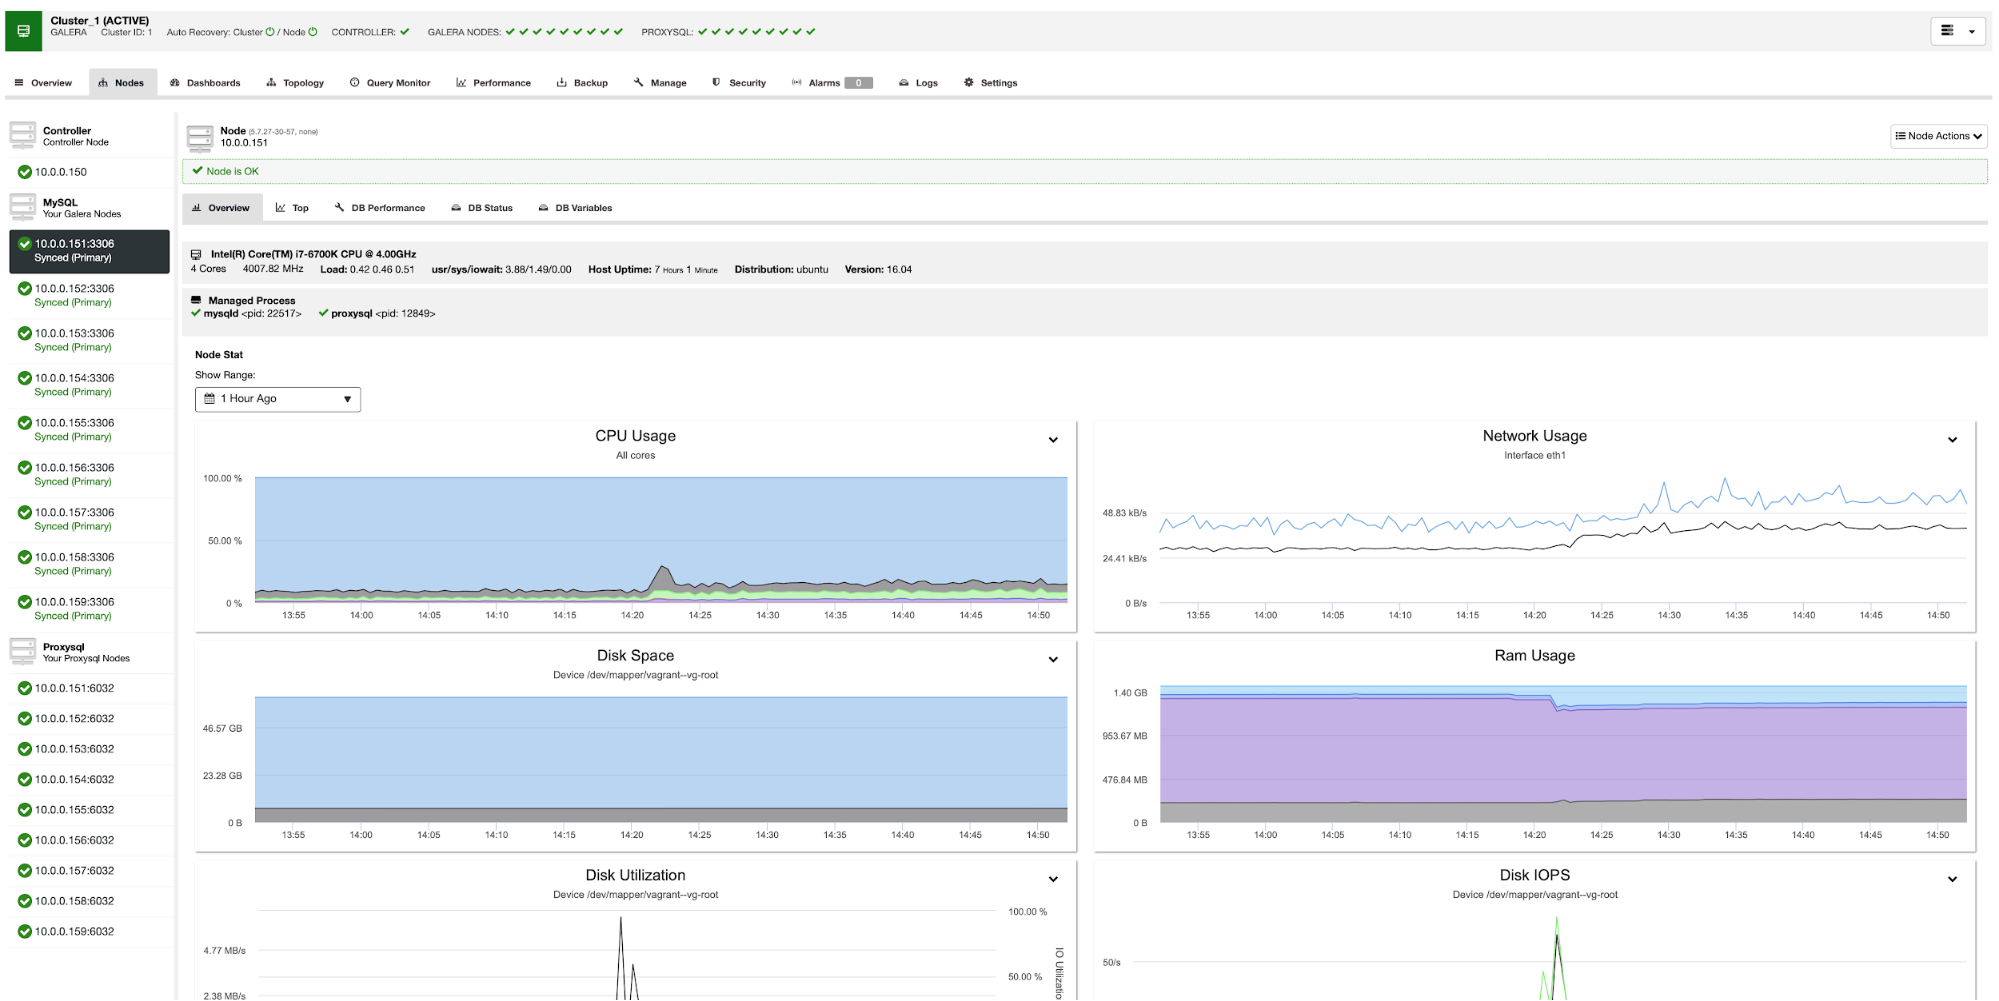
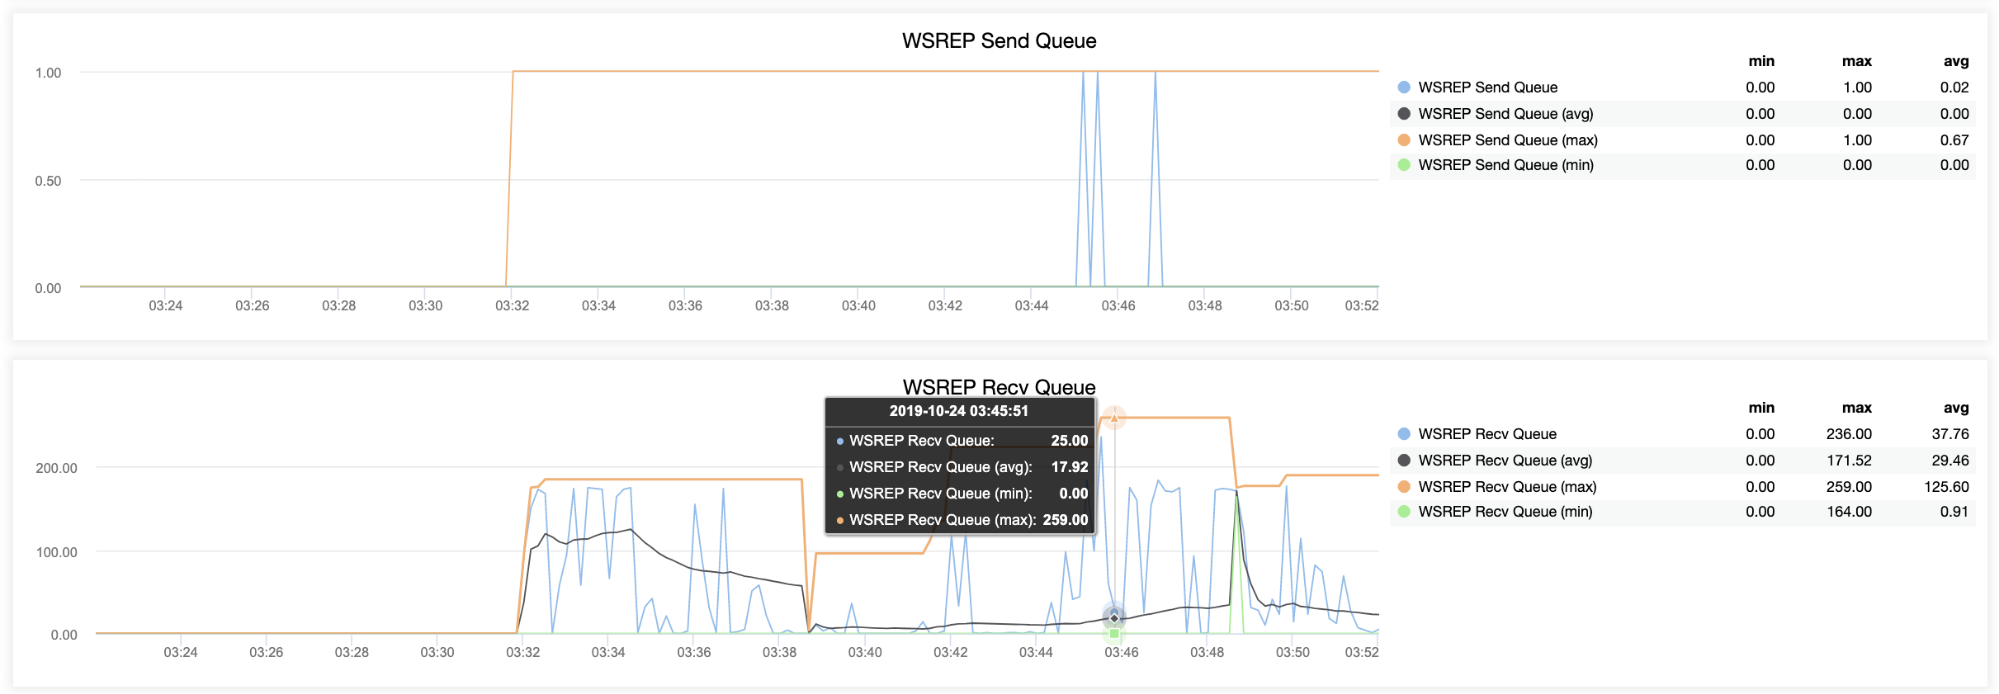
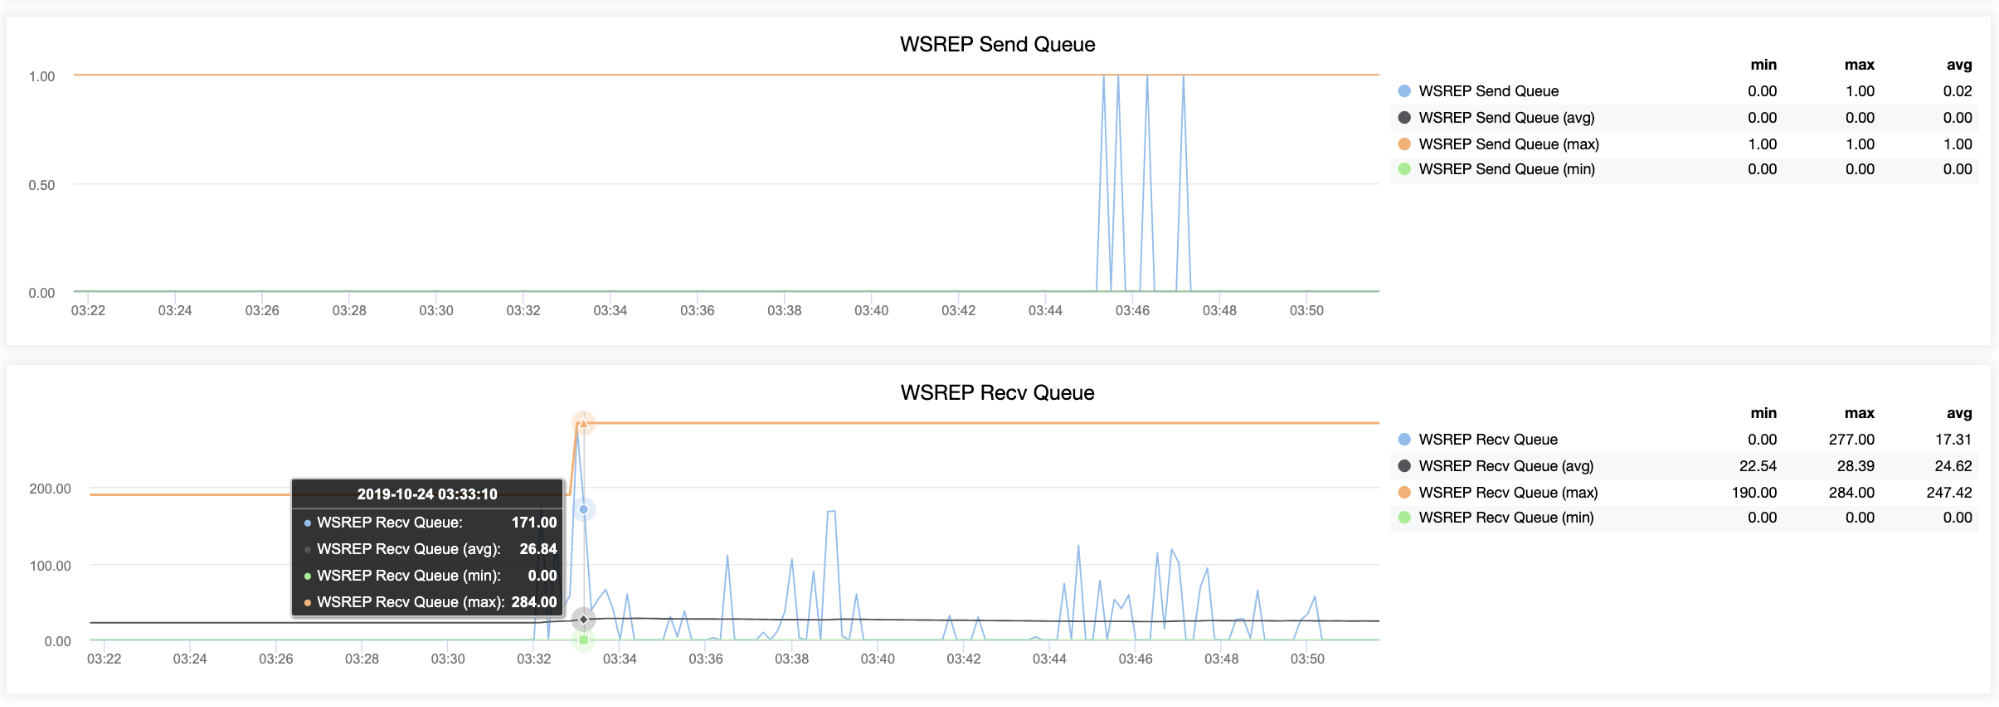
Galera Cluster Monitoring on Azure

Microsoft Azure has its monitoring service named Azure Monitor. Azure Monitor maximizes the availability and performance of your applications by delivering a comprehensive solution for collecting, analyzing, and acting on telemetry from your cloud and on-premise environments. It helps you understand how your applications are performing and proactively identifies issues affecting them (and the resources they depend on). You can setup or create health alerts, get notified on advisories and alerts detected in the services you deployed.

If you want monitoring specific to your database, then you will need to utilize external monitoring tools which have  advanced, highly-granular database metrics. There are several choices you can choose from such as PMM by Percona, DataDog, Idera, VividCortex, or our very own ClusterControl (Monitoring is FREE with ClusterControl Community.)

Galera Cluster Database Security on Azure

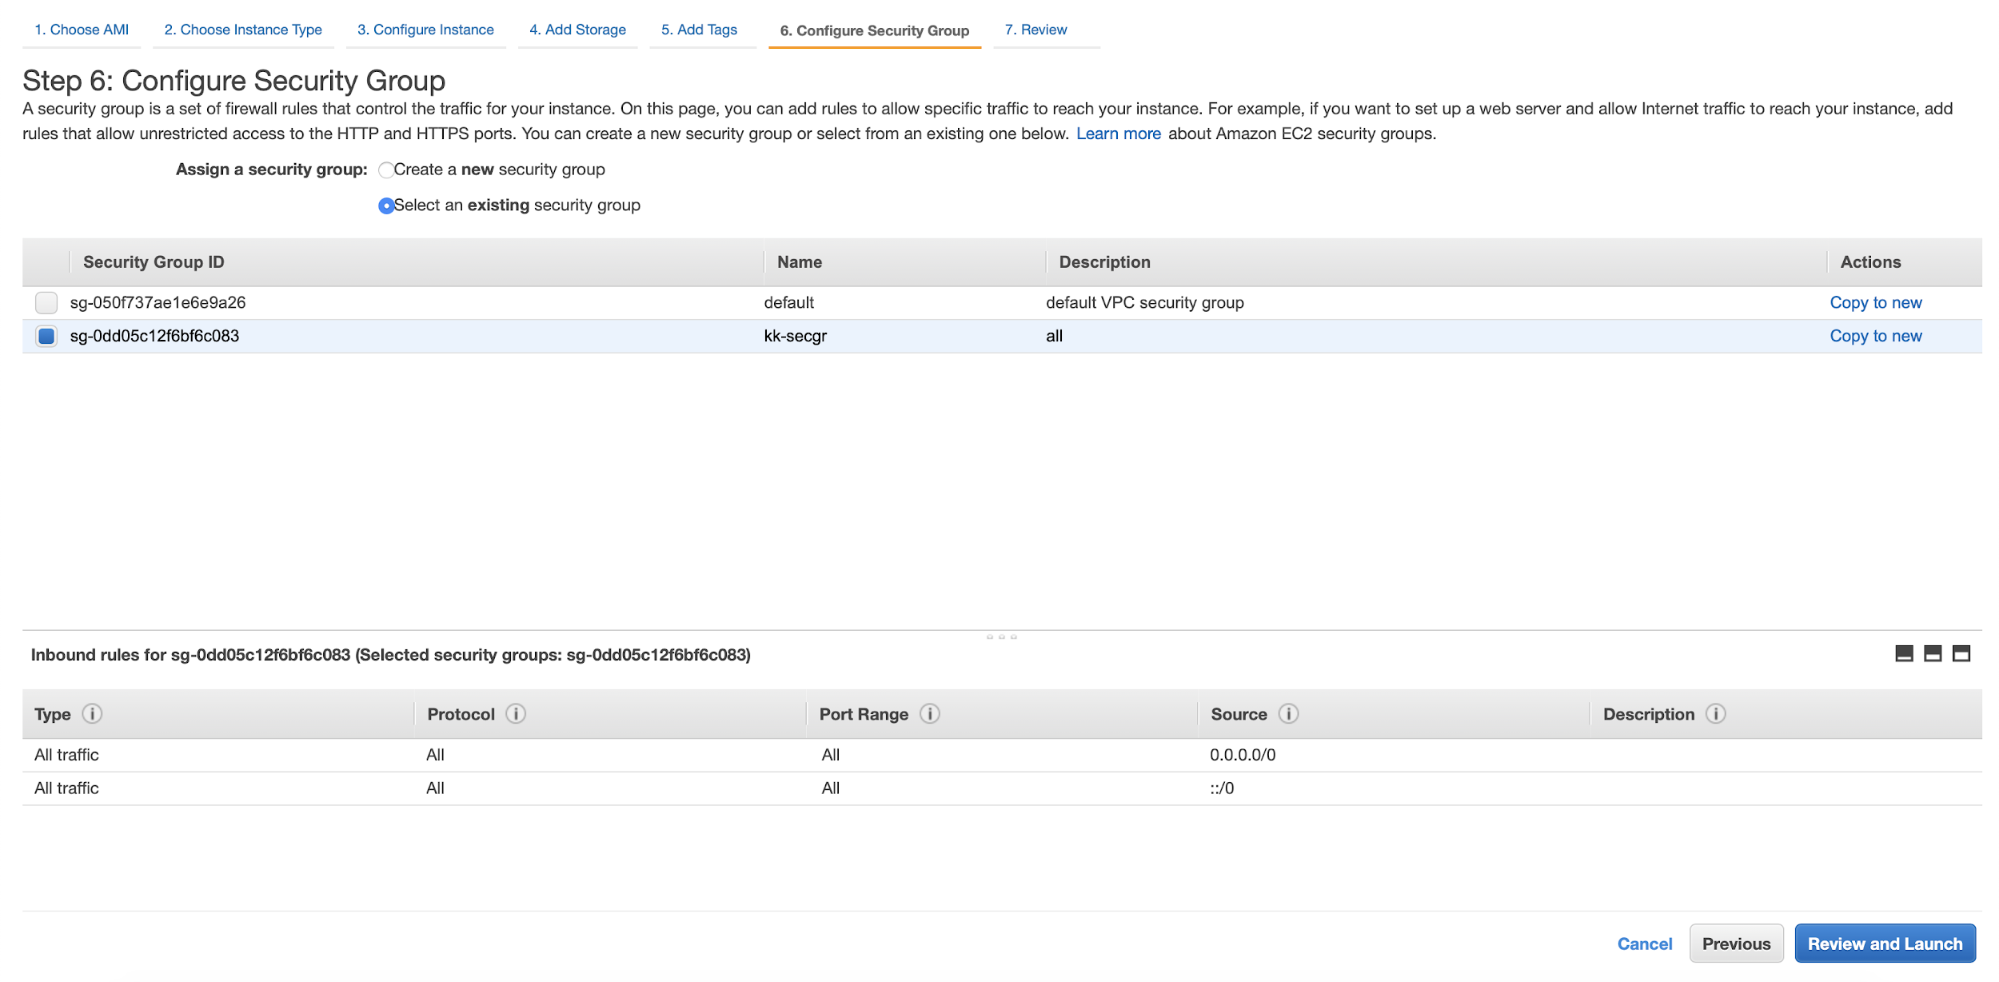
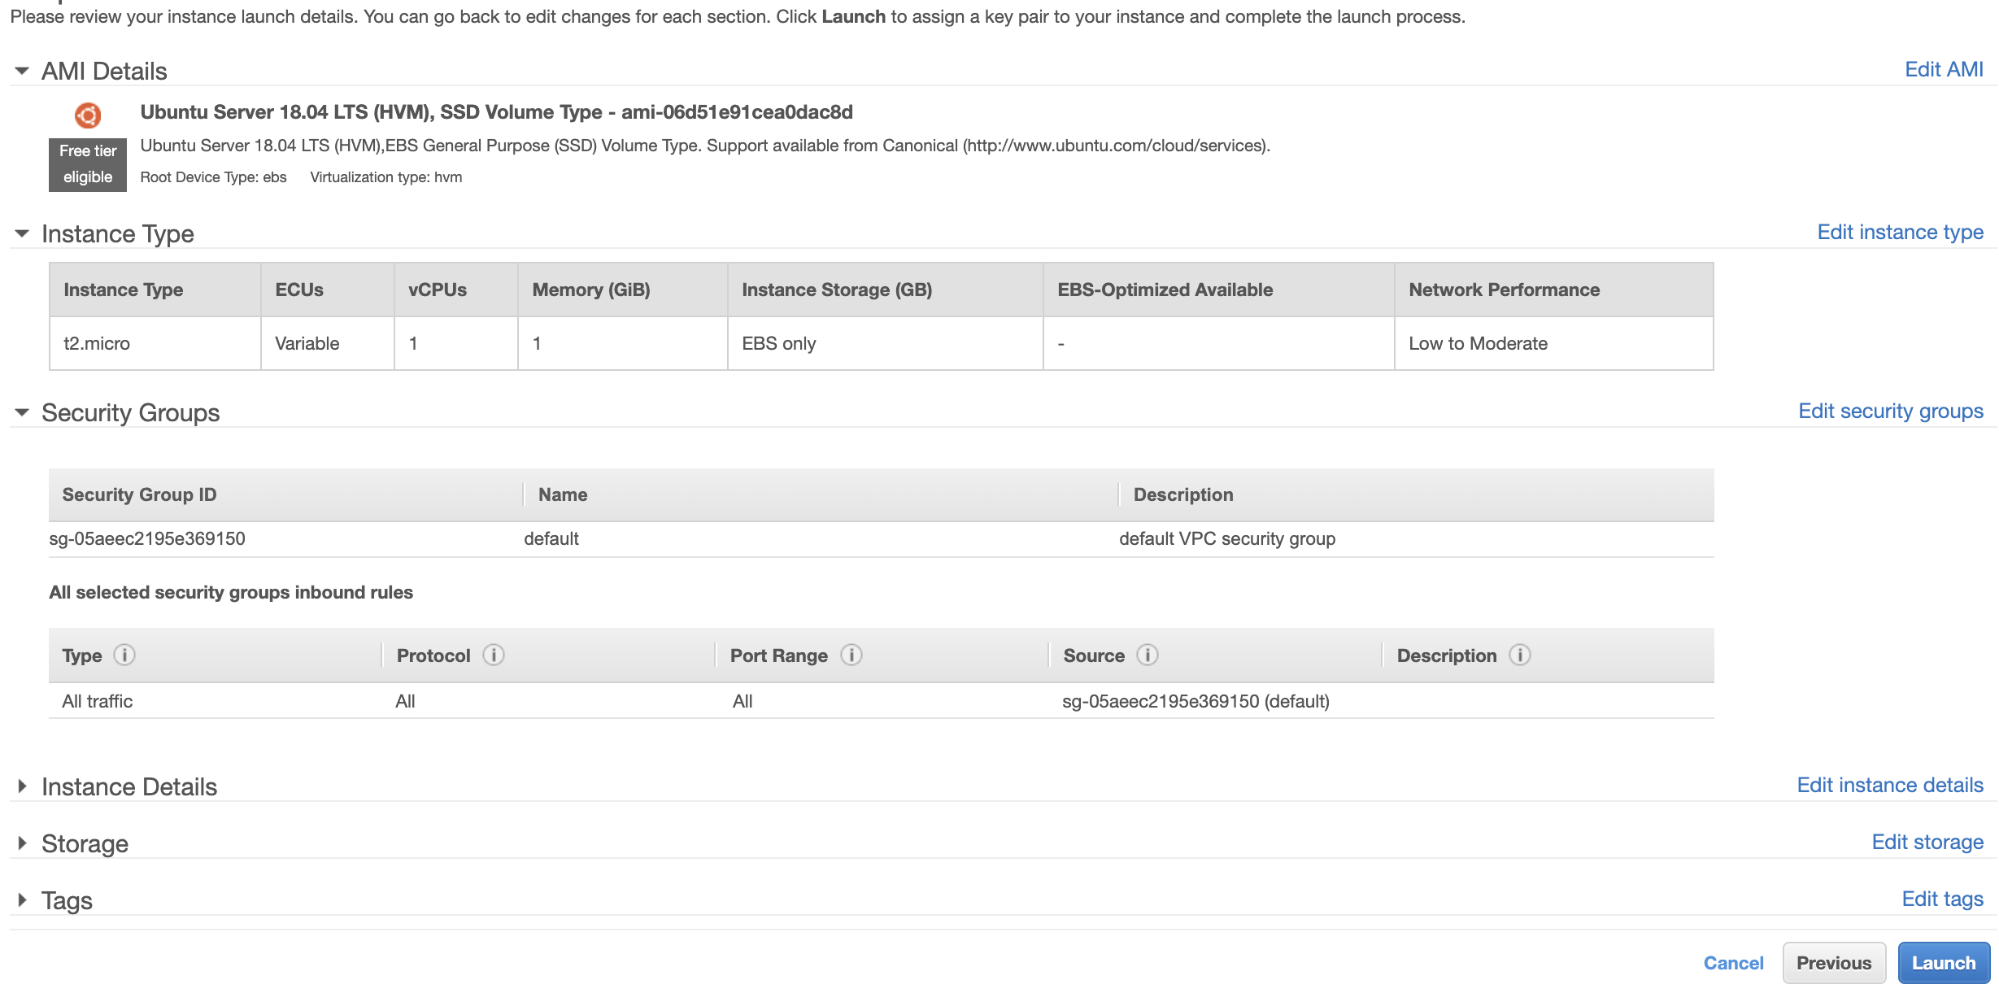
As discussed in our previous blogs for AWS and GCP, you can take the same approach for securing your database in the public cloud. Once you create a virtual machine, you can specify what ports only can be opened, or create and setup your Network Security Group in Azure. You can setup the ports need to be open (particularly ports 3306, 4444, 4567, 4568), or create a Virtual Network in Azure and specify the private subnets if they remain as a private node. To add this, if you setup your VM's in Azure without a public IP, it can still an outbound connection merely because it uses SNAT and PAT. If you're familiar with AWS and GCP, you'll like this explanation to make it easier to comprehend.

Another feature available is Role-Based Access Control in Microsoft Azure. This gives you control on which people that access to the specific resources they need.

In addition to this, you can secure your data-in-transit by using a TLS/SSL connection or by encrypting your data when it's at-rest. If you're using ClusterControl, deploying a secure data in-transit is simple and easy. You can check out our blog SSL Key Management and Encryption of MySQL Data in Transit if you want to try out. For data at-rest, you can follow the discussion I have stated earlier in the Encryption section of this blog.

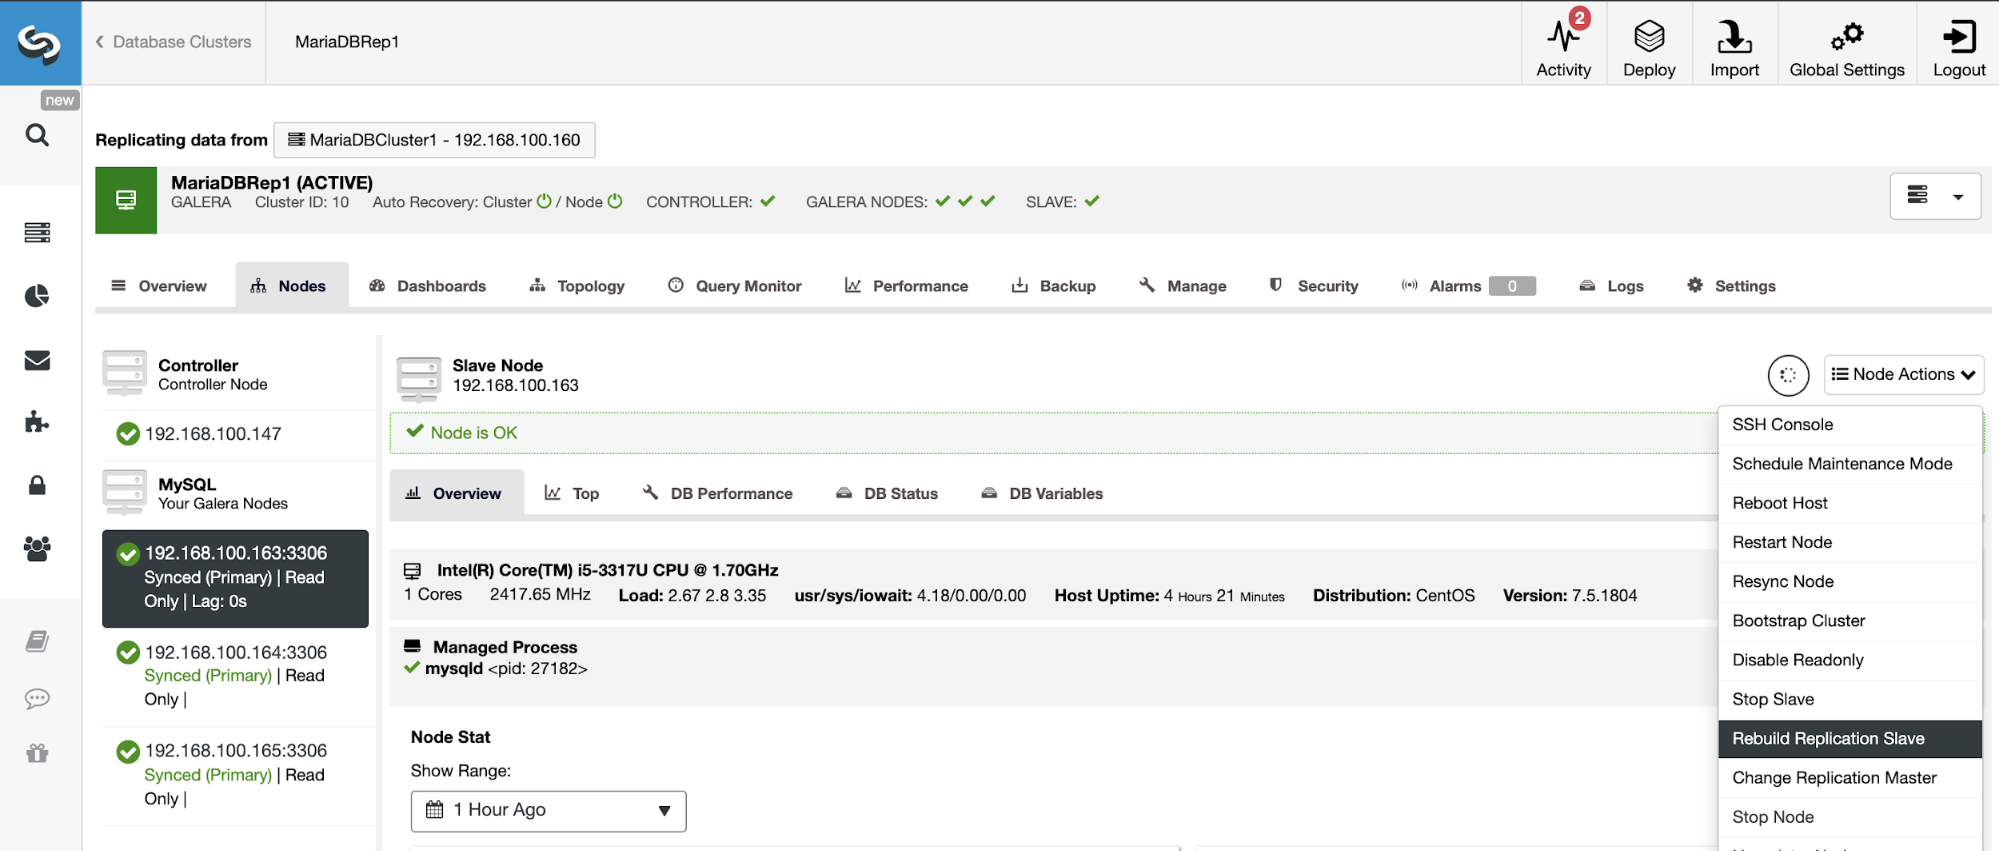
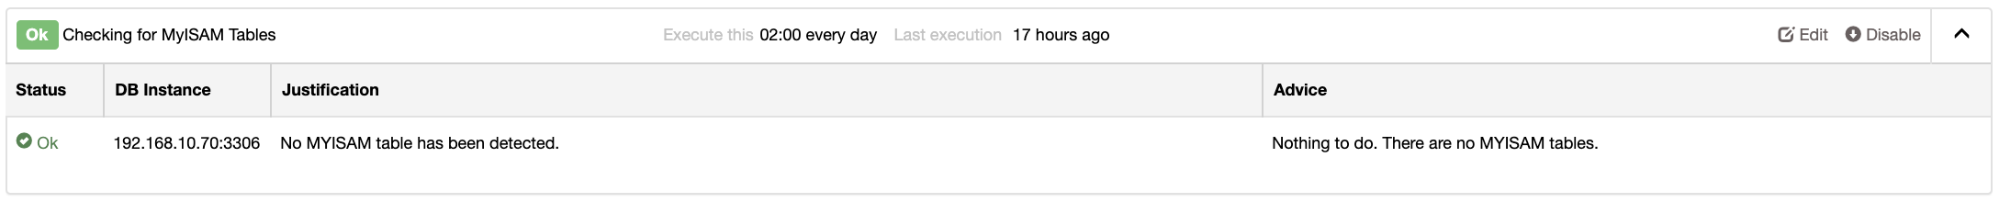
Galera Cluster Troubleshooting 

Microsoft Azure offers a wide array of log types to aid troubleshooting and auditing. The logs Activity logs, Azure diagnostics logs, Azure AD reporting, Virtual machines and cloud services, Network Security Group (NSG) flow logs, and Application insight are very useful when troubleshooting. It might not always be necessary to go into all of these when you need troubleshooting, however, it would add more insights and clues when checking the logs.

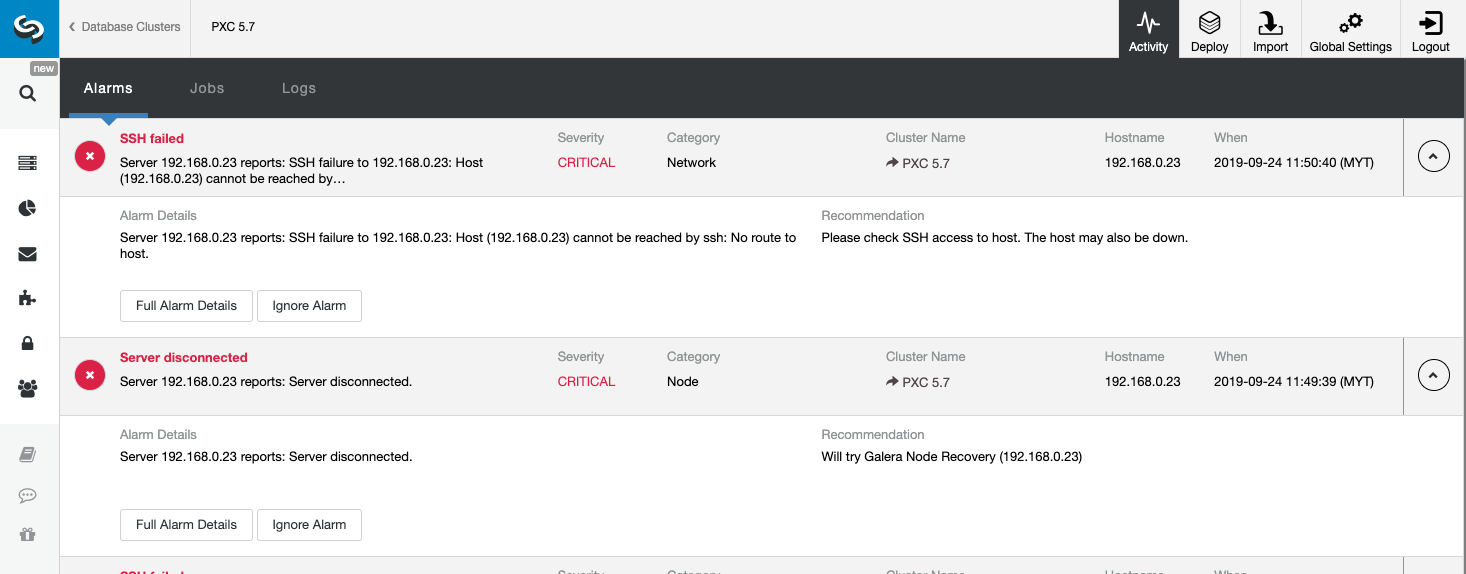
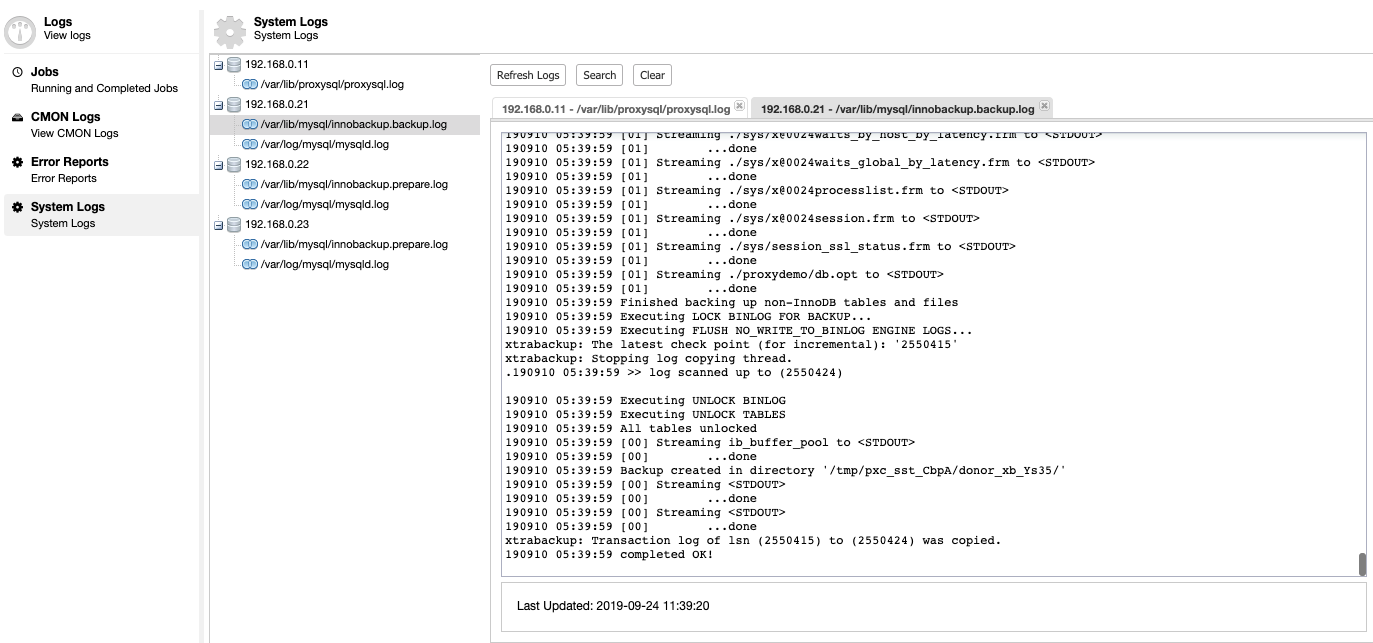
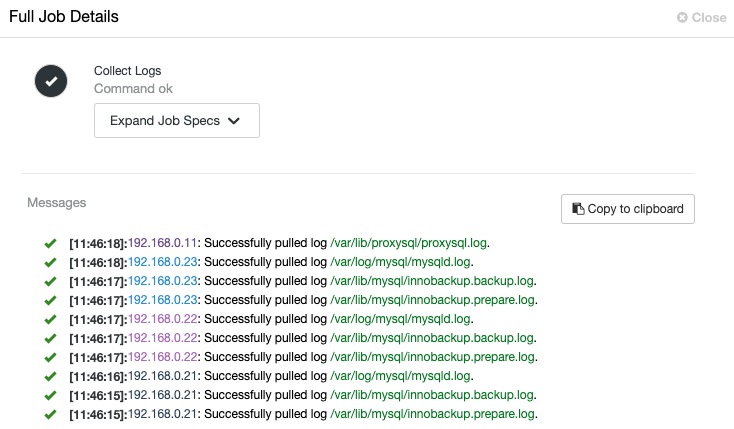
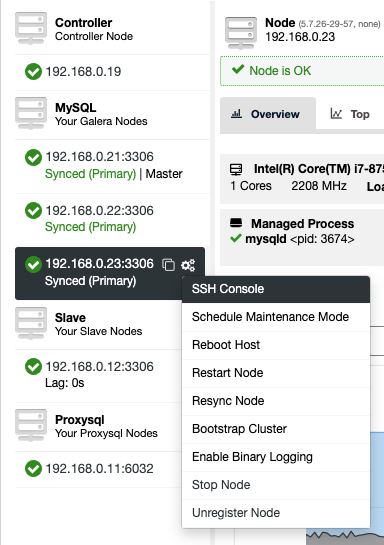
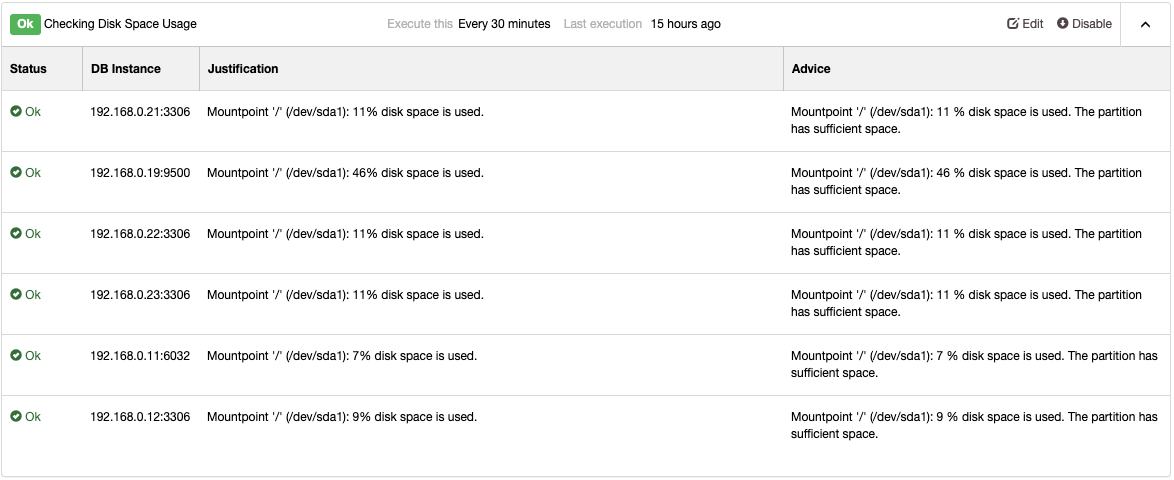
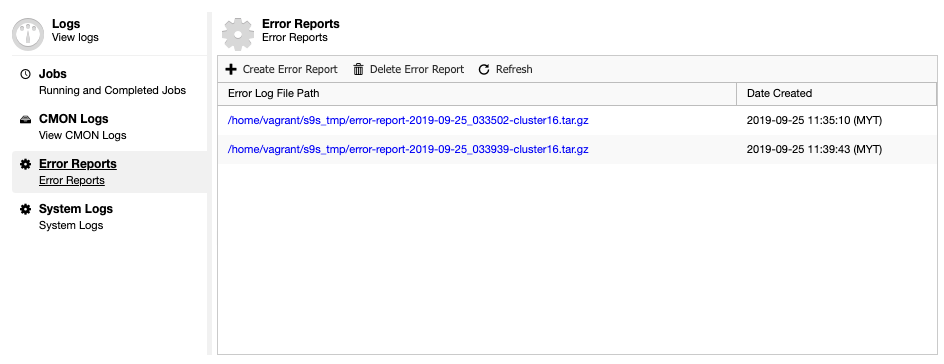
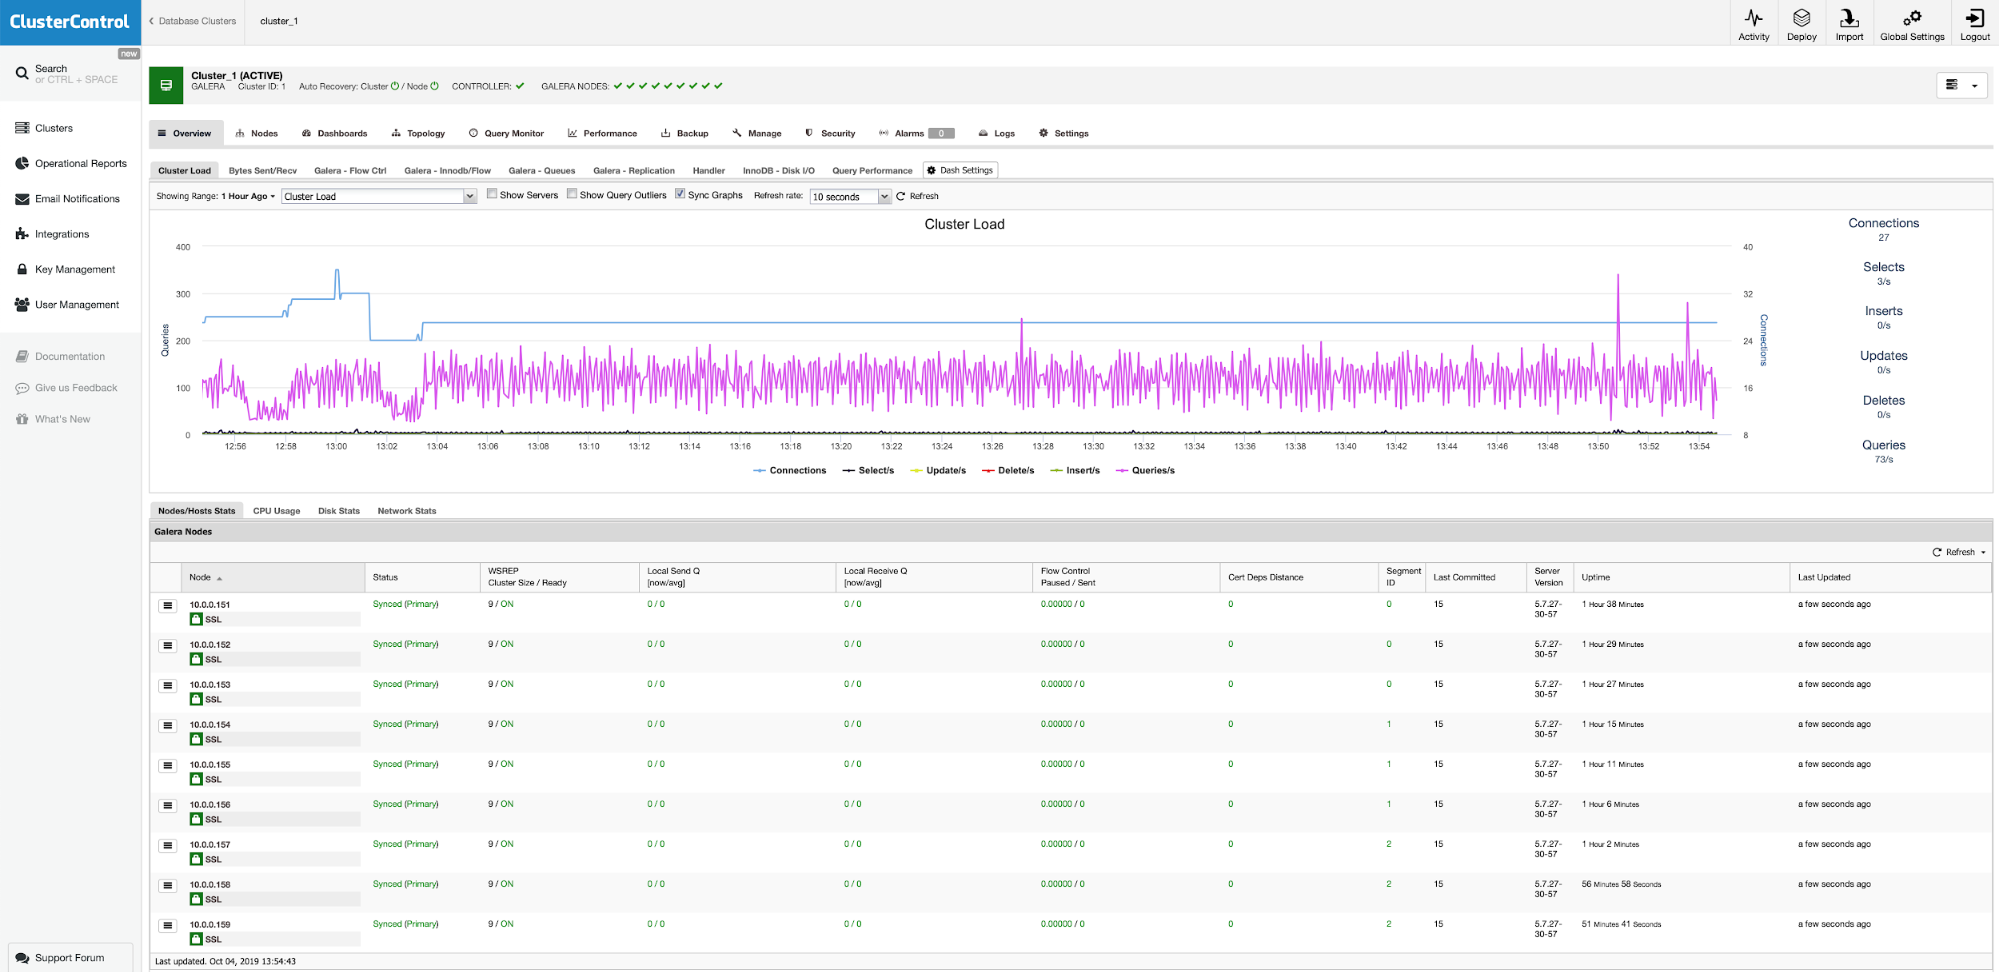
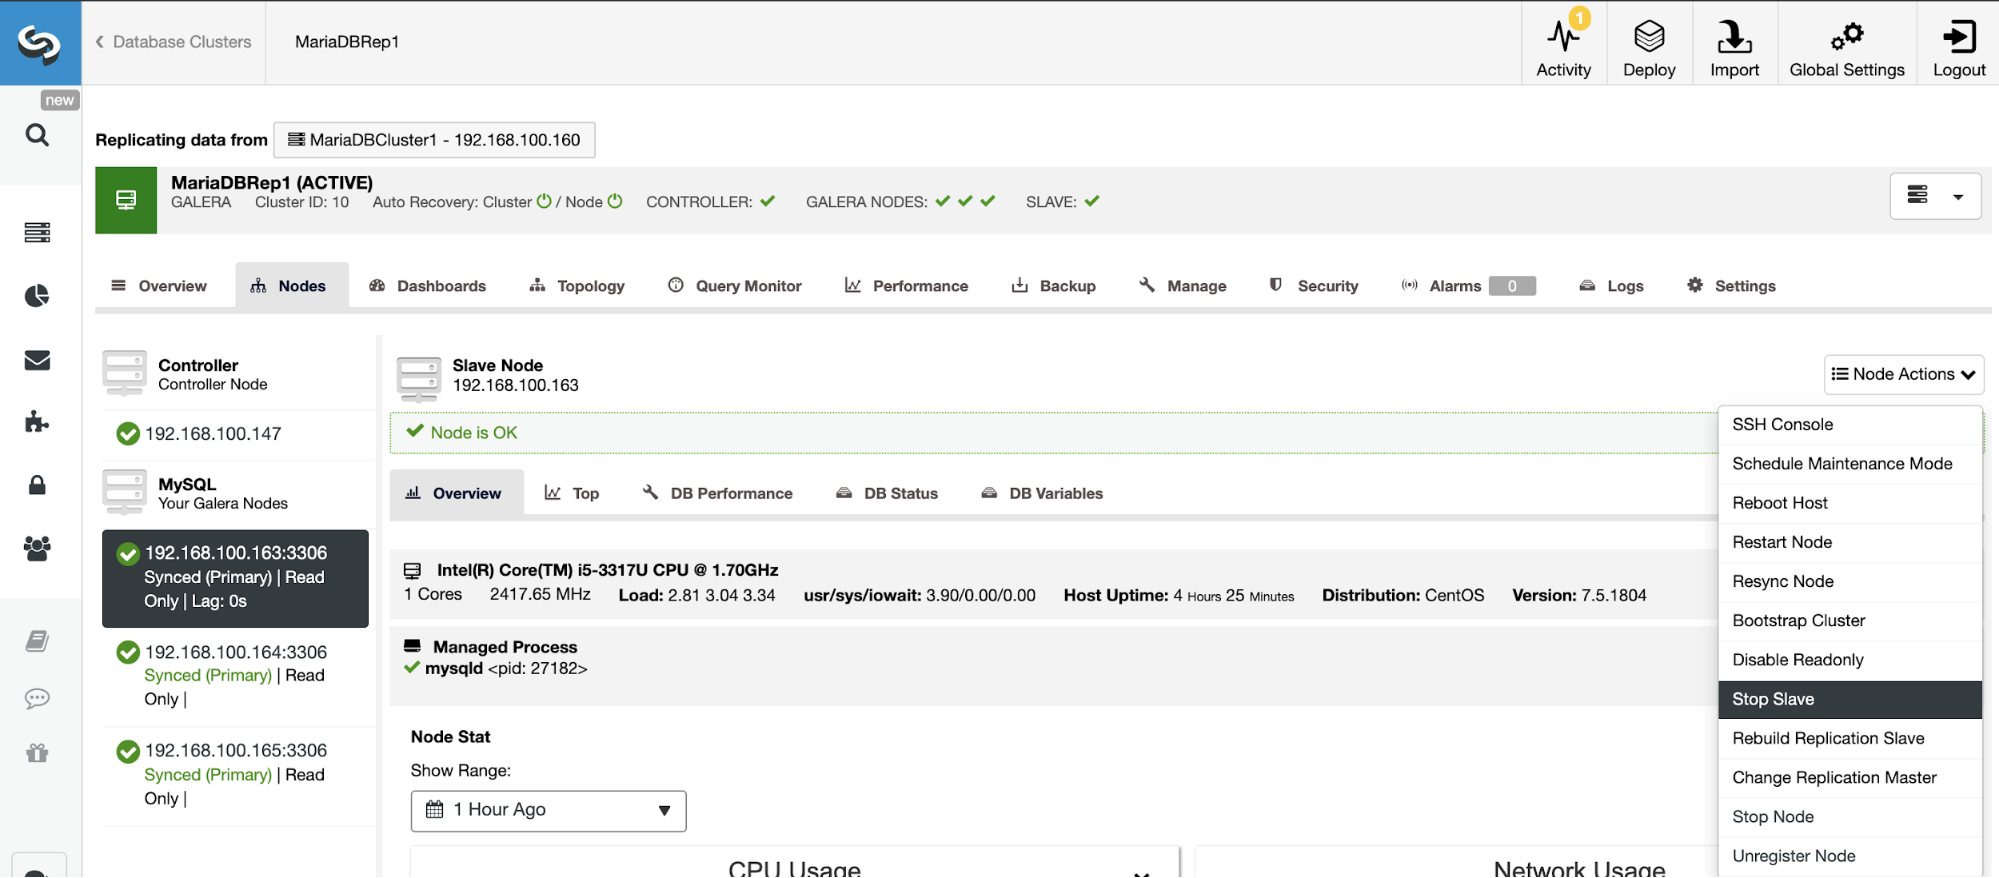
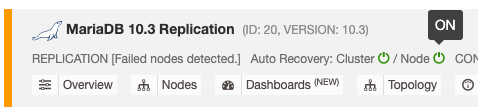
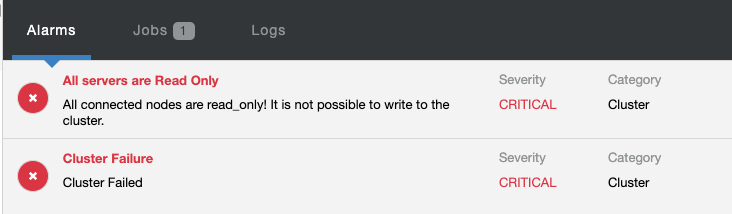
If you're using ClusterControl, going to Logs -> System Logs, and you'll be able to browse the captured error logs taken from the MySQL Galera node itself. Apart from this, ClusterControl provides real-time monitoring that would amplify your alarm and notification system in case an emergency or if your MySQL Galera node(s) is kaput.

Conclusion

As we finish this three part blog series, we have showed you the offerings and the advantages of each of the tech-giants serving the public cloud industry. There are advantages and disadvantages when selecting one over the other, but what matters most is your reason for moving to a public cloud, its benefits for your organization, and how it serves the requirements of your application. 

The choice of provider for your Galera Cluster may involve financial considerations like “what's most cost-efficient” and better suits your budgetary needs. It could also be due to privacy laws and regulation compliance, or even because of the technology stack you are wanting to use.  What's important is how your application and database will perform once it's in the cloud handling large amounts of traffic. It has to be highly-available, must be resilient, has the right levels of scalability and redundancy, and takes backups to ensure data recovery.


Database Switchover and Failover for Drupal Websites Using MySQL or PostgreSQL

$
0
0

Drupal is a Content Management System (CMS) designed to create everything from tiny to large corporate websites. Over 1,000,000 websites run on Drupal and it is used to make many of the websites and applications you use every day (including this one). Drupal has a great set of standard features such as easy content authoring, reliable performance, and excellent security. What sets Drupal apart is its flexibility as modularity is one of its core principles. 

Drupal is also a great choice for creating integrated digital frameworks. You can extend it with the thousands of add-ons available. These modules expand Drupal's functionality. Themes let you customize your content's presentation and distributions (Drupal bundles) are bundles which you can use as starter-kits. You can use all these functionalities to mix and match to enhance Drupal's core abilities or to integrate Drupal with external services. It is content management software that is powerful and scalable.

Drupal uses databases to store its web content. When your Drupal-based website or application is experiencing a large amount of traffic it can have an impact on your database server. When you are in this situation you'll require load balancing, high availability, and a redundant architecture to keep your database online. 

When I started researching this blog, I realized there are many answers to this issue online, but the solutions recommended were very dated. This could be a result of the increase in market share by WordPress resulting in a smaller open source community. What I did find were some examples on implementing high availability by using Master/Master (High Availability) or Master/Master/Slave (High Availability/High Performance)

Drupal offers support for a wide array of databases, but it was initially designed using MySQL variants. Though using MySQL is fully supported, there are better approaches you can implement. Implementing these other approaches, however, if not done properly, can cause your website to experience large amounts of downtime, cause your application to suffer performance issues, and may result in write issues to your slaves. Performing maintenance would also be difficult as you need failover to apply the server upgrades or patches (hardware or software) without downtime. This is especially true if you have a large amount of data, causing a potential major impact to your business. 

These are situations you don't want to happen which is why in this blog we’ll discuss how you can implement database failover for your MySQL or PostgreSQL databases.

Why Does Your Drupal Website Need Database Failover?

From Wikipedia“failover is switching to a redundant or standby computer server, system, hardware component or network upon the failure or abnormal termination of the previously active application, server, system, hardware component, or network. Failover and switchover are essentially the same operation, except that failover is automatic and usually operates without warning, while switchover requires human intervention.” 

In database operations, switchover is also a term used for manual failover, meaning that it requires a person to operate the failover. Failover comes in handy for any admin as it isolates unwanted problems such as accidental deletes/dropping of tables, long hours of downtime causing business impact, database corruption, or system-level corruption. 

Database Failover consists of more than a single database node, either physically or virtually. Ideally, since failover requires you to do switching over to a different node, you might as well switch to a different database server, if a host is running multiple database instances on a single host. That still can be either switchover or failover, but typically it's more of redundancy and high-availability in case a catastrophe occurs on that current host.

MySQL Failover for Drupal

Performing a failover for your Drupal-based application requires that the data handled by the database does not differentiate, nor separate. There are several solutions available, and we have already discussed some of them in previous Severalnines blogs. You may likely want to read our Introduction to Failover for MySQL Replication - the 101 Blog.

The Master-Slave Switchover

The most common approaches for MySQL Failover is using the master-slave switch over or the manual failover. There are two approaches you can do here:

  • You can implement your database with a typical asynchronous master-slave replication.
  • or can implement with asynchronous master-slave replication using GTID-based replication.

Switching to another master could be quicker and easier. This can be done with the following MySQL syntax:

mysql> SET GLOBAL read_only = 1; /* enable read-only */

mysql> CHANGE MASTER TO MASTER_HOST = '<hostname-or-ip>', MASTER_USER = '<user>', MASTER_PASSWORD = '<password>', MASTER_LOG_FILE = '<master-log-file>', MASTER_LOG_POS=<master_log_position>; /* master information to connect */

mysql> START SLAVE; /* start replication */

mysql> SHOW SLAVE STATUS\G /* check replication status */

or with GTID, you can simply do,

...

mysql> CHANGE MASTER TO MASTER_HOST = '<hostname-or-ip>', MASTER_USER = '<user>', MASTER_PASSWORD = '<password>', MASTER_AUTO_POSITION = 1; /* master information to connect */

...

Wit

Using the non-GTID approach requires you to determine first the master's log file and master's log pos. You can determine this by looking at the master's status in the master node before switching over. 

mysql> MASTER STATUS;

You may also consider hardening your server adding sync_binlog = 1 and innodb_flush_log_at_trx_commit = 1 as, in the event your master crashes, you'll have a higher chance that transactions from master will be insync with your slave(s). In such a case that promoted master has a higher chance of being a consistent datasource node.

This, however, may not be the best approach for your Drupal database as it could impose long downtimes if not performed correctly, such as being taken down abruptly. If your master database node experiences a bug resulting in a database to crash, you’ll need your application to point to another database waiting on standby as your new master or by having your slave promoted to be the master. You will need to specify exactly which node should take over and then determine the lag and consistency of that node. Achieving this is not as easy as just doing SET GLOBAL read_only=1; CHANGE MASTER TO… (etc), there are certain situations which require deeper analysis, looking at the viable transactions required to be present in that standby server or promoted master, to get it done. 

Drupal Failover Using MHA

One of the most common tools for automatic and manual failover is MHA. It has been around for a long while now and is still used by many organizations. You can checkout these previous blogs we have on the subject, Top Common Issues with MHA and How to Fix Them or MySQL High Availability Tools - Comparing MHA, MRM and ClusterControl.

Drupal Failover Using Orchestrator

Orchestrator has been widely adopted now and is being used by large organizations such as Github and Booking.com. It not only allows you to manage a failover, but also topology management, host discovery, refactoring, and recovery. There's a nice external blog here which I found it very useful to learn about its failover mechanism with Orchestrator. It's a two part blog series; part one and part two.

Drupal Failover Using MaxScale

MaxScale is not just a load balancer designed for MariaDB server, it also extends high availability, scalability, and security for MariaDB while, at the same time, simplifying application development by decoupling it from underlying database infrastructure. If you are using MariaDB, then MaxScale could be a relevant technology for you. Check out our previous blogs on how you can use the MaxScale failover mechanism.

Drupal Failover Using ClusterControl

Severalnines'ClusterControl offers a wide array of database management and monitoring solutions. Part of the solutions we offer is automatic failover, manual failover, and cluster/node recovery. This is very helpful as if it acts as your virtual database administrator, notifying you in real-time in case your cluster is in “panic mode,” all while the recovery is being managed by the system. You can check out this blog How to Automate Database Failover with ClusterControl to learn more about ClusterControl failover.

Other MySQL Solutions

Some of the old approaches are still applicable when you want to failover. There's MMM, MRM, or you can checkout Group Replication or Galera (note: Galera does not use asynchronous, rather synchronous replication). Failover in a Galera Cluster does not work the same way as it does with asynchronous replication. With Galera you can just write to any node or, if you implement a master-slave approach, you can direct your application to another node that will be the active-writer for the cluster.

Drupal PostgreSQL Failover

Since Drupal supports PostgreSQL, we will also checkout the tools to implement a failover or switchover process for PostgreSQL. PostgreSQL uses built-in Streaming Replication, however you can also set it to use a Logical Replication (added as a core element of PostgreSQL in version 10). 

Drupal Failover Using pg_ctlcluster

If your environment is Ubuntu, using pg_ctlcluster is a simple and easy way to achieve failover. For example, you can just run the following command:

$ pg_ctlcluster 9.6 pg_7653 promote

or with RHEL/Centos, you can use the pg_ctl command just like,

$ sudo -iu postgres /usr/lib/postgresql/9.6/bin/pg_ctl promote -D  /data/pgsql/slave/data

server promoting

You can also trigger failover of a log-shipping standby server by creating a trigger file with the filename and path specified by the trigger_file in the recovery.conf. 

You have to be careful with standby promotion or slave promotion here as you might have to ensure that only one master is accepting the read-write request. This means that, while doing the switchover, you might have to ensure the previous master has been relaxed or stopped.

Taking care of switchover or manual failover from primary to standby server can be fast, but it requires some time to re-prepare the failover cluster. Regularly switching from primary to standby is a useful practice as it allows for regular downtime on each system for maintenance. This also serves as a test of the failover mechanism, to ensure that it will really work when you need it. Written administration procedures are always advised. 

Drupal PostgreSQL Automatic Failover

Instead of a manual approach, you might require automatic failover. This is especially needed when a server goes down due to hardware failure or virtual machine corruption. You may also require an application to automatically perform the failover to lessen the downtime of your Drupal application. We'll now go over some of these tools which can be utilized for automatic failover.

Drupal Failover Using Patroni

Patroni is a template for you to create your own customized, high-availability solution using Python and - for maximum accessibility - a distributed configuration store like ZooKeeper, etcd, Consul or Kubernetes. Database engineers, DBAs, DevOps engineers, and SREs who are looking to quickly deploy HA PostgreSQL in the datacenter-or anywhere else-will hopefully find it useful

Drupal Failover Using Pgpool

Pgpool-II is a proxy software that sits between the PostgreSQL servers and a PostgreSQL database client. Aside from having an automatic failover, it has multiple features that includes connection pooling, load balancing, replication, and limiting the exceeding connections. You can read more about this tool is our three part blog; part one, part two, part three.

Drupal Failover Using pglookout

pglookout is a PostgreSQL replication monitoring and failover daemon. pglookout monitors the database nodes, their replication status, and acts according to that status. For example, calling a predefined failover command to promote a new master in the case the previous one goes missing.

pglookout supports two different node types, ones that are installed on the db nodes themselves and observer nodes that can be installed anywhere. The purpose of having pglookout on the PostgreSQL DB nodes is to monitor the replication status of the cluster and act accordingly, the observers have a more limited remit: they just observe the cluster status to give another viewpoint to the cluster state.

Drupal Failover Using repmgr

repmgr is an open-source tool suite for managing replication and failover in a cluster of PostgreSQL servers. It enhances PostgreSQL's built-in hot-standby capabilities with tools to set up standby servers, monitor replication, and perform administrative tasks such as failover or manual switchover operations.

repmgr has provided advanced support for PostgreSQL's built-in replication mechanisms since they were introduced in 9.0. The current repmgr series, repmgr 4, supports the latest developments in replication functionality introduced from PostgreSQL 9.3 such as cascading replication, timeline switching and base backups via the replication protocol.

Drupal Failover Using ClusterControl

ClusterControl supports automatic failover for PostgreSQL. If you have an incident, your slave can be promoted to master status automatically. With ClusterControl you can also deploy standalone, replicated, or clustered PostgreSQL database. You can also easily add or remove a node with a single action.

Other PostgreSQL Drupal Failover Solutions

There are certainly automatic failover solutions that I might have missed on this blog. If I did, please add your comments below so we can know your thoughts and experiences with your implementation and setup for failover especially for Drupal websites or applications.

Additional Solutions For Drupal Failover

While the tools I have mentioned earlier definitely handles the solution for your problems with failover, adding some tools that makes the failover pretty easier, safer, and has a total isolation between your database layer can be satisfactory. 

Drupal Failover Using ProxySQL

With ProxySQL, you can just point your Drupal websites or applications to the ProxySQL server host and it will designate which node will receive writes and which nodes will receive the reads. The magic happens transparently within the TCP layer and no changes are needed for your application/website configuration. In addition to that, ProxySQL acts also as your load balancer for your write and read requests for your database traffic. This is only applicable if you are using MySQL database variants.

Drupal Failover Using HAProxy with Keepalived

Using HAProxy and Keepalived adds more high availability and redundancy within your Drupal's database. If you want to failover, it can be done without your application knowing what's happening within your database layer. Just point your application to the vrrp IP that you setup in your Keepalived and everything will be handled with total isolation from your application. Having an automatic failover will be handled transparently and unknowingly by your application so no changes has to occur once, for example, a disaster has occurred and a recovery or failover was applied. The good thing about this setup is that it is applicable for both MySQL and PostgreSQL databases. I suggest you check out our blog PostgreSQL Load Balancing Using HAProxy & Keepalived to learn more about how to do this.

All of the options above are supported by ClusterControl. You can deploy or import the database and then deploy ProxySQL, MaxScale, or HAProxy & Keepalived. Everything will be managed, monitored, and will be set up automatically without any further configuration needed by your end. It all happens in the background and automatically creates a ready-for-production.

Conclusion

Having an always-on Drupal website or application, especially if you are expecting a large amount of traffic, can be complicated to create. If you have the right tools, the right setup, and the right technology stack, however, it is possible to achieve high availability and redundancy.

And if you don’t? Well then ClusterControl will set it up and maintain it for you. Alternatively, you can create a setup using the technologies mentioned in this blog, most of which are open source, free tools that would cater to your needs.

How to Troubleshoot MySQL Database Issues

$
0
0

As soon as you start running a database server and your usage grows, you are exposed to many types of technical problems, performance degradation, and database malfunctions.  Each of these could lead to much bigger problems, such as catastrophic failure or data loss. It’s like a chain reaction, where one thing can lead to another, causing more and more issues. Proactive countermeasures must be performed in order for you to have a stable environment as long as possible.

In this blog post, we are going to look at a bunch of cool features offered by ClusterControl that can greatly help us troubleshoot and fix our MySQL database issues when they happen.

Database Alarms and Notifications

For all undesired events, ClusterControl will log everything under Alarms, accessible on the Activity (Top Menu) of ClusterControl page. This is commonly the first step to start troubleshooting when something goes wrong. From this page, we can get an idea on what is actually going on with our database cluster:

ClusterControl Database Alarms

The above screenshot shows an example of a server unreachable event, with severity CRITICAL, detected by two components, Network and Node. If you have configured the email notifications setting, you should get a copy of these alarms in your mailbox. 

When clicking on the “Full Alarm Details,” you can get the important details of the alarm like hostname, timestamp, cluster name and so on. It also provides the next recommended step to take. You can also send out this alarm as an email to other recipients configured under the Email Notification Settings. 

You may also opt to silence an alarm by clicking the “Ignore Alarm” button and it will not appear in the list again. Ignoring an alarm might be useful if you have a low severity alarm and know how to handle or work around it. For example if ClusterControl detects a duplicate index in your database, where in some cases would be needed by your legacy applications.

By looking at this page, we can obtain an immediate understanding of what is going on with our database cluster and what the next step is to do to solve the problem. As in this case, one of the database nodes went down and became unreachable via SSH from the ClusterControl host. Even a beginner SysAdmin would now know what to do next if this alarm appears.

Centralized Database Log Files

This is where we can drill down what was wrong with our database server. Under ClusterControl -> Logs -> System Logs, you can see all log files related to the database cluster. As for MySQL-based database cluster, ClusterControl pulls the ProxySQL log, MySQL error log and backup logs:

ClusterControl System Logs

Click on "Refresh Log" to retrieve the latest log from all hosts that are accessible at that particular time. If a node is unreachable, ClusterControl will still view the outdated log in since this information is stored inside the CMON database. By default ClusterControl keeps retrieving the system logs every 10 minutes, configurable under Settings -> Log Interval. 

ClusterControl will trigger the job to pull the latest log from each server, as shown in the following "Collect Logs" job:

ClusterControl Database Job Details

A centralized view of log file allows us to have faster understanding on what went wrong. For a database cluster which commonly involves multiple nodes and tiers, this feature will greatly improve the log reading where a SysAdmin can compare these logs side-by-side and pinpoint critical events, reducing the total troubleshooting time. 

Web SSH Console

ClusterControl provides a web-based SSH console so you can access the DB server directly via the ClusterControl UI (as the SSH user is configured to connect to the database hosts). From here, we can gather much more information which allows us to fix the problem even faster. Everyone knows when a database issue hits the production system, every second of downtime counts.

To access the SSH console via web, simply pick the nodes under Nodes -> Node Actions -> SSH Console, or simply click on the gear icon for a shortcut:

ClusterControl Web SSH Console Access

Due to security concern that might be imposed with this feature, especially for multi-user or multi-tenant environment, one can disable it by going to /var/www/html/clustercontrol/bootstrap.php on ClusterControl server and set the following constant to false:

define('SSH_ENABLED', false);

Refresh the ClusterControl UI page to load the new changes.

Database Performance Issues

Apart from monitoring and trending features, ClusterControl proactively sends you various alarms and advisors related to database performance, for example:

  • Excessive usage - Resource that passes certain thresholds like CPU, memory, swap usage and disk space.
  • Cluster degradation - Cluster and network partitioning.
  • System time drift - Time difference among all nodes in the cluster (including ClusterControl node).
  • Various other MySQL related advisors:
    • Replication - replication lag, binlog expiration, location and growth
    • Galera - SST method, scan GRA logfile, cluster address checker
    • Schema check - Non-transactional table existance on Galera Cluster.
    • Connections - Threads connected ratio
    • InnoDB - Dirty pages ratio, InnoDB log file growth
    • Slow queries - By default ClusterControl will raise an alarm if it finds a query running for more than 30 seconds. This is of course configurable under Settings -> Runtime Configuration -> Long Query.
    • Deadlocks - InnoDB transactions deadlock and Galera deadlock.
    • Indexes - Duplicate keys, table without primary keys.

Check out the Advisors page under Performance -> Advisors to get the details of things that can be improved as suggested by ClusterControl. For every advisor, it provides justifications and advice as shown in the following example for "Checking Disk Space Usage" advisor:

ClusterControl Disk Space Usage Check

When a performance issue occurs you will get "Warning" (yellow) or "Critical" (red) status on these advisors. Further tuning is commonly required to overcome the problem. Advisors raise alarms, which means, users will get a copy of these alarms inside the mailbox if Email Notifications are configured accordingly. For every alarm raised by ClusterControl or its advisors, users will also get an email if the alarm has been cleared. These are pre-configured within ClusterControl and require no initial configuration. Further customization is always possible under Manage -> Developer Studio. You can check out this blog post on how to write your own advisor.

ClusterControl also provides a dedicated page in regards to database performance under ClusterControl -> Performance. It provides all sorts of database insights following the best-practices like centralized view of DB Status, Variables, InnoDB status, Schema Analyzer, Transaction Logs. These are pretty self-explanatory and straightforward to understand.

For query performance, you can inspect Top Queries and Query Outliers, where ClusterControl highlights queries which performed significantly differ from their average query. We have covered this topic in detail in this blog post, MySQL Query Performance Tuning.

Database Error Reports

ClusterControl comes with an error report generator tool, to collect debugging information about your database cluster to help understand the current situation and status. To generate an error report, simply go to ClusterControl -> Logs -> Error Reports -> Create Error Report:

ClusterControl Database Error Reports

The generated error report can be downloaded from this page once ready. This generated report will be in TAR ball format (tar.gz) and you may attach it to a support request. Since the support ticket has the limit of 10MB of file size, if the tarball size is bigger than that, you could upload it into a cloud drive and only share with us the download link with proper permission. You may remove it later once we already got the file. You can also generate the error report via command line as explained in the Error Report documentation page.

In the event of an outage, we highly recommend that you generate multiple error reports during and right after the outage. Those reports will be very useful to try to understand what went wrong, the consequences of the outage, and to verify that the cluster is in-fact back to operational status after a disastrous event.

Conclusion

ClusterControl proactive monitoring, together with a set of troubleshooting features, provide an efficient platform for  users to troubleshoot any kind of MySQL database issues. Long gone is the legacy way of troubleshooting where one has to open multiple SSH sessions to access multiple hosts and execute multiple commands repeatedly in order to pinpoint the root cause.

If the above mentioned features are not helping you in solving the problem or troubleshooting the database issue, you always contact the Severalnines Support Team to back you up. Our 24/7/365 dedicated technical experts are available to attend your request at anytime. Our average first reply time is usually less than 30 minutes.

What’s New in MySQL Galera Cluster 4.0

$
0
0

MySQL Galera Cluster 4.0 is the new kid on the database block with very interesting new features. Currently it is available only as a part of MariaDB 10.4 but in the future it will work as well with MySQL 5.6, 5.7 and 8.0. In this blog post we would like to go over some of the new features that came along with Galera Cluster 4.0.

Galera Cluster Streaming Replication

The most important new feature in this release is streaming replication. So far the certification process for the Galera Cluster worked in a way that whole transactions had to be certified after they completed. 

This process was not ideal in several scenarios...

  1. Hotspots in tables, rows which are very frequently updated on multiple nodes - hundreds of fast transactions running on multiple nodes, modifying the same set of rows result in frequent deadlocks and rollback of transactions
  2. Long running transactions - if a transaction takes significant time to complete, this seriously increases chances that some other transaction, in the meantime, on another node, may modify some of the rows that were also updated by the long transaction. This resulted in a deadlock during certification and one of the transactions having to be rolled back.
  3. Large transactions - if a transaction modifies a significant number of rows, it is likely that another transaction, at the same time, on a different node, will modify one of the rows already modified by the large transaction. This results in a deadlock during certification and one of the transactions has to be rolled back. In addition to this, large transactions will take additional time to be processed, sent to all nodes in the cluster and certified. This is not an ideal situation as it adds delay to commits and slows down the whole cluster.

Luckily, streaming replication can solve these problems. The main difference is that the certification happens in chunks where there is no need to wait for the whole transaction to complete. As a result, even if a transaction is large or long, majority (or all, depending on the settings we will discuss in a moment) of rows are locked on all of the nodes, preventing other queries from modifying them.

MySQL Galera Cluster Streaming Replication Options

There are two configuration options for streaming replication: 

wsrep_trx_fragment_size 

This tells how big a fragment should be (by default it is set to 0, which means that the streaming replication is disabled)

wsrep_trx_fragment_unit 

This tells what the fragment really is. By default it is bytes, but it can also be a ‘statements’ or ‘rows’. 

Those variables can (and should) be set on a session level, making it possible for user to decide which particular query should be replicated using streaming replication. Setting unit to ‘statements’ and size to 1 allow, for example, to use streaming replication just for a single query which, for example, updates a hotspot.

You can configure Galera 4.0 to certify every row that you have modified and grab the locks on all of the nodes while doing so. This makes streaming replication great at solving problems with frequent deadlocks which, prior to Galera 4.0, were possible to solve only by redirecting all writes to a single node.

WSREP Tables

Galera 4.0 introduces several tables, which will help to monitor the state of the cluster:

  • wsrep_cluster
  • wsrep_cluster_members
  • wsrep_streaming_log

All of them are located in the ‘mysql’ schema. wsrep_cluster will provide insight into the state of the cluster. wsrep_cluster_members will give you information about the nodes that are part of the cluster. wsrep_streaming_log helps to track the state of the streaming replication.

Galera Cluster Upcoming Features

Codership, the company behind the Galera, isn’t done yet. We were able to get a preview of the roadmap  from CEO, Seppo Jaakola which was given at Percona Live earlier this year. Apparently, we are going to see features like XA transaction support and gcache encryption. This is really good news. 

Support for XA transactions will be possible thanks to the streaming replication. In short, XA transactions are the distributed transactions which can run across multiple nodes. They utilize two-phase commit, which requires to first acquire all required locks to run the transaction on all of the nodes and then, once it is done, commit the changes. In previous versions Galera did not have means to lock resources on remote nodes, with streaming replication this has changed.

Gcache is a file which stores writesets. Its contents are sent to joiner nodes which asks for a data transfer. If all data is stored in the gcache, joiner will receive just the missing transactions in the process called Incremental State Transfer (IST). If gcache does not contain all required data, State Snapshot Transfer (SST) will be required and the whole dataset will have to be transferred to the joining node. 

Gcache contains information about recent changes, therefore it’s great to see its contents encrypted for better security. With better security standards being introduced through more and more regulations, it is crucial that the software will become better at achieving compliance.

Conclusion

We are definitely looking forward to see how Galera Cluster 4.0 will work out on databases than MariaDB. Being able to deploy MySQL 5.7 or 8.0 with Galera Cluster will be really great. After all, Galera is one of the most widely tested synchronous replication solutions that are available on the market.

How to Create a Clone of Your MySQL or PostgreSQL Database Cluster

$
0
0

If you are managing a production database, chances are high that you’ve had to clone your database to a different server other than the production server. The basic method of creating a clone is to restore a database from a recent backup onto another database server. Another method is by replicating from a source database while it is still running, in which case it is important that the original database be unaffected by any cloning procedure.

Why Would You Need to Clone a Database?

A cloned database cluster is useful in a number of scenarios:

  • Troubleshoot your cloned production cluster in the safety of your test environment while performing destructive operations on the database.
  • Patch/upgrade test of a cloned database to validate the upgrade process before applying it to the production cluster.
  • Validate backup & recovery of a production cluster using a cloned cluster.
  • Validate or test new applications on a cloned production cluster before deploying it on the live production cluster.
  • Quickly clone the database for audit or information compliance requirements for example by quarter or year end where the content of the database must not be changed.
  • A reporting database can be created at intervals in order to avoid data changes during the report generations.
  • Migrate a database to new servers, new deployment environment or a new data center.

When running your database infrastructure on the cloud, the cost of owning a host (shared or dedicated virtual machine) is significantly lower compared to the traditional way of renting space in a datacenter or owning a physical server. Furthermore, most of the cloud deployment can be automated easily via provider APIs, client software and scripting. Therefore, cloning a cluster can be a common way to duplicate your deployment environment for example, from dev to staging to production or vice versa.

We haven't seen this feature being offered by anyone in the market thus it is our privilege to showcase how it works with ClusterControl.

Cloning a MySQL Galera Cluster

One of the cool features in ClusterControl is it allows you to quickly clone, an existing MySQL Galera Cluster so you have an exact copy of the dataset on the other cluster. ClusterControl performs the cloning operation online, without any locking or bringing downtime to the existing cluster. It's like a cluster scale out operation except both clusters are independent to each other after the syncing completes. The cloned cluster does not necessarily need to be as the same cluster size as the existing one. We could start with one-node cluster, and scale it out with more database nodes at a later stage.

In this example, we are having a cluster called "Staging" that we would want to clone as another cluster called "Production". The premise is the staging cluster already stored the necessary data that is going to be in production soon. The production cluster consists of another 3 nodes, with production specs.

The following diagram summarizes final architecture of what we want to achieve:

How to Clone Your Database - ClusterControl

The first thing to do is to set up a passwordless SSH from ClusterControl server to the production servers. On ClusterControl server run the following:

$ whoami

root

$ ssh-copy-id root@prod1.local

$ ssh-copy-id root@prod2.local

$ ssh-copy-id root@prod3.local

Enter the root password of the target server if prompted.

From ClusterControl database cluster list, click on the Cluster Action button and choose Clone Cluster. The following wizard will appear:

Clone Cluster - ClusterControl

Specify the IP addresses or hostnames of the new cluster and make sure you get all the green tick icon next to the specified host. The green icon means ClusterControl is able to connect to the host via passwordless SSH. Click on the "Clone Cluster" button to start the deployment.

The deployment steps are:

  1. Create a new cluster consists of one node.
  2. Sync the new one-node cluster via SST. The donor is one of the source servers.
  3. The remaining new nodes will be joining the cluster after the donor of the cloned cluster is synced with the cluster.

Once done, a new MySQL Galera Cluster will be listed under ClusterControl cluster dashboard once the deployment job completes.

Note that the cluster cloning only clones the database servers and not the whole stack of the cluster. This means, other supporting components related to the cluster like load balancers, virtual IP address, Galera arbitrator or asynchronous slave are not going to be cloned by ClusterControl. Nevertheless, if you would like to clone as an exact copy of your existing database infrastructure, you can achieve that with ClusterControl by deploying those components separately after the database cloning operation completes.

Creating a Database Cluster from a Backup

Another similar feature offered by ClusterControl is "Create Cluster from Backup". This feature is introduced in ClusterControl 1.7.1, specifically for Galera Cluster and PostgreSQL clusters where one can create a new cluster from the existing backup. Contratory to cluster cloning, this operation does not bring additional load to the source cluster with a tradeoff of the cloned cluster will not be at the current state as the source cluster.

In order to create cluster from a backup, you must have a working backup created. For Galera Cluster, all backup methods are supported while for PostgreSQL, only pgbackrest is not supported for new cluster deployment. From ClusterControl, a backup can be created or scheduled easily under ClusterControl -> Backups -> Create Backup. From the list of the created backup, click on Restore backup, choose the backup from the list and choose to "Create Cluster from Backup" from the restoration option:

Restore Backup with ClusterControl

In this example, we are going to deploy a new PostgreSQL Streaming Replication cluster for staging environment, based on the existing backup we have in the production cluster. The following diagram illustrates the final architecture:

Database Backup Restoration with ClusterControl

The first thing to do is to set up a passwordless SSH from ClusterControl server to the production servers. On ClusterControl server run the following:

$ whoami

root

$ ssh-copy-id root@prod1.local

$ ssh-copy-id root@prod2.local

$ ssh-copy-id root@prod3.local

When you chooseCreate Cluster From Backup, ClusterControl will open a deployment wizard dialog to assist you on setting up the new cluster:

Create Cluster from Backup - ClusterControl

A new PostgreSQL Streaming Replication instance will be created from the selected backup, which will be used as the base dataset for the new cluster. The selected backup must be accessible from the nodes in the new cluster, or stored in the ClusterControl host. 

Clicking on "Continue" will open the standard database cluster deployment wizard:

Create Database Cluster from Backup - ClusterControl

Note that the root/admin user password for this cluster must the same as the PostgreSQL admin/root password as included in the backup. Follow the configuration wizard accordingly and ClusterControl then perform the deployment on the following order:

  1. Install necessary softwares and dependencies on all PostgreSQL nodes.
  2. Start the first node.
  3. Stream and restore backup on the first node.
  4. Configure and add the rest of the nodes.

Once done, a new PostgreSQL Replication Cluster will be listed under ClusterControl cluster dashboard once the deployment job completes.

Conclusion

ClusterControl allows you to clone or copy a database cluster to multiple environments with just a number of clicks. You can download it for free today. Happy cloning!

Using MySQL Galera Cluster Replication to Create a Geo-Distributed Cluster: Part One

$
0
0

It is quite common to see databases distributed across multiple geographical locations. One scenario for doing this type of setup is for disaster recovery, where your standby data center is located in a separate location than your main datacenter. It might as well be required so that the databases are located closer to the users. 

The main challenge to achieving this setup is by designing the database in a way that reduces the chance of issues related to the network partitioning. One of the solutions might be to use Galera Cluster instead of regular asynchronous (or semi-synchronous) replication. In this blog we will discuss the pros and cons of this approach. This is the first part in a series of two blogs. In the second part we will design the geo-distributed Galera Cluster and see how ClusterControl can help us deploy such environment.

Why Galera Cluster Instead of  Asynchronous Replication for Geo-Distributed Clusters?

Let’s consider the main differences between the Galera and regular replication. Regular replication provides you with just one node to write to, this means that every write from remote datacenter would have to be sent over the Wide Area Network (WAN) to reach the master. It also means that all proxies located in the remote datacenter will have to be able to monitor the whole topology, spanning across all data centers involved as they have to be able to tell which node is currently the master. 

This leads to the number of problems. First, multiple connections have to be established across the WAN, this adds latency and slows down any checks that proxy may be running. In addition, this adds unnecessary overhead on the proxies and databases. Most of the time you are interested only in routing traffic to the local database nodes. The only exception is the master and only because of this proxies are forced to watch the whole infrastructure rather than just the part located in the local datacenter. Of course, you can try to overcome this by using proxies to route only SELECTs, while using some other method (dedicated hostname for master managed by DNS) to point the application to master, but this adds unnecessary levels of complexity and moving parts, which could seriously impact your ability to handle multiple node and network failures without losing data consistency.

Galera Cluster can support multiple writers. Latency is also a factor, as all nodes in the Galera cluster have to coordinate and communicate to certify writesets, it can even be the reason you may decide not to use Galera when latency is too high. It is also an issue in replication clusters - in replication clusters latency affects only writes from the remote data centers while the connections from the datacenter where master is located would benefit from a low latency commits. 

In MySQL Replication you also have to take the worst case scenario in mind and ensure that the application is ok with delayed writes. Master can always change and you cannot be sure that all the time you will be writing to a local node.

Another difference between replication and Galera Cluster is the handling of the replication lag. Geo-distributed clusters can be seriously affected by lag: latency, limited throughput of the WAN connection, all of this will impact the ability of a replicated cluster to keep up with the replication. Please keep in mind that replication generates one to all traffic.

Geo-Distributed Galera Cluster

All slaves have to receive whole replication traffic - the amount of data you have to send to remote slaves over WAN increases with every remote slave that you add. This may easily result in the WAN link saturation, especially if you do plenty of modifications and WAN link doesn’t have good throughput. As you can see on the diagram above, with three data centers and three nodes in each of them master has to sent 6x the replication traffic over WAN connection.

With Galera cluster things are slightly different. For starters, Galera uses flow control to keep the nodes in sync. If one of the nodes start to lag behind, it has an ability to ask the rest of the cluster to slow down and let it catch up. Sure, this reduces the performance of the whole cluster, but it is still better than when you cannot really use slaves for SELECTs as they tend to lag from time to time - in such cases the results you will get might be outdated and incorrect.

Geo-Distributed Galera Cluster

Another feature of Galera Cluster, which can significantly improve its performance when used over WAN, are segments. By default Galera uses all to all communication and every writeset is sent by the node to all other nodes in the cluster. This behavior can be changed using segments. Segments allow users to split Galera cluster in several parts. Each segment may contain multiple nodes and it elects one of them as a relay node. Such node receives writesets from other segments and redistribute them across Galera nodes local to the segment. As a result, as you can see on the diagram above, it is possible to reduce the replication traffic going over WAN three times - just two “replicas” of the replication stream are being sent over WAN: one per datacenter compared to one per slave in MySQL Replication.

Galera Cluster Network Partitioning Handling

Where Galera Cluster shines is the handling of the network partitioning. Galera Cluster constantly monitors the state of the nodes in the cluster. Every node attempts to connect with its peers and exchange the state of the cluster. If subset of nodes is not reachable, Galera attempts to relay the communication so if there is a way to reach those nodes, they will be reached.

Galera Cluster Network Partitioning Handling

An example can be seen on the diagram above: DC 1 lost the connectivity with DC2 but DC2 and DC3 can connect. In this case one of the nodes in DC3 will be used to relay data from DC1 to DC2 ensuring that the intra-cluster communication can be maintained.

Galera Cluster Network Partitioning Handling

Galera Cluster is able to take actions based on the state of the cluster. It implements quorum - majority of the nodes have to be available in order for the cluster to be able to operate. If node gets disconnected from the cluster and cannot reach any other node, it will cease to operate. 

As can be seen on the diagram above, there’s a partial loss of the network communication in DC1 and affected node is removed from the cluster, ensuring that the application will not access outdated data.

Galera Cluster Network Partitioning Handling

This is also true on a larger scale. The DC1 got all of its communication cut off. As a result, whole datacenter has been removed from the cluster and neither of its nodes will serve the traffic. The rest of the cluster maintained majority (6 out of 9 nodes are available) and it reconfigured itself to keep the connection between DC 2 and DC3. In the diagram above we assumed the write hits the node in DC2 but please keep in mind that Galera is capable of running with multiple writers.

MySQL Replication does not have any kind of cluster awareness, making it problematic to handle network issues. It cannot shut down itself upon losing connection with other nodes. There is no easy way of preventing old master to show up after the network split. 

The only possibilities are limited to the proxy layer or even higher. You have to design a system, which would try to understand the state of the cluster and take necessary actions. One possible way is to use cluster-aware tools like Orchestrator and then run scripts that would check the state of the Orchestrator RAFT cluster and, based on this state, take required actions on the database layer. This is far from ideal because any action taken on a layer higher than the database, adds additional latency: it makes possible so the issue shows up and data consistency is compromised before correct action can be taken. Galera, on the other hand, takes actions on the database level, ensuring the fastest reaction possible.

Using MySQL Galera Cluster Replication to Create a Geo-Distributed Cluster: Part Two

$
0
0

In the previous blog in the series we discussed the pros and cons of using Galera Cluster to create geo-distributed cluster. In this post we will design a Galera-based geo-distributed cluster and we will show how you can deploy all the required pieces using ClusterControl.

Designing a Geo-Distributed Galera Cluster

We will start with explaining the environment we want to build. We will use three remote data centers, connected via Wide Area Network (WAN). Each datacenter will receive writes from local application servers. Reads will also be only local. This is intended to avoid unnecessary traffic crossing the WAN. 

For this setup the connectivity is in place and secured, but we won’t describe exactly how this can be achieved. There are numerous methods to secure the connectivity starting from proprietary hardware and software solutions through OpenVPN and ending up on SSH tunnels. 

We will use ProxySQL as a loadbalancer. ProxySQL will be deployed locally in each datacenter. It will also route traffic only to the local nodes. Remote nodes can always be added manually and we will explain cases where this might be a good solution. Application can be configured to connect to one of the local ProxySQL nodes using round-robin algorithm. We can as well use Keepalived and Virtual IP to route the traffic towards the single ProxySQL node, as long as a single ProxySQL node would be able to handle all of the traffic. 

Another possible solution is to collocate ProxySQL with application nodes and configure the application to connect to the proxy on the localhost. This approach works quite well under the assumption that it is unlikely that ProxySQL will not be available yet the application would work ok on the same node. Typically what we see is either node failure or network failure, which would affect both ProxySQL and application at the same time.

Geo-Distributed MySQL Galera Cluster with ProxySQL

The diagram above shows the version of the environment, where ProxySQL is collocated on the same node as the application. ProxySQL is configured to distribute the workload across all Galera nodes in the local datacenter. One of those nodes would be picked as a node to send the writes to while SELECTs would be distributed across all nodes. Having one dedicated writer node in a datacenter helps to reduce the number of possible certification conflicts, leading to, typically, better performance. To reduce this even further we would have to start sending the traffic over the WAN connection, which is not ideal as the bandwidth utilization would significantly increase. Right now, with segments in place, only two copies of the writeset are being sent across datacenters - one per DC.

The main concern with Galera Cluster geo-distributed deployments is latency. This is something you always have to test prior launching the environment. Am I ok with the commit time? At every commit certification has to happen so writesets have to be sent and certified on all nodes in the cluster, including remote ones. It may be that the high latency will deem the setup unsuitable for your application. In that case you may find multiple Galera clusters connected via asynchronous replication more suitable. This would be a topic for another blog post though.

Deploying a Geo-Distributed Galera Cluster Using ClusterControl

To clarify things, we will show here how a deployment may look like. We won’t use actual multi-DC setup, everything will be deployed in a local lab. We assume that the latency is acceptable and the whole setup is viable. What is great about ClusterControl is that it is infrastructure-agnostic. It doesn’t care if the nodes are close to each other, located in the same datacenter or if the nodes are distributed across multiple cloud providers. As long as there is SSH connectivity from ClusterControl instance to all of the nodes, the deployment process looks exactly the same. That’s why we can show it to you step by step using just local lab.

Installing ClusterControl

First, you have to install ClusterControl. You can download it for free. After registering, you should access the page with guide to download and install ClusterControl. It is as simple as running a shell script. Once you have ClusterControl installed, you will be presented with a form to create an administrative user:

Installing ClusterControl

Once you fill it, you will be presented with a Welcome screen and access to deployment wizards:

ClusterControl Welcome Screen

We’ll go with deploy. This will open a deployment wizard:

ClusterControl Deployment Wizard

We will pick MySQL Galera. We have to pass SSH connectivity details - either root user or sudo user are supported. On the next step we are to define servers in the cluster.

Deploy Database Cluster

We are going to deploy three nodes in one of the data centers. Then we will be able to extend the cluster, configuring new nodes in different segments. For now all we have to do is to click on “Deploy” and watch ClusterControl deploying the Galera cluster.

Cluster List - ClusterControl

Our first three nodes are up and running, we can now proceed to adding additional nodes in other datacenters.

Add a Database Node - ClusterControl

You can do that from the action menu, as shown on the screenshot above.

Add a Database Node - ClusterControl

Here we can add additional nodes, one at a time. What is important, you should change the Galera segment to non-zero (0 is used for the initial three nodes).

After a while we end up with all nine nodes, distributed across three segments.

ClusterControl Geo-Distributed Database Nodes

Now, we have to deploy proxy layer. We will use ProxySQL for that. You can deploy it in ClusterControl via Manage -> Load Balancer:

Add a Load Balancer - ClusterControl

This opens a deployment field:

Deploy Load Balancer - ClusterControl

First, we have to decide where to deploy ProxySQL. We will use existing Galera nodes but you can type anything in the field so it is perfectly possible to deploy ProxySQL on top of the application nodes. In addition, you have to pass access credentials for the administrative and monitoring user.

Deploy Load Balancer - ClusterControl

Then we have to either pick one of existing users in MySQL or create one right now. We also want to ensure that the ProxySQL is configured to use Galera nodes located only in the same datacenter.

When you have one ProxySQL ready in the datacenter, you can use it as a source of the configuration:

Deploy ProxySQL - ClusterControl

This has to be repeated for every application server that you have in all datacenters. Then the application has to be configured to connect to the local ProxySQL instance, ideally over the Unix socket. This comes with the best performance and the lowest latency.

Reducing Latency - ClusterControl

After the last ProxySQL is deployed, our environment is ready. Application nodes connect to local ProxySQL. Each ProxySQL is configured to work with Galera nodes in the same datacenter:

ProxySQL Server Setup - ClusterControl

Conclusion

We hope this two-part series helped you to understand the strengths and weaknesses of geo-distributed Galera Clusters and how ClusterControl makes it very easy to deploy and manage such cluster.

Deploying MySQL Galera Cluster 4.0 onto Amazon AWS EC2

$
0
0

Galera Cluster is one of the most popular high availability solutions for MySQL. It is a virtually synchronous cluster, which helps to keep the replication lag under control. Thanks to the flow control, Galera cluster can throttle itself and allow more loaded nodes to catch up with the rest of the cluster. Recent release of Galera 4 brought new features and improvements. We covered them in blog post talking about MariaDB 10.4 Galera Cluster and a blog post discussing existing and upcoming features of Galera 4.

How does Galera 4 fares when used in Amazon EC2? As you probably know, Amazon offers Relational Database Services, which are designed to provide users with an easy way to deploy highly available MySQL database. My colleague, Ashraf Sharif, compared failover times for RDS MySQL and RDS Aurora in his blog post. Failover times for Aurora looks really great but there are buts. First of all, you are forced to use RDS. You cannot deploy Aurora on the instances you manage. If the existing features and options available in Aurora are not enough for you, you do not have any other option but to deploy something on your own. Here enters Galera. Galera, unlike Aurora, is not a proprietary black box. Contrary, it is an open source software, which can be used freely on all supported environments. You can install Galera Cluster on AWS Elastic Computing Cloud (EC2) and, through that, build a highly available environment where failover is almost instant: as soon as you can detect node’s failure, you can reconnect to the other Galera node. How does one deploy Galera 4 in EC2? In this blog post we will take a look at it and we will provide you with step-by-step guide showing what is the simplest way of accomplishing that.

Deploying a Galera 4 Cluster on EC2

First step is to create an environment which we will use for our Galera cluster. We will go with Ubuntu 18.04 LTS virtual machines.

Deploying a Galera 4 Cluster on EC2

We will go with t2.medium instance size for the purpose of this blog post. You should scale your instances based on the expected load.

Deploying a Galera 4 Cluster on EC2

We are going to deploy three nodes in the cluster. Why three? We have a blog that explains how Galera maintains high availability.

Deploying a Galera 4 Cluster on EC2

We are going to configure storage for those instances.

Deploying a Galera 4 Cluster on EC2

We will also pick proper security group for the nodes. Again, in our case security group is quite open. You should ensure the access is limited as much as possible - only nodes which have to access databases should be allowed to connect to them.

Deploying a Galera 4 Cluster on EC2

Deploying a Galera 4 Cluster on EC2

Finally, we either pick an existing key par or create a new one. After this step our three instances will be launched.

Deploying a Galera 4 Cluster on EC2

Once they are up, we can connect to them via SSH and start configuring the database.

We decided to go with ‘node1, node2, node3’ naming convention therefore we had to edit /etc/hosts on all nodes and list them alongside their respective local IP’s. We also made the change in /etc/hostname to use the new name for nodes. When this is done, we can start setting up our Galera cluster. At the time of writing only vendor that provides GA version of Galera 4 is MariaDB with its 10.4 therefore we are going to use MariaDB 10.4 for our cluster. We are going to proceed with the installation using the suggestions and guides from the MariaDB website.

Deploying a MariaDB 10.4 Galera Cluster

We will start with preparing repositories:

wget https://downloads.mariadb.com/MariaDB/mariadb_repo_setup

bash ./mariadb_repo_setup

We downloaded script which is intended to set up the repositories and we ran it to make sure everything is set up properly. This configured repositories to use the latest MariaDB version, which, at the time of writing, is 10.4.

root@node1:~# apt update

Hit:1 http://eu-central-1.ec2.archive.ubuntu.com/ubuntu bionic InRelease

Hit:2 http://eu-central-1.ec2.archive.ubuntu.com/ubuntu bionic-updates InRelease

Hit:3 http://eu-central-1.ec2.archive.ubuntu.com/ubuntu bionic-backports InRelease

Hit:4 http://downloads.mariadb.com/MariaDB/mariadb-10.4/repo/ubuntu bionic InRelease

Ign:5 http://downloads.mariadb.com/MaxScale/2.4/ubuntu bionic InRelease

Hit:6 http://downloads.mariadb.com/Tools/ubuntu bionic InRelease

Hit:7 http://downloads.mariadb.com/MaxScale/2.4/ubuntu bionic Release

Hit:8 http://security.ubuntu.com/ubuntu bionic-security InRelease

Reading package lists... Done

Building dependency tree

Reading state information... Done

4 packages can be upgraded. Run 'apt list --upgradable' to see them.

As you can see, repositories for MariaDB 10.4 and MaxScale 2.4 have been configured. Now we can proceed and install MariaDB. We will do it step by step, node by node. MariaDB provides guide on how you should install and configure the cluster.

We need to install packages:

apt-get install mariadb-server mariadb-client galera-4 mariadb-backup

This command installs all required packages for MariaDB 10.4 Galera to run. MariaDB creates a set of configuration files. We will add a new one, which would contain all the required settings. By default it will be included at the end of the configuration file so all previous settings for the variables we set will be overwritten. Ideally, afterwards, you would edit existing configuration files to remove settings we put in the galera.cnf to avoid confusion where given setting is configured.

root@node1:~# cat /etc/mysql/conf.d/galera.cnf

[mysqld]

bind-address=10.0.0.103

default_storage_engine=InnoDB

binlog_format=row

innodb_autoinc_lock_mode=2


# Galera cluster configuration

wsrep_on=ON

wsrep_provider=/usr/lib/galera/libgalera_smm.so

wsrep_cluster_address="gcomm://10.0.0.103,10.0.0.130,10.0.0.62"

wsrep_cluster_name="Galera4 cluster"

wsrep_sst_method=mariabackup

wsrep_sst_auth='sstuser:pa55'


# Cluster node configuration

wsrep_node_address="10.0.0.103"

wsrep_node_name="node1"

When configuration is ready, we can start.

root@node1:~# galera_new_cluster

This should bootstrap the new cluster on the first node. Next we should proceed with similar steps on remaining nodes: install required packages and configure them keeping in mind that the local IP changes so we have to change the galera.cnf file accordingly.

When the configuration files are ready, we have to create a user which will be used for the Snapshot State Transfer (SST):

MariaDB [(none)]> CREATE USER 'sstuser'@'localhost' IDENTIFIED BY 'pa55';

Query OK, 0 rows affected (0.022 sec)

MariaDB [(none)]> GRANT PROCESS, RELOAD, LOCK TABLES, REPLICATION CLIENT ON *.* TO 'sstuser'@'localhost';

Query OK, 0 rows affected (0.022 sec)

We should do that on the first node. Remaining nodes will join the cluster and they will receive full state snapshot so the user will be transferred to them. Now the only thing we have to do is to start the remaining nodes:

root@node2:~# service mysql start

root@node3:~# service mysql start

and verify that cluster indeed has been formed:

MariaDB [(none)]> show global status like 'wsrep_cluster_size';

+--------------------+-------+

| Variable_name      | Value |

+--------------------+-------+

| wsrep_cluster_size | 3     |

+--------------------+-------+

1 row in set (0.001 sec)

All is good, the cluster is up and it consists of three Galera nodes. We managed to deploy MariaDB 10.4 Galera Cluster on Amazon EC2.


A Guide to MySQL Galera Cluster Streaming Replication: Part One

$
0
0

Streaming Replication is a new feature which was introduced with the 4.0 release of Galera Cluster. Galera uses replication synchronously across the entire cluster, but before this release write-sets greater than 2GB were not supported. Streaming Replication allows you to now replicate large write-sets, which is perfect for bulk inserts or loading data to your database.

In a previous blog we wrote about Handling Large Transactions with Streaming Replication and MariaDB 10.4, but as of writing this blog Codership had not yet released their version of the new Galera Cluster. Percona has, however, released their experimental binary version of Percona XtraDB Cluster 8.0 which highlights the following features...

  • Streaming Replication supporting large transactions

  • The synchronization functions allow action coordination (wsrep_last_seen_gtid, wsrep_last_written_gtid, wsrep_sync_wait_upto_gtid)

  • More granular and improved error logging. wsrep_debug is now a multi-valued variable to assist in controlling the logging, and logging messages have been significantly improved.

  • Some DML and DDL errors on a replicating node can either be ignored or suppressed. Use the wsrep_ignore_apply_errors variable to configure.

  • Multiple system tables help find out more about the state of the cluster state.

  • The wsrep infrastructure of Galera 4 is more robust than that of Galera 3. It features a faster execution of code with better state handling, improved predictability, and error handling.

What's New With Galera Cluster 4.0?

The New Streaming Replication Feature

With Streaming Replication, transactions are replicated gradually in small fragments during transaction processing (i.e. before actual commit, we replicate a number of small size fragments). Replicated fragments are then applied in slave threads, preserving the transaction’s state in all cluster nodes. Fragments hold locks in all nodes and cannot be conflicted later.

Galera SystemTables 

Database Administrators and clients with access to the MySQL database may read these tables, but they cannot modify them as the database itself will make any modifications needed. If your server doesn’t have these tables, it may be that your server is using an older version of Galera Cluster.

#> show tables from mysql like 'wsrep%';

+--------------------------+

| Tables_in_mysql (wsrep%) |

+--------------------------+

| wsrep_cluster            |

| wsrep_cluster_members    |

| wsrep_streaming_log      |

+--------------------------+

3 rows in set (0.12 sec)

New Synchronization Functions 

This version introduces a series of SQL functions for use in wsrep synchronization operations. You can use them to obtain the Global Transaction ID which is based on either the last write or last seen transaction. You can also set the node to wait for a specific GTID to replicate and apply, before initiating the next transaction.

Intelligent Donor Selection

Some understated features that have been present since Galera 3.x include intelligent donor selection and cluster crash recovery. These were originally planned for Galera 4, but made it into earlier releases largely due to customer requirements. When it comes to donor node selection in Galera 3, the State Snapshot Transfer (SST) donor was selected at random. However with Galera 4, you get a much more intelligent choice when it comes to choosing a donor, as it will favour a donor that can provide an Incremental State Transfer (IST), or pick a donor in the same segment. As a Database Administrator, you can force this via setting wsrep_sst_donor.

Why Use MySQL Galera Cluster Streaming Replication?

Long-Running Transactions

Galera's problems and limitations always revolved around how it handled long-running transactions and oftentimes caused the entire cluster to slow down due to large write-sets being replicated. It's flow control often goes high, causing the writes to slow down or even terminating the process in order to revert the cluster back to its normal state. This is a pretty common issue with previous versions of Galera Cluster.

Codership advises to use Streaming Replication for your long-running transactions to mitigate these situations. Once the node replicates and certifies a fragment, it is no longer possible for other transactions to abort it.

Large Transactions

This is very helpful when loading data to your report or analytics. Creating bulk inserts, deletes, updates, or using LOAD DATA statement to load large quantity of data can fall down in this category. Although it depends on how your manage your data for retrieval or storage. You must take into account that Streaming Replication has its limitations such that certification keys are generated from record locks. 

Without Streaming Replication, updating a large number of records would result in a conflict and the whole transaction would have to be rolled back. Slaves that are also replicating large transactions are subject to the flow control as it hits the threshold and starts slowing down the entire cluster to process any writes as they tend to relax receiving incoming transactions from the synchronous replication. Galera will relax the replication until the write-set is manageable as it allows to continue replication again. Check this external blog by Percona to help you understand more about flow control within Galera.

With Streaming Replication, the node begins to replicate the data with each transaction fragment, rather than waiting for the commit. This means that there's no way for any conflicting transactions running within the other nodes to abort since this simply affirms that the cluster has certified the write-set for this particular fragment. It’s free to apply and commit other concurrent transactions without blocking and process large transaction with a minimal impact on the cluster.

Hot Records/Hot Spots

Hot records or rows are those rows in your table that gets constantly get updated. These data could be the most visited and highly gets the traffic of your entire database (e.g. news feeds, a counter such as number of visits or logs). With Streaming Replication, you can force critical updates to the entire cluster. 

As noted by the Galera Team at Codership

“Running a transaction in this way effectively locks the hot record on all nodes, preventing other transactions from modifying the row. It also increases the chances that the transaction will commit successfully and that the client in turn will receive the desired outcome.”

This comes with limitations as it might not be persistent and consistent that you'll have successful commits. Without using Streaming Replication, you'll end up high chances or rollbacks and that could add overhead to the end user when experiencing this issue in the application's perspective.

Things to Consider When Using Streaming Replication

  • Certification keys are generated from record locks, therefore they don’t cover gap locks or next key locks. If the transaction takes a gap lock, it is possible that a transaction, which is executed on another node, will apply a write set which encounters the gap log and will abort the streaming transaction.
  • When enabling Streaming Replication, write-set logs are written to wsrep_streaming_log table found in the mysql system database to preserve persistence in case crash occurs, so this table serves upon recovery. In case of excessive logging and elevated replication overhead, streaming replication will cause degraded transaction throughput rate. This could be a performance bottleneck when high peak load is reached. As such, it’s recommended that you only enable Streaming Replication at a session-level and then only for transactions that would not run correctly without it.
  • Best use case is to use streaming replication for cutting large transactions
  • Set fragment size to ~10K rows
  • Fragment variables are session variables and can be dynamically set
  • Intelligent application can set streaming replication on/off on need basis

Conclusion

Thanks for reading, in part two we will discuss how to enable Galera Cluster Streaming Replication and what the results could look like for your setup.


A Guide to MySQL Galera Cluster Streaming Replication: Part Two

$
0
0

In the first part of this blog we provided an overview of the new Streaming Replication feature in MySQL Galera Cluster. In this blog we will show you how to enable it and take a look at the results.

Enabling Streaming Replication

It is highly recommended that you enable Streaming Replication at a session-level for the specific transactions that interact with your application/client. 

As stated in the previous blog, Galera logs its write-sets to the wsrep_streaming_log table in MySQL database. This has the potential to create a performance bottleneck, especially when a rollback is needed. This doesn't mean that you can’t use Streaming Replication, it just means you need to design your application client efficiently when using Streaming Replication so you’ll get better performance. Still, it's best to have Streaming Replication for dealing with and cutting down large transactions.

Enabling Streaming Replication requires you to define the replication unit and number of units to use in forming the transaction fragments. Two parameters control these variables: wsrep_trx_fragment_unit and wsrep_trx_fragment_size.

Below is an example of how to set these two parameters:

SET SESSION wsrep_trx_fragment_unit='statements';

SET SESSION wsrep_trx_fragment_size=3;

In this example, the fragment is set to three statements. For every three statements from a transaction, the node will generate, replicate, and certify a fragment.

You can choose between a few replication units when forming fragments:

  • bytes - This defines the fragment size in bytes.
  • rows- This defines the fragment size as the number of rows the fragment updates.
  • statements- This defines the fragment size as the number of statements in a fragment.

Choose the replication unit and fragment size that best suits the specific operation you want to run.

Streaming Replication In Action

As discussed in our other blog on handling large transactions in Mariadb 10.4, we performed and tested how Streaming Replication performed when enabled based on this criteria...

  1. Baseline, set global wsrep_trx_fragment_size=0;
  2. set global wsrep_trx_fragment_unit='rows'; set global wsrep_trx_fragment_size=1;
  3. set global wsrep_trx_fragment_unit='statements'; set global wsrep_trx_fragment_size=1;
  4. set global wsrep_trx_fragment_unit='statements'; set global wsrep_trx_fragment_size=5;

And results are

Transactions: 82.91 per sec., queries: 1658.27 per sec. (100%)

Transactions: 54.72 per sec., queries: 1094.43 per sec. (66%)

Transactions: 54.76 per sec., queries: 1095.18 per sec. (66%)

Transactions: 70.93 per sec., queries: 1418.55 per sec. (86%)

For this example we're using Percona XtraDB Cluster 8.0.15 straight from their testing branch using the Percona-XtraDB-Cluster_8.0.15.5-27dev.4.2_Linux.x86_64.ssl102.tar.gz build. 

We then tried a 3-node Galera cluster with hosts info below:

testnode11 = 192.168.10.110

testnode12 = 192.168.10.120

testnode13 = 192.168.10.130

We pre-populated a table from my sysbench database and tried to delete a very large rows. 

root@testnode11[sbtest]#> select count(*) from sbtest1;

+----------+

| count(*) |

+----------+

| 12608218 |

+----------+

1 row in set (25.55 sec)

At first, running without Streaming Replication,

root@testnode12[sbtest]#> select @@wsrep_trx_fragment_unit, @@wsrep_trx_fragment_size,  @@innodb_lock_wait_timeout;

+---------------------------+---------------------------+----------------------------+

| @@wsrep_trx_fragment_unit | @@wsrep_trx_fragment_size | @@innodb_lock_wait_timeout |

+---------------------------+---------------------------+----------------------------+

| bytes                     | 0 |                         50000 |

+---------------------------+---------------------------+----------------------------+

1 row in set (0.00 sec)

Then run,

root@testnode11[sbtest]#> delete from sbtest1 where id >= 2000000;

However, we ended up getting a rollback...

---TRANSACTION 648910, ACTIVE 573 sec rollback

mysql tables in use 1, locked 1

ROLLING BACK 164858 lock struct(s), heap size 18637008, 12199395 row lock(s), undo log entries 11961589

MySQL thread id 183, OS thread handle 140041167468288, query id 79286 localhost 127.0.0.1 root wsrep: replicating and certifying write set(-1)

delete from sbtest1 where id >= 2000000

Using ClusterControl Dashboards to gather an overview of any indication of flow control, since the transaction runs solely on the master (active-writer) node until commit time, there's no any indication of activity for flow control:

ClusterControl Galera Cluster Overview

In case you’re wondering, the current version of ClusterControl does not yet have direct support for PXC 8.0 with Galera Cluster 4 (as it is still experimental). You can, however, try to import it... but it needs minor tweaks to make your Dashboards work correctly. 

Back to the query process. It failed as it rolled back!

root@testnode11[sbtest]#> delete from sbtest1 where id >= 2000000;

ERROR 1180 (HY000): Got error 5 - 'Transaction size exceed set threshold' during COMMIT

regardless of the wsrep_max_ws_rows or wsrep_max_ws_size,

root@testnode11[sbtest]#> select @@global.wsrep_max_ws_rows, @@global.wsrep_max_ws_size/(1024*1024*1024);

+----------------------------+---------------------------------------------+

| @@global.wsrep_max_ws_rows | @@global.wsrep_max_ws_size/(1024*1024*1024) |

+----------------------------+---------------------------------------------+

|                          0 |               2.0000 |

+----------------------------+---------------------------------------------+

1 row in set (0.00 sec)

It did, eventually, reach the threshold.

During this time the system table mysql.wsrep_streaming_log is empty, which indicates that Streaming Replication is not happening or enabled,

root@testnode12[sbtest]#> select count(*) from mysql.wsrep_streaming_log;

+----------+

| count(*) |

+----------+

|        0 |

+----------+

1 row in set (0.01 sec)


root@testnode13[sbtest]#> select count(*) from mysql.wsrep_streaming_log;

+----------+

| count(*) |

+----------+

|        0 |

+----------+

1 row in set (0.00 sec)

and that is verified on the other 2 nodes (testnode12 and testnode13).

Now, let's try enabling it with Streaming Replication,

root@testnode11[sbtest]#> select @@wsrep_trx_fragment_unit, @@wsrep_trx_fragment_size, @@innodb_lock_wait_timeout;

+---------------------------+---------------------------+----------------------------+

| @@wsrep_trx_fragment_unit | @@wsrep_trx_fragment_size | @@innodb_lock_wait_timeout |

+---------------------------+---------------------------+----------------------------+

| bytes                     | 0 |                      50000 |

+---------------------------+---------------------------+----------------------------+

1 row in set (0.00 sec)


root@testnode11[sbtest]#> set wsrep_trx_fragment_unit='rows'; set wsrep_trx_fragment_size=100; 

Query OK, 0 rows affected (0.00 sec)


Query OK, 0 rows affected (0.00 sec)


root@testnode11[sbtest]#> select @@wsrep_trx_fragment_unit, @@wsrep_trx_fragment_size, @@innodb_lock_wait_timeout;

+---------------------------+---------------------------+----------------------------+

| @@wsrep_trx_fragment_unit | @@wsrep_trx_fragment_size | @@innodb_lock_wait_timeout |

+---------------------------+---------------------------+----------------------------+

| rows                      | 100 |                      50000 |

+---------------------------+---------------------------+----------------------------+

1 row in set (0.00 sec)

What to Expect When Galera Cluster Streaming Replication is Enabled? 

When query has been performed in testnode11,

root@testnode11[sbtest]#> delete from sbtest1 where id >= 2000000;

What happens is that it fragments the transaction piece by piece depending on the set value of variable wsrep_trx_fragment_size. Let's check this in the other nodes:

Host testnode12

root@testnode12[sbtest]#> pager sed -n '/TRANSACTIONS/,/FILE I\/O/p'; show engine innodb status\G nopager; show global status like 'wsrep%flow%'; select count(*) from mysql.wsrep_streaming_log;

PAGER set to 'sed -n '/TRANSACTIONS/,/FILE I\/O/p''

TRANSACTIONS

------------

Trx id counter 567148

Purge done for trx's n:o < 566636 undo n:o < 0 state: running but idle

History list length 44

LIST OF TRANSACTIONS FOR EACH SESSION:

..

...

---TRANSACTION 421740651985200, not started

0 lock struct(s), heap size 1136, 0 row lock(s)

---TRANSACTION 553661, ACTIVE 190 sec

18393 lock struct(s), heap size 2089168, 1342600 row lock(s), undo log entries 1342600

MySQL thread id 898, OS thread handle 140266050008832, query id 216824 wsrep: applied write set (-1)

--------

FILE I/O

1 row in set (0.08 sec)


PAGER set to stdout

+----------------------------------+--------------+

| Variable_name                    | Value |

+----------------------------------+--------------+

| wsrep_flow_control_paused_ns     | 211197844753 |

| wsrep_flow_control_paused        | 0.133786 |

| wsrep_flow_control_sent          | 633 |

| wsrep_flow_control_recv          | 878 |

| wsrep_flow_control_interval      | [ 173, 173 ] |

| wsrep_flow_control_interval_low  | 173 |

| wsrep_flow_control_interval_high | 173          |

| wsrep_flow_control_status        | OFF |

+----------------------------------+--------------+

8 rows in set (0.00 sec)


+----------+

| count(*) |

+----------+

|    13429 |

+----------+

1 row in set (0.04 sec)


Host testnode13

root@testnode13[sbtest]#> pager sed -n '/TRANSACTIONS/,/FILE I\/O/p'; show engine innodb status\G nopager; show global status like 'wsrep%flow%'; select count(*) from mysql.wsrep_streaming_log;

PAGER set to 'sed -n '/TRANSACTIONS/,/FILE I\/O/p''

TRANSACTIONS

------------

Trx id counter 568523

Purge done for trx's n:o < 567824 undo n:o < 0 state: running but idle

History list length 23

LIST OF TRANSACTIONS FOR EACH SESSION:

..

...

---TRANSACTION 552701, ACTIVE 216 sec

21587 lock struct(s), heap size 2449616, 1575700 row lock(s), undo log entries 1575700

MySQL thread id 936, OS thread handle 140188019226368, query id 600980 wsrep: applied write set (-1)

--------

FILE I/O

1 row in set (0.28 sec)


PAGER set to stdout

+----------------------------------+--------------+

| Variable_name                    | Value |

+----------------------------------+--------------+

| wsrep_flow_control_paused_ns     | 210755642443 |

| wsrep_flow_control_paused        | 0.0231273 |

| wsrep_flow_control_sent          | 1653 |

| wsrep_flow_control_recv          | 3857 |

| wsrep_flow_control_interval      | [ 173, 173 ] |

| wsrep_flow_control_interval_low  | 173 |

| wsrep_flow_control_interval_high | 173          |

| wsrep_flow_control_status        | OFF |

+----------------------------------+--------------+

8 rows in set (0.01 sec)


+----------+

| count(*) |

+----------+

|    15758 |

+----------+

1 row in set (0.03 sec)

Noticeably, the flow control just kicked in!

ClusterControl Galera Cluster Overview

And WSREP queues send/received has been kicking as well:

 
ClusterControl Galera Overview
Host testnode12 (192.168.10.120)
ClusterControl Galera Overview
 Host testnode13 (192.168.10.130)

Now, let's elaborate more of the result from the mysql.wsrep_streaming_log table,

root@testnode11[sbtest]#> pager sed -n '/TRANSACTIONS/,/FILE I\/O/p'|tail -8; show engine innodb status\G nopager;

PAGER set to 'sed -n '/TRANSACTIONS/,/FILE I\/O/p'|tail -8'

MySQL thread id 134822, OS thread handle 140041167468288, query id 0 System lock

---TRANSACTION 649008, ACTIVE 481 sec

mysql tables in use 1, locked 1

53104 lock struct(s), heap size 6004944, 3929602 row lock(s), undo log entries 3876500

MySQL thread id 183, OS thread handle 140041167468288, query id 105367 localhost 127.0.0.1 root updating

delete from sbtest1 where id >= 2000000

--------

FILE I/O

1 row in set (0.01 sec)

then taking the result of,

root@testnode12[sbtest]#> select count(*) from mysql.wsrep_streaming_log;

+----------+

| count(*) |

+----------+

|    38899 |

+----------+

1 row in set (0.40 sec)

It tells how much fragment has been replicated using Streaming Replication. Now, let's do some basic math:

root@testnode12[sbtest]#> select 3876500/38899.0;

+-----------------+

| 3876500/38899.0 |

+-----------------+

|         99.6555 |

+-----------------+

1 row in set (0.03 sec)

I'm taking the undo log entries from theSHOW ENGINE INNODB STATUS\G result and then divide the total count of the mysql.wsrep_streaming_log records. As I've set it earlier, I defined wsrep_trx_fragment_size= 100. The result will show you how much the total replicated logs are currently being processed by Galera.

It’s important to take note at what Streaming Replication is trying to achieve... "the node breaks the transaction into fragments, then certifies and replicates them on the slaves while the transaction is still in progress. Once certified, the fragment can no longer be aborted by conflicting transactions."

The fragments are considered transactions, which have been passed to the remaining nodes within the cluster, certifying the fragmented transaction, then applying the write-sets. This means that once your large transaction has been certified or prioritized, all incoming connections that could possibly have a deadlock will need to wait until the transactions finishes.

Now, the verdict of deleting a huge table? 

root@testnode11[sbtest]#> delete from sbtest1 where id >= 2000000;

Query OK, 12034538 rows affected (30 min 36.96 sec)

It finishes successfully without any failure!

How does it look like in the other nodes? In testnode12,

root@testnode12[sbtest]#> pager sed -n '/TRANSACTIONS/,/FILE I\/O/p'|tail -8; show engine innodb status\G nopager; show global status like 'wsrep%flow%'; select count(*) from mysql.wsrep_streaming_log;

PAGER set to 'sed -n '/TRANSACTIONS/,/FILE I\/O/p'|tail -8'

0 lock struct(s), heap size 1136, 0 row lock(s)

---TRANSACTION 421740651985200, not started

0 lock struct(s), heap size 1136, 0 row lock(s)

---TRANSACTION 553661, ACTIVE (PREPARED) 2050 sec

165631 lock struct(s), heap size 18735312, 12154883 row lock(s), undo log entries 12154883

MySQL thread id 898, OS thread handle 140266050008832, query id 341835 wsrep: preparing to commit write set(215510)

--------

FILE I/O

1 row in set (0.46 sec)


PAGER set to stdout

+----------------------------------+--------------+

| Variable_name                    | Value |

+----------------------------------+--------------+

| wsrep_flow_control_paused_ns     | 290832524304 |

| wsrep_flow_control_paused        | 0 |

| wsrep_flow_control_sent          | 0 |

| wsrep_flow_control_recv          | 0 |

| wsrep_flow_control_interval      | [ 173, 173 ] |

| wsrep_flow_control_interval_low  | 173 |

| wsrep_flow_control_interval_high | 173          |

| wsrep_flow_control_status        | OFF |

+----------------------------------+--------------+

8 rows in set (0.53 sec)


+----------+

| count(*) |

+----------+

|   120345 |

+----------+

1 row in set (0.88 sec)

It stops at a total of 120345 fragments, and if we do the math again on the last captured undo log entries (undo logs are the same from the master as well),

root@testnode12[sbtest]#> select 12154883/120345.0;                                                                                                                                                   +-------------------+

| 12154883/120345.0 |

+-------------------+

|          101.0003 |

+-------------------+

1 row in set (0.00 sec)

So we had a total of 120345 transactions being fragmented to delete 12034538 rows.

Once you're done using or enabling Stream Replication, do not forget to disable it as it will always log huge transactions and adds a lot of performance overhead to your cluster. To disable it, just run

root@testnode11[sbtest]#> set wsrep_trx_fragment_size=0;

Query OK, 0 rows affected (0.04 sec)

Conclusion

With Streaming Replication enabled, it's important that you are able to identify how large your fragment size can be and what unit you have to choose (bytes, rows, statements). 

It is also very important that you need to run it at session-level and of course identify when you only need to use Streaming Replication. 

While performing these tests, deleting a large number of rows to a huge table with Streaming Replication enabled has noticeably caused a high peak of disk utilization and CPU utilization. The RAM was more stable, but this could due to the statement we performed is not highly a memory contention. 

It’s safe to say that Streaming Replication can cause performance bottlenecks when dealing with large records, so using it should be done with proper decision and care. 

Lastly, if you are using Streaming Replication, do not forget to always disable this once done on that current session to avoid unwanted problems.


Deploying a Highly Available Nextcloud with MySQL Galera Cluster and GlusterFS

$
0
0

Nextcloud is an open source file sync and share application that offers free, secure, and easily accessible cloud file storage, as well as a number of tools that extend its feature set. It's very similar to the popular Dropbox, iCloud and Google Drive but unlike Dropbox, Nextcloud does not offer off-premises file storage hosting. 

Nextcloud Logo

In this blog post, we are going to deploy a high-available setup for our private "Dropbox" infrastructure using Nextcloud, GlusterFS, Percona XtraDB Cluster (MySQL Galera Cluster), ProxySQL with ClusterControl as the automation tool to manage and monitor the database and load balancer tiers. 

Note: You can also use MariaDB Cluster, which uses the same underlying replication library as in Percona XtraDB Cluster. From a load balancer perspective, ProxySQL behaves similarly to MaxScale in that it can understand the SQL traffic and has fine-grained control on how traffic is routed. 

Database Architecture for Nexcloud

In this blog post, we used a total of 6 nodes.

  • 2 x proxy servers 
  • 3 x database + application servers
  • 1 x controller server (ClusterControl)

The following diagram illustrates our final setup:

Highly Available MySQL Nextcloud Database Architecture

For Percona XtraDB Cluster, a minimum of 3 nodes is required for a solid multi-master replication. Nextcloud applications are co-located within the database servers, thus GlusterFS has to be configured on those hosts as well. 

Load balancer tier consists of 2 nodes for redundancy purposes. We will use ClusterControl to deploy the database tier and the load balancer tiers. All servers are running on CentOS 7 with the following /etc/hosts definition on every node:

192.168.0.21 nextcloud1 db1

192.168.0.22 nextcloud2 db2

192.168.0.23 nextcloud3 db3

192.168.0.10 vip db

192.168.0.11 proxy1 lb1 proxysql1

192.168.0.12 proxy2 lb2 proxysql2

Note that GlusterFS and MySQL are highly intensive processes. If you are following this setup (GlusterFS and MySQL resides in a single server), ensure you have decent hardware specs for the servers.

Nextcloud Database Deployment

We will start with database deployment for our three-node Percona XtraDB Cluster using ClusterControl. Install ClusterControl and then setup passwordless SSH to all nodes that are going to be managed by ClusterControl (3 PXC + 2 proxies). On ClusterControl node, do:

$ whoami

root

$ ssh-copy-id 192.168.0.11

$ ssh-copy-id 192.168.0.12

$ ssh-copy-id 192.168.0.21

$ ssh-copy-id 192.168.0.22

$ ssh-copy-id 192.168.0.23

**Enter the root password for the respective host when prompted.

Open a web browser and go to https://{ClusterControl-IP-address}/clustercontrol and create a super user. Then go to Deploy -> MySQL Galera. Follow the deployment wizard accordingly. At the second stage 'Define MySQL Servers', pick Percona XtraDB 5.7 and specify the IP address for every database node. Make sure you get a green tick after entering the database node details, as shown below:

Deploy a Nextcloud Database Cluster

Click "Deploy" to start the deployment. The database cluster will be ready in 15~20 minutes. You can follow the deployment progress at Activity -> Jobs -> Create Cluster -> Full Job Details. The cluster will be listed under Database Cluster dashboard once deployed.

We can now proceed to database load balancer deployment.

Nextcloud Database Load Balancer Deployment

Nextcloud is recommended to run on a single-writer setup, where writes will be processed by one master at a time, and the reads can be distributed to other nodes. We can use ProxySQL 2.0 to achieve this configuration since it can route the write queries to a single master. 

To deploy a ProxySQL, click on Cluster Actions > Add Load Balancer > ProxySQL > Deploy ProxySQL. Enter the required information as highlighted by the red arrows:

Deploy ProxySQL for Nextcloud

Fill in all necessary details as highlighted by the arrows above. The server address is the lb1 server, 192.168.0.11. Further down, we specify the ProxySQL admin and monitoring users' password. Then include all MySQL servers into the load balancing set and then choose "No" in the Implicit Transactions section. Click "Deploy ProxySQL" to start the deployment.

Repeat the same steps as above for the secondary load balancer, lb2 (but change the "Server Address" to lb2's IP address). Otherwise, we would have no redundancy in this layer.

Our ProxySQL nodes are now installed and configured with two host groups for Galera Cluster. One for the single-master group (hostgroup 10), where all connections will be forwarded to one Galera node (this is useful to prevent multi-master deadlocks) and the multi-master group (hostgroup 20) for all read-only workloads which will be balanced to all backend MySQL servers.

Next, we need to deploy a virtual IP address to provide a single endpoint for our ProxySQL nodes so your application will not need to define two different ProxySQL hosts. This will also provide automatic failover capabilities because virtual IP address will be taken over by the backup ProxySQL node in case something goes wrong to the primary ProxySQL node.

Go to ClusterControl -> Manage -> Load Balancers -> Keepalived -> Deploy Keepalived. Pick "ProxySQL" as the load balancer type and choose two distinct ProxySQL servers from the dropdown. Then specify the virtual IP address as well as the network interface that it will listen to, as shown in the following example:

Deploy Keepalived & ProxySQL for Nextcloud

Once the deployment completes, you should see the following details on the cluster's summary bar:

Nextcloud Database Cluster in ClusterControl

Finally, create a new database for our application by going to ClusterControl -> Manage -> Schemas and Users -> Create Database and specify "nextcloud". ClusterControl will create this database on every Galera node. Our load balancer tier is now complete.

GlusterFS Deployment for Nextcloud

The following steps should be performed on nextcloud1, nextcloud2, nextcloud3 unless otherwise specified.

Step One

It's recommended to have a separate this for GlusterFS storage, so we are going to add additional disk under /dev/sdb and create a new partition:

$ fdisk /dev/sdb

Follow the fdisk partition creation wizard by pressing the following key:

n > p > Enter > Enter > Enter > w

Step Two

Verify if /dev/sdb1 has been created:

$ fdisk -l /dev/sdb1

Disk /dev/sdb1: 8588 MB, 8588886016 bytes, 16775168 sectors

Units = sectors of 1 * 512 = 512 bytes

Sector size (logical/physical): 512 bytes / 512 bytes

I/O size (minimum/optimal): 512 bytes / 512 bytes

Step Three

Format the partition with XFS:

$ mkfs.xfs /dev/sdb1

Step Four

Mount the partition as /storage/brick:

$ mkdir /glusterfs

$ mount /dev/sdb1 /glusterfs

Verify that all nodes have the following layout:

$ lsblk

NAME   MAJ:MIN RM SIZE RO TYPE MOUNTPOINT

sda      8:0 0 40G  0 disk

└─sda1   8:1 0 40G  0 part /

sdb      8:16 0   8G 0 disk

└─sdb1   8:17 0   8G 0 part /glusterfs

Step Five

Create a subdirectory called brick under /glusterfs:

$ mkdir /glusterfs/brick

Step Six

For application redundancy, we can use GlusterFS for file replication between the hosts. Firstly, install GlusterFS repository for CentOS:

$ yum install centos-release-gluster -y

$ yum install epel-release -y

Step Seven

Install GlusterFS server

$ yum install glusterfs-server -y

Step Eight

Enable and start gluster daemon:

$ systemctl enable glusterd

$ systemctl start glusterd

Step Nine

On nextcloud1, probe the other nodes:

(nextcloud1)$ gluster peer probe 192.168.0.22

(nextcloud1)$ gluster peer probe 192.168.0.23

You can verify the peer status with the following command:

(nextcloud1)$ gluster peer status

Number of Peers: 2


Hostname: 192.168.0.22

Uuid: f9d2928a-6b64-455a-9e0e-654a1ebbc320

State: Peer in Cluster (Connected)


Hostname: 192.168.0.23

Uuid: 100b7778-459d-4c48-9ea8-bb8fe33d9493

State: Peer in Cluster (Connected)

Step Ten

On nextcloud1, create a replicated volume on probed nodes:

(nextcloud1)$ gluster volume create rep-volume replica 3 192.168.0.21:/glusterfs/brick 192.168.0.22:/glusterfs/brick 192.168.0.23:/glusterfs/brick

volume create: rep-volume: success: please start the volume to access data

Step Eleven

Start the replicated volume on nextcloud1:

(nextcloud1)$ gluster volume start rep-volume

volume start: rep-volume: success

Verify the replicated volume and processes are online:

$ gluster volume status

Status of volume: rep-volume

Gluster process                             TCP Port RDMA Port Online Pid

------------------------------------------------------------------------------

Brick 192.168.0.21:/glusterfs/brick         49152 0 Y 32570

Brick 192.168.0.22:/glusterfs/brick         49152 0 Y 27175

Brick 192.168.0.23:/glusterfs/brick         49152 0 Y 25799

Self-heal Daemon on localhost               N/A N/A Y 32591

Self-heal Daemon on 192.168.0.22            N/A N/A Y 27196

Self-heal Daemon on 192.168.0.23            N/A N/A Y 25820


Task Status of Volume rep-volume

------------------------------------------------------------------------------

There are no active volume tasks

Step Twelve

Mount the replicated volume on /var/www/html. Create the directory:

$ mkdir -p /var/www/html

Step Thirteen

13) Add following line into /etc/fstab to allow auto-mount:

/dev/sdb1 /glusterfs xfs defaults,defaults 0 0

localhost:/rep-volume /var/www/html   glusterfs defaults,_netdev 0 0

Step Fourteen

Mount the GlusterFS to /var/www/html:

$ mount -a

And verify with:

$ mount | grep gluster

/dev/sdb1 on /glusterfs type xfs (rw,relatime,seclabel,attr2,inode64,noquota)

localhost:/rep-volume on /var/www/html type fuse.glusterfs (rw,relatime,user_id=0,group_id=0,default_permissions,allow_other,max_read=131072)

The replicated volume is now ready and mounted in every node. We can now proceed to deploy the application.

Nextcloud Application Deployment

The following steps should be performed on nextcloud1, nextcloud2 and nextcloud3 unless otherwise specified.

Nextcloud requires PHP 7.2 and later and for CentOS distribution, we have to enable a number of repositories like EPEL and Remi to simplify the installation process.

Step One

If SELinux is enabled, disable it first:

$ setenforce 0

$ sed -i 's/^SELINUX=.*/SELINUX=permissive/g' /etc/selinux/config

You can also run Nextcloud with SELinux enabled by following this guide.

Step Two

Install Nextcloud requirements and enable Remi repository for PHP 7.2:

$ yum install -y epel-release yum-utils unzip curl wget bash-completion policycoreutils-python mlocate bzip2

$ yum install -y http://rpms.remirepo.net/enterprise/remi-release-7.rpm

$ yum-config-manager --enable remi-php72

Step Three

Install Nextcloud dependencies, mostly Apache and PHP 7.2 related packages:

$ yum install -y httpd php72-php php72-php-gd php72-php-intl php72-php-mbstring php72-php-mysqlnd php72-php-opcache php72-php-pecl-redis php72-php-pecl-apcu php72-php-pecl-imagick php72-php-xml php72-php-pecl-zip

Step Four

Enable Apache and start it up:

$ systemctl enable httpd.service

$ systemctl start httpd.service

Step Five

Make a symbolic link for PHP to use PHP 7.2 binary:

$ ln -sf /bin/php72 /bin/php

Step Six

On nextcloud1, download Nextcloud Server from here and extract it:

$ wget https://download.nextcloud.com/server/releases/nextcloud-17.0.0.zip

$ unzip nextcloud*

Step Seven

On nextcloud1, copy the directory into /var/www/html and assign correct ownership:

$ cp -Rf nextcloud /var/www/html

$ chown -Rf apache:apache /var/www/html

**Note the copying process into /var/www/html is going to take some time due to GlusterFS volume replication.

Step Eight

Before we proceed to open the installation wizard, we have to disable pxc_strict_mode variable to other than "ENFORCING" (the default value). This is due to the fact that Nextcloud database import will have a number of tables without primary key defined which is not recommended to run on Galera Cluster. This is explained further details under Tuning section further down.

To change the configuration with ClusterControl, simply go to Manage -> Configurations -> Change/Set Parameters:

Change Set Parameters - ClusterControl

Choose all database instances from the list, and enter:

  • Group: MYSQLD
  • Parameter: pxc_strict_mode
  • New Value: PERMISSIVE

ClusterControl will perform the necessary changes on every database node automatically. If the value can be changed during runtime, it will be effective immediately. ClusterControl also configure the value inside MySQL configuration file for persistency. You should see the following result:

Change Set Parameter - ClusterControl

Step Nine

Now we are ready to configure our Nextcloud installation. Open the browser and go to nextcloud1's HTTP server at http://192.168.0.21/nextcloud/ and you will be presented with the following configuration wizard:

Nextcloud Account Setup

Configure the "Storage & database" section with the following value:

  • Data folder: /var/www/html/nextcloud/data
  • Configure the database: MySQL/MariaDB
  • Username: nextcloud
  • Password: (the password for user nextcloud)
  • Database: nextcloud
  • Host: 192.168.0.10:6603 (The virtual IP address with ProxySQL port)

Click "Finish Setup" to start the configuration process. Wait until it finishes and you will be redirected to Nextcloud dashboard for user "admin". The installation is now complete. Next section provides some tuning tips to run efficiently with Galera Cluster.

Nextcloud Database Tuning

Primary Key

Having a primary key on every table is vital for Galera Cluster write-set replication. For a relatively big table without primary key, large update or delete transaction would completely block your cluster for a very long time. To avoid any quirks and edge cases, simply make sure that all tables are using InnoDB storage engine with an explicit primary key (unique key does not count).

The default installation of Nextcloud will create a bunch of tables under the specified database and some of them do not comply with this rule. To check if the tables are compatible with Galera, we can run the following statement:

mysql> SELECT DISTINCT CONCAT(t.table_schema,'.',t.table_name) as tbl, t.engine, IF(ISNULL(c.constraint_name),'NOPK','') AS nopk, IF(s.index_type = 'FULLTEXT','FULLTEXT','') as ftidx, IF(s.index_type = 'SPATIAL','SPATIAL','') as gisidx FROM information_schema.tables AS t LEFT JOIN information_schema.key_column_usage AS c ON (t.table_schema = c.constraint_schema AND t.table_name = c.table_name AND c.constraint_name = 'PRIMARY') LEFT JOIN information_schema.statistics AS s ON (t.table_schema = s.table_schema AND t.table_name = s.table_name AND s.index_type IN ('FULLTEXT','SPATIAL'))   WHERE t.table_schema NOT IN ('information_schema','performance_schema','mysql') AND t.table_type = 'BASE TABLE' AND (t.engine <> 'InnoDB' OR c.constraint_name IS NULL OR s.index_type IN ('FULLTEXT','SPATIAL')) ORDER BY t.table_schema,t.table_name;

+---------------------------------------+--------+------+-------+--------+

| tbl                                   | engine | nopk | ftidx | gisidx |

+---------------------------------------+--------+------+-------+--------+

| nextcloud.oc_collres_accesscache      | InnoDB | NOPK | | |

| nextcloud.oc_collres_resources        | InnoDB | NOPK | | |

| nextcloud.oc_comments_read_markers    | InnoDB | NOPK | | |

| nextcloud.oc_federated_reshares       | InnoDB | NOPK | | |

| nextcloud.oc_filecache_extended       | InnoDB | NOPK | | |

| nextcloud.oc_notifications_pushtokens | InnoDB | NOPK |       | |

| nextcloud.oc_systemtag_object_mapping | InnoDB | NOPK |       | |

+---------------------------------------+--------+------+-------+--------+

The above output shows there are 7 tables that do not have a primary key defined. To fix the above, simply add a primary key with auto-increment column. Run the following commands on one of the database servers, for example nexcloud1:

(nextcloud1)$ mysql -uroot -p

mysql> ALTER TABLE nextcloud.oc_collres_accesscache ADD COLUMN `id` INT PRIMARY KEY AUTO_INCREMENT;

mysql> ALTER TABLE nextcloud.oc_collres_resources ADD COLUMN `id` INT PRIMARY KEY AUTO_INCREMENT;

mysql> ALTER TABLE nextcloud.oc_comments_read_markers ADD COLUMN `id` INT PRIMARY KEY AUTO_INCREMENT;

mysql> ALTER TABLE nextcloud.oc_federated_reshares ADD COLUMN `id` INT PRIMARY KEY AUTO_INCREMENT;

mysql> ALTER TABLE nextcloud.oc_filecache_extended ADD COLUMN `id` INT PRIMARY KEY AUTO_INCREMENT;

mysql> ALTER TABLE nextcloud.oc_notifications_pushtokens ADD COLUMN `id` INT PRIMARY KEY AUTO_INCREMENT;

mysql> ALTER TABLE nextcloud.oc_systemtag_object_mapping ADD COLUMN `id` INT PRIMARY KEY AUTO_INCREMENT;

Once the above modifications have been applied, we can reconfigure back the pxc_strict_mode to the recommended value, "ENFORCING". Repeat step #8 under "Application Deployment" section with the corresponding value.

READ-COMMITTED Isolation Level

The recommended transaction isolation level as advised by Nextcloud is to use READ-COMMITTED, while Galera Cluster is default to stricter REPEATABLE-READ isolation level. Using READ-COMMITTED can avoid data loss under high load scenarios (e.g. by using the sync client with many clients/users and many parallel operations).

To modify the transaction level, go to ClusterControl -> Manage -> Configurations -> Change/Set Parameter and specify the following:

Nextcloud Change Set Parameter - ClusterControl

Click "Proceed" and ClusterControl will apply the configuration changes immediately. No database restart is required.

Multi-Instance Nextcloud

Since we performed the installation on nextcloud1 when accessing the URL, this IP address is automatically added into 'trusted_domains' variable inside Nextcloud. When you tried to access other servers, for example the secondary server, http://192.168.0.22/nextcloud, you would see an error that this is host is not authorized and must be added into the trusted_domain variable.

Therefore, add all the hosts IP address under "trusted_domain" array inside /var/www/html/nextcloud/config/config.php, as example below:

'trusted_domains' =>

  array (

    0 => '192.168.0.21',

    1 => '192.168.0.22',

    2 => '192.168.0.23'

  ),

The above configuration allows users to access all three application servers via the following URLs:

Note: You can add a load balancer tier on top of these three Nextcloud instances to achieve high availability for the application tier by using HTTP reverse proxies available in the market like HAProxy or nginx. That is out of the scope of this blog post.

Using Redis for File Locking

Nextcloud’s Transactional File Locking mechanism locks files to avoid file corruption during normal operation. It's recommended to install Redis to take care of transactional file locking (this is enabled by default) which will offload the database cluster from handling this heavy job.

To install Redis, simply:

$ yum install -y redis

$ systemctl enable redis.service

$ systemctl start redis.service

Append the following lines inside /var/www/html/nextcloud/config/config.php:

'filelocking.enabled' => true,

  'memcache.locking' => '\OC\Memcache\Redis',

  'redis' => array(

     'host' => '192.168.0.21',

     'port' => 6379,

     'timeout' => 0.0,

   ),

For more details, check out this documentation, Transactional File Locking.

Conclusion

Nextcloud can be configured to be a scalable and highly available file-hosting service to cater for your private file sharing demands. In this blog, we showed how you can bring redundancy in the Nextcloud, file system and database layers. 


Building a Hot Standby on Amazon AWS Using MariaDB Cluster

$
0
0

Galera Cluster 4.0 was first released as part of the MariaDB 10.4 and there are a lot of significant improvements in this version release. The most impressive feature in this release is the Streaming Replication which is designed to handle the following problems.

  • Problems with long transactions
  • Problems with large transactions
  • Problems with hot-spots in tables

In a previous blog, we deep-dove into the new Streaming Replication feature in a two-part series blog (Part 1 and Part 2). Part of this new feature in Galera 4.0 are new system tables which are very useful for querying and checking the Galera Cluster nodes and also the logs that have been processed in Streaming Replication. 

Also in previous blogs, we also showed you the Easy Way to Deploy a MySQL Galera Cluster on AWS and also how to Deploy a MySQL Galera Cluster 4.0 onto Amazon AWS EC2.

Percona hasn't released a GA for their Percona XtraDB Cluster (PXC) 8.0 yet as some features are still under development, such as the MySQL wsrep function WSREP_SYNC_WAIT_UPTO_GTID which looks to be not present yet (at least on PXC 8.0.15-5-27dev.4.2 version). Yet, when PXC 8.0 will be released, it will be packed with great features such as...

  • Improved resilient cluster
  • Cloud friendly cluster
  • improved packaging
  • Encryption support
  • Atomic DDL

While we're waiting for the release of PXC 8.0 GA, we'll cover in this blog how you can create a Hot Standby Node on Amazon AWS for Galera Cluster 4.0 using MariaDB.

What is a Hot Standby?

A hot standby is a common term in computing, especially on highly distributed systems. It's a method for redundancy in which one system runs simultaneously with an identical primary system. When failure happens on the primary node, the hot standby immediately takes over replacing the primary system. Data is mirrored to both systems in real time.

For database systems, a hot standby server is usually the second node after the primary master that is running on powerful resources (same as the master). This secondary node has to be as stable as the primary master to function correctly. 

It also serves as a data recovery node if the master node or the entire cluster goes down. The hot standby node will replace the failing node or cluster while continuously serving the demand from the clients.

In Galera Cluster, all servers part of the cluster can serve as a standby node. However, if the region or entire cluster goes down, how will you be able to cope up with this? Creating a standby node outside the specific region or network of your cluster is one option here. 

In the following section, we'll show you how to create a standby node on AWS EC2 using MariaDB.

Deploying a Hot Standby On Amazon AWS

Previously, we have showed you how you can create a Galera Cluster on AWS. You might want to read Deploying MySQL Galera Cluster 4.0 onto Amazon AWS EC2 in the case that you are new to Galera 4.0.

Deploying your hot standby node can be on another set of Galera Cluster which uses synchronous replication (check this blog Zero Downtime Network Migration With MySQL Galera Cluster Using Relay Node) or by deploying an asynchronous MySQL/MariaDB node. In this blog, we'll setup and deploy the hot standby node replicating asynchronously from one of the Galera nodes.

The Galera Cluster Setup

In this sample setup, we deployed 3-node cluster using MariaDB 10.4.8 version. This cluster is being deployed under US East (Ohio) region and the topology is shown below:

We'll use 172.31.26.175 server as the master for our asynchronous slave which will serve as the standby node.

Setting up your EC2 Instance for Hot Standby Node

In the AWS console, go to EC2 found under the Compute section and click Launch Instance to create an EC2 instance just like below.

We'll create this instance under the US West (Oregon) region. For your OS type, you can choose what server you like (I prefer Ubuntu 18.04) and choose the type of instance based on your preferred target type. For this example I will use t2.micro since it doesn't require any sophisticated setup and it's only for this sample deployment.

As we've mentioned earlier that its best that your hot standby node be located on a different region and not collocated or within the same region. So in case the regional data center goes down or suffers a network outage, your hot standby can be your failover target when things gone bad. 

Before we continue, in AWS, different regions will have its own Virtual Private Cloud (VPC) and its own network. In order to communicate with the Galera cluster nodes, we must first define a VPC Peering so the nodes can communicate within the Amazon infrastructure and do not need to go outside the network which just adds overhead and security concerns. 

First, go to your VPC from where your hot standby node shall reside, then go to Peering Connections. Then you need to specify the VPC of your standby node and the Galera cluster VPC. In the example below, I have us-west-2 interconnecting to us-east-2.

Once created, you'll see an entry under your Peering Connections. However, you need to accept the request from the Galera cluster VPC, which is on us-east-2 in this example. See below,

Once accepted, do not forget to add the CIDR to the routing table. See this external blog VPC Peering about how to do it after VPC Peering.

Now, let's go back and continue creating the EC2 node. Make sure your Security Group has the correct rules or required ports that needs to be opened. Check the firewall settings manual for more information about this. For this setup,  I just set All Traffic to be accepted since this is just a test. See below,

Make sure when creating your instance, you have set the correct VPC and you have defined your proper subnet. You can check this blog in case you need some help about that. 

Setting up the MariaDB Async Slave

Step One

First we need to setup the repository, add the repo keys and update the package list in the repository cache,

$ vi /etc/apt/sources.list.d/mariadb.list

$ apt-key adv --recv-keys --keyserver hkp://keyserver.ubuntu.com:80 0xF1656F24C74CD1D8

$ apt update

Step Two

Install the MariaDB packages and its required binaries

$ apt-get install mariadb-backup  mariadb-client mariadb-client-10.4 libmariadb3 libdbd-mysql-perl mariadb-client-core-10.4 mariadb-common mariadb-server-10.4 mariadb-server-core-10.4 mysql-common

Step Three

Now, let's take a backup using xbstream to transfer the files to the network from one of the nodes in our Galera Cluster.

## Wipe out the datadir of the newly fresh installed MySQL in your hot standby node.

$ systemctl stop mariadb

$ rm -rf /var/lib/mysql/*

## Then on the hot standby node, run this on the terminal,

$ socat -u tcp-listen:9999,reuseaddr stdout 2>/tmp/netcat.log | mbstream -x -C /var/lib/mysql

## Then on the target master, i.e. one of the nodes in your Galera Cluster (which is the node 172.31.28.175 in this example), run this on the terminal,

$ mariabackup  --backup --target-dir=/tmp --stream=xbstream | socat - TCP4:172.32.31.2:9999

where 172.32.31.2 is the IP of the host standby node.

Step Four

Prepare your MySQL configuration file. Since this is in Ubuntu, I am editing the file in /etc/mysql/my.cnf and with the following sample my.cnf taken from our ClusterControl template,

[MYSQLD]

user=mysql

basedir=/usr/

datadir=/var/lib/mysql

socket=/var/lib/mysql/mysql.sock

pid_file=/var/lib/mysql/mysql.pid

port=3306

log_error=/var/log/mysql/mysqld.log

log_warnings=2

# log_output = FILE


#Slow logging    

slow_query_log_file=/var/log/mysql/mysql-slow.log

long_query_time=2

slow_query_log=OFF

log_queries_not_using_indexes=OFF


### INNODB OPTIONS

innodb_buffer_pool_size=245M

innodb_flush_log_at_trx_commit=2

innodb_file_per_table=1

innodb_data_file_path = ibdata1:100M:autoextend

## You may want to tune the below depending on number of cores and disk sub

innodb_read_io_threads=4

innodb_write_io_threads=4

innodb_doublewrite=1

innodb_log_file_size=64M

innodb_log_buffer_size=16M

innodb_buffer_pool_instances=1

innodb_log_files_in_group=2

innodb_thread_concurrency=0

# innodb_file_format = barracuda

innodb_flush_method = O_DIRECT

innodb_rollback_on_timeout=ON

# innodb_locks_unsafe_for_binlog = 1

innodb_autoinc_lock_mode=2

## avoid statistics update when doing e.g show tables

innodb_stats_on_metadata=0

default_storage_engine=innodb


# CHARACTER SET

# collation_server = utf8_unicode_ci

# init_connect = 'SET NAMES utf8'

# character_set_server = utf8


# REPLICATION SPECIFIC

server_id=1002

binlog_format=ROW

log_bin=binlog

log_slave_updates=1

relay_log=relay-bin

expire_logs_days=7

read_only=ON

report_host=172.31.29.72

gtid_ignore_duplicates=ON

gtid_strict_mode=ON


# OTHER THINGS, BUFFERS ETC

key_buffer_size = 24M

tmp_table_size = 64M

max_heap_table_size = 64M

max_allowed_packet = 512M

# sort_buffer_size = 256K

# read_buffer_size = 256K

# read_rnd_buffer_size = 512K

# myisam_sort_buffer_size = 8M

skip_name_resolve

memlock=0

sysdate_is_now=1

max_connections=500

thread_cache_size=512

query_cache_type = 0

query_cache_size = 0

table_open_cache=1024

lower_case_table_names=0

# 5.6 backwards compatibility (FIXME)

# explicit_defaults_for_timestamp = 1


performance_schema = OFF

performance-schema-max-mutex-classes = 0

performance-schema-max-mutex-instances = 0


[MYSQL]

socket=/var/lib/mysql/mysql.sock

# default_character_set = utf8

[client]

socket=/var/lib/mysql/mysql.sock

# default_character_set = utf8

[mysqldump]

socket=/var/lib/mysql/mysql.sock

max_allowed_packet = 512M

# default_character_set = utf8


[xtrabackup]


[MYSQLD_SAFE]

# log_error = /var/log/mysqld.log

basedir=/usr/

# datadir = /var/lib/mysql

Of course, you can change this according to your setup and requirements.

Step Five

Prepare the backup from step #3 i.e. the finish backup that is now in the hot standby node by running the command below,

$ mariabackup --prepare --target-dir=/var/lib/mysql

Step Six

Set the ownership of the datadir in the hot standby node,

$ chown -R mysql.mysql /var/lib/mysql

Step Seven

Now, start the MariaDB instance

$  systemctl start mariadb

Step Eight

Lastly, we need to setup the asynchronous replication,

## Create the replication user on the master node, i.e. the node in the Galera cluster

MariaDB [(none)]> CREATE USER 'cmon_replication'@'172.32.31.2' IDENTIFIED BY 'PahqTuS1uRIWYKIN';

Query OK, 0 rows affected (0.866 sec)

MariaDB [(none)]> GRANT REPLICATION SLAVE, REPLICATION CLIENT ON *.* TO 'cmon_replication'@'172.32.31.2';

Query OK, 0 rows affected (0.127 sec)

## Get the GTID slave position from xtrabackup_binlog_info as follows,

$  cat /var/lib/mysql/xtrabackup_binlog_info

binlog.000002   71131632 1000-1000-120454

##  Then setup the slave replication as follows,

MariaDB [(none)]> SET GLOBAL gtid_slave_pos='1000-1000-120454';

Query OK, 0 rows affected (0.053 sec)

MariaDB [(none)]> CHANGE MASTER TO MASTER_HOST='172.31.28.175', MASTER_USER='cmon_replication', master_password='PahqTuS1uRIWYKIN', MASTER_USE_GTID = slave_pos;

## Now, check the slave status,

MariaDB [(none)]> show slave status \G

*************************** 1. row ***************************

                Slave_IO_State: Waiting for master to send event

                   Master_Host: 172.31.28.175

                   Master_User: cmon_replication

                   Master_Port: 3306

                 Connect_Retry: 60

               Master_Log_File: 

           Read_Master_Log_Pos: 4

                Relay_Log_File: relay-bin.000001

                 Relay_Log_Pos: 4

         Relay_Master_Log_File: 

              Slave_IO_Running: Yes

             Slave_SQL_Running: Yes

               Replicate_Do_DB: 

           Replicate_Ignore_DB: 

            Replicate_Do_Table: 

        Replicate_Ignore_Table: 

       Replicate_Wild_Do_Table: 

   Replicate_Wild_Ignore_Table: 

                    Last_Errno: 0

                    Last_Error: 

                  Skip_Counter: 0

           Exec_Master_Log_Pos: 4

               Relay_Log_Space: 256

               Until_Condition: None

                Until_Log_File: 

                 Until_Log_Pos: 0

            Master_SSL_Allowed: No

            Master_SSL_CA_File: 

            Master_SSL_CA_Path: 

               Master_SSL_Cert: 

             Master_SSL_Cipher: 

                Master_SSL_Key: 

         Seconds_Behind_Master: 0

 Master_SSL_Verify_Server_Cert: No

                 Last_IO_Errno: 0

                 Last_IO_Error: 

                Last_SQL_Errno: 0

                Last_SQL_Error: 

   Replicate_Ignore_Server_Ids: 

              Master_Server_Id: 1000

                Master_SSL_Crl: 

            Master_SSL_Crlpath: 

                    Using_Gtid: Slave_Pos

                   Gtid_IO_Pos: 1000-1000-120454

       Replicate_Do_Domain_Ids: 

   Replicate_Ignore_Domain_Ids: 

                 Parallel_Mode: conservative

                     SQL_Delay: 0

           SQL_Remaining_Delay: NULL

       Slave_SQL_Running_State: Slave has read all relay log; waiting for the slave I/O thread to update it

              Slave_DDL_Groups: 0

Slave_Non_Transactional_Groups: 0

    Slave_Transactional_Groups: 0

1 row in set (0.000 sec)

Adding Your Hot Standby Node To ClusterControl

If you are using ClusterControl, it's easy to monitor your database server's health. To add this as a slave, select the Galera node cluster you have then go to the selection button as shown below to Add Replication Slave:

Click Add Replication Slave and choose adding an existing slave just like below,

Our topology looks promising.

As you might notice, our node 172.32.31.2 serving as our hot standby node has a different CIDR which prefixes as 172.32.% us-west-2 (Oregon) while the other nodes are of 172.31.% located on us-east-2 (Ohio). They're totally on different region, so in case network failure occurs on your Galera nodes, you can failover to your hot standby node.

Conclusion

Building a Hot Standby on Amazon AWS is easy and straightforward. All you need is to determine your capacity requirements and your networking topology, security, and protocols that need to be setup. 

Using VPC Peering helps speed up inter-communication between different region without going to the public internet, so the connection stays within the Amazon network infrastructure. 

Using asynchronous replication with one slave is, of course, not enough, but this blog serves as the foundation on how you can initiate this. You can now easily create another cluster where the asynchronous slave is replicating and create another series of Galera Clusters serving as your Disaster Recovery nodes, or you can also use gmcast.segment variable in Galera to replicate synchronously just like what we have on this blog

Announcing ClusterControl 1.7.4: Cluster-to-Cluster Replication - Ultimate Disaster Recovery

$
0
0

We’re excited to announce the 1.7.4 release of ClusterControl - the only database management system you’ll ever need to take control of your open source database infrastructure. 

In this release we launch a new function that could be the ultimate way to minimize RTO as part of your disaster recovery strategy. Cluster-to-Cluster Replication for MySQL and PostgreSQL lets you build-out a clone of your entire database infrastructure and deploy it to a secondary data center, while keeping both synced. This ensures you always have an available up-to-date database setup ready to switch-over to should disaster strike.  

In addition we are also announcing support for the new MariaDB 10.4 / Galera Cluster 4.x as well as support for ProxySQL 2.0, the latest release from the industry leading MySQL load balancer.

Lastly, we continue our commitment to PostgreSQL by releasing new user management functions, giving you complete control over who can access or administer your postgres setup.

Release Highlights

Cluster-to-Cluster Database Replication

  • Asynchronous MySQL Replication Between MySQL Galera Clusters.
  • Streaming Replication Between PostgreSQL Clusters.
  • Ability to Build Clusters from a Backup or by Streaming Directly from a Master Cluster.

Added Support for MariaDB 10.4 & Galera Cluster 4.x

  • Deployment, Configuration, Monitoring and Management of the Newest Version of Galera Cluster Technology, initially released by MariaDB
    • New Streaming Replication Ability
    • New Support for Dealing with Long Running & Large Transactions
    • New Backup Locks for SST

Added Support for ProxySQL 2.0

  • Deployment and Configuration of the Newest Version of the Best MySQL Load Balancer on the Market
    • Native Support for Galera Cluster
    • Enables Causal Reads Using GTID
    • New Support for SSL Frontend Connections
    • Query Caching Improvements

New User Management Functions for PostgreSQL Clusters

  • Take full control of who is able to access your PostgreSQL database.
 

View Release Details and Resources

Release Details

Cluster-to-Cluster Replication

Either streaming from your master or built from a backup, the new Cluster-to-Cluster Replication function in ClusterControl let’s you create a complete disaster recovery database system into another data center; which you can then easily failover to should something go wrong, during maintenance, or during a major outage.

In addition to disaster recovery, this function also allows you to create a copy of your database infrastructure (in just a couple of clicks) which you can use to test upgrades, patches, or to try some database performance enhancements.

You can also use this function to deploy an analytics or reporting setup, allowing you to separate your reporting load from your OLTP traffic.

Cluster to Cluster Replication

PostgreSQL User Management

You now have the ability to add or remove user access to your PostgreSQL setup. With the simple interface, you can specify specific permissions or restrictions at the individual level. It also provides a view of all defined users who have access to the database, with their respective permissions. For tips on best practices around PostgreSQL user management you can check out this blog.

MariaDB 10.4 / Galera Cluster 4.x Support

In an effort to boost performance for long running or large transactions, MariaDB & Codership have partnered to add Streaming Replication to the new MariaDB Cluster 10.4. This addition solves many challenges that this technology has previously experienced with these types of transactions. There are three new system tables added to the release to support this new function as well as new synchronisation functions.  You can read more about what’s included in this release here.

Deploy MariaDB Cluster 10.4
 

How to Configure a Cluster-to-Cluster Replication for Percona XtraDB Cluster or MariaDB Cluster

$
0
0

In a previous blog, we announced a new ClusterControl 1.7.4 feature called Cluster-to-Cluster Replication. It automates the entire process of setting up a DR cluster off your primary cluster, with replication in between. For more detailed information please refer to the above mentioned blog entry.

Now in this blog, we will take a look at how to configure this new feature for an existing cluster. For this task, we will assume you have ClusterControl installed and the Master Cluster was deployed using it.

Requirements for the Master Cluster

There are some requirements for the Master Cluster to make it work:

  • Percona XtraDB Cluster version 5.6.x and later, or MariaDB Galera Cluster version 10.x and later.
  • GTID enabled.
  • Binary Logging enabled on at least one database node.
  • The backup credentials must be the same across the Master Cluster and Slave Cluster. 

Preparing the Master Cluster

The Master Cluster needs to be prepared to use this new feature. It requires configuration from both ClusterControl and Database side.

ClusterControl Configuration

In the database node, check the backup user credentials stored in /etc/my.cnf.d/secrets-backup.cnf (For RedHat Based OS) or in /etc/mysql/secrets-backup.cnf (For Debian Based OS).

$ cat /etc/my.cnf.d/secrets-backup.cnf

# Security credentials for backup.

[mysqldump]

user=backupuser

password=cYj0GFBEdqdreZEl


[xtrabackup]

user=backupuser

password=cYj0GFBEdqdreZEl


[mysqld]

wsrep_sst_auth=backupuser:cYj0GFBEdqdreZEl

In the ClusterControl node, edit the /etc/cmon.d/cmon_ID.cnf configuration file (where ID is the Cluster ID Number) and make sure it contains the same credentials stored in secrets-backup.cnf.

$ cat /etc/cmon.d/cmon_8.cnf

backup_user=backupuser

backup_user_password=cYj0GFBEdqdreZEl

basedir=/usr

cdt_path=/

cluster_id=8

...

Any change on this file requires a cmon service restart:

$ service cmon restart

Check the database replication parameters to make sure that you have GTID and Binary Logging enabled.

Database Configuration

In the database node, check the file /etc/my.cnf (For RedHat Based OS) or /etc/mysql/my.cnf (For Debian Based OS) to see the configuration related to the replication process.

Percona XtraDB:

$ cat /etc/my.cnf

# REPLICATION SPECIFIC

server_id=4002

binlog_format=ROW

log_bin = /var/lib/mysql-binlog/binlog

log_slave_updates = ON

gtid_mode = ON

enforce_gtid_consistency = true

relay_log = relay-log

expire_logs_days = 7

MariaDB Galera Cluster:

$ cat /etc/my.cnf

# REPLICATION SPECIFIC

server_id=9000

binlog_format=ROW

log_bin = /var/lib/mysql-binlog/binlog

log_slave_updates = ON

relay_log = relay-log

wsrep_gtid_domain_id=9000

wsrep_gtid_mode=ON

gtid_domain_id=9000

gtid_strict_mode=ON

gtid_ignore_duplicates=ON

expire_logs_days = 7

Insted checking the configuration files, you can verify if it’s enabled in the ClusterControl UI. Go to ClusterControl -> Select Cluster -> Nodes. There you should have something like this:

The “Master” role added in the first node means that the Binary Logging is enabled.

Enabling Binary Logging

If you don’t have the binary logging enabled, go to ClusterControl -> Select Cluster -> Nodes -> Node Actions -> Enable Binary Logging.

Then, you must specify the binary log retention, and the path to store it. You should also specify if you want ClusterControl to restart the database node after configuring it, or if you prefer to restart it by yourself.

Keep in mind that Enabling Binary Logging always requires a restart of the database service.

Creating the Slave Cluster from the ClusterControl GUI

To create a new Slave Cluster, go to ClusterControl -> Select Cluster -> Cluster Actions -> Create Slave Cluster.

The Slave Cluster can be created by streaming data from the current Master Cluster or by using an existing backup. 

In this section, you must also choose the master node of the current cluster from which the data will be replicated.

When you go to the next step, you must specify User, Key or Password and port to connect by SSH to your servers. You also need a name for your Slave Cluster and if you want ClusterControl to install the corresponding software and configurations for you.

After setting up the SSH access information, you must define the database vendor and version, datadir, database port, and the admin password. Make sure you use the same vendor/version and credentials as used by the Master Cluster. You can also specify which repository to use.

In this step, you need to add servers to the new Slave Cluster. For this task, you can enter both IP Address or Hostname of each database node.

You can monitor the status of the creation of your new Slave Cluster from the ClusterControl activity monitor. Once the task is finished, you can see the cluster in the main ClusterControl screen.

Managing Cluster-to-Cluster Replication Using the ClusterControl GUI

Now you have your Cluster-to-Cluster Replication up and running, there are different actions to perform on this topology using ClusterControl.

Configure Active-Active Clusters

As you can see, by default the Slave Cluster is set up in Read-Only mode. It’s possible to disable the Read-Only flag on the nodes one by one from the ClusterControl UI, but keep in mind that Active-Active clustering is only recommended if applications are only touching disjoint data sets on either cluster since MySQL/MariaDB doesn’t offer any Conflict Detection or Resolution.

To disable the Read-Only mode, go to ClusterControl -> Select Slave Cluster -> Nodes. In this section, select each node and use the Disable Read-Only option.

Rebuilding a Slave Cluster

To avoid inconsistencies, if you want to rebuild a Slave Cluster, this must be a Read-Only cluster, this means that all nodes must be in Read-Only mode.

Go to ClusterControl -> Select Slave Cluster -> Nodes -> Choose the Node connected to the Master Cluster -> Node Actions -> Rebuild Replication Slave.

Topology Changes

If you have the following topology:

And for some reason, you want to change the replication node in the Master Cluster. It’s possible to change the master node used by the Slave Cluster to another master node in the Master Cluster. 

To be considered as a master node, it must have the binary logging enabled.

Go to ClusterControl -> Select Slave Cluster -> Nodes -> Choose the Node connected to the Master Cluster -> Node Actions -> Stop Slave/Start Slave.

Stop/Start Replication Slave

You can stop and start replication slaves in an easy way using ClusterControl.

Go to ClusterControl -> Select Slave Cluster -> Nodes -> Choose the Node connected to the Master Cluster -> Node Actions -> Stop Slave/Start Slave.

Reset Replication Slave

Using this action, you can reset the replication process using RESET SLAVE or RESET SLAVE ALL. The difference between them is, RESET SLAVE doesn’t change any replication parameter like master host, port and credentials. To delete this information you must use RESET SLAVE ALL that removes all the replication configuration, so using this command the Cluster-to-Cluster Replication link will be destroyed.

Before using this feature, you must stop the replication process (please refer to the previous feature).

Go to ClusterControl -> Select Slave Cluster -> Nodes -> Choose the Node connected to the Master Cluster -> Node Actions -> Reset Slave/Reset Slave All.

Managing Cluster-to-Cluster Replication Using the ClusterControl CLI

In the previous section, you were able to see how to manage a Cluster-to-Cluster Replication using the ClusterControl UI. Now, let’s see how to do it by using the command line. 

Note: As we mentioned at the beginning of this blog, we will assume you have ClusterControl installed and the Master Cluster was deployed using it.

Create the Slave Cluster

First, let’s see an example command to create a Slave Cluster by using the ClusterControl CLI:

$ s9s cluster --create --cluster-name=Galera1rep --cluster-type=galera  --provider-version=10.4 --nodes="192.168.100.166;192.168.100.167;192.168.100.168"  --os-user=root --os-key-file=/root/.ssh/id_rsa --db-admin=root --db-admin-passwd=xxxxxxxx --vendor=mariadb --remote-cluster-id=11 --log

Now you have your create slave process running, let’s see each used parameter:

  • Cluster: To list and manipulate clusters.
  • Create: Create and install a new cluster.
  • Cluster-name: The name of the new Slave Cluster.
  • Cluster-type: The type of cluster to install.
  • Provider-version: The software version.
  • Nodes: List of the new nodes in the Slave Cluster.
  • Os-user: The user name for the SSH commands.
  • Os-key-file: The key file to use for SSH connection.
  • Db-admin: The database admin user name.
  • Db-admin-passwd: The password for the database admin.
  • Remote-cluster-id: Master Cluster ID for the Cluster-to-Cluster Replication.
  • Log: Wait and monitor job messages.

Using the --log flag, you will be able to see the logs in real time:

Verifying job parameters.

Checking ssh/sudo on 3 hosts.

All 3 hosts are accessible by SSH.

192.168.100.166: Checking if host already exists in another cluster.

192.168.100.167: Checking if host already exists in another cluster.

192.168.100.168: Checking if host already exists in another cluster.

192.168.100.157:3306: Binary logging is enabled.

192.168.100.158:3306: Binary logging is enabled.

Creating the cluster with the following:

wsrep_cluster_address = 'gcomm://192.168.100.166,192.168.100.167,192.168.100.168'

Calling job: setupServer(192.168.100.166).

192.168.100.166: Checking OS information.

…

Caching config files.

Job finished, all the nodes have been added successfully.

Configure Active-Active Clusters

As you could see earlier, you can disable the Read-Only mode in the new cluster by disabling it in each node, so let’s see how to do it from the command line.

$ s9s node --set-read-write --nodes="192.168.100.166" --cluster-id=16 --log

Let’s see each parameter:

  • Node: To handle nodes.
  • Set-read-write: Set the node to Read-Write mode.
  • Nodes: The node where to change it.
  • Cluster-id: The ID of the cluster in which the node is.

Then, you will see:

192.168.100.166:3306: Setting read_only=OFF.

Rebuilding a Slave Cluster

You can rebuild a Slave Cluster using the following command:

$ s9s replication --stage --master="192.168.100.157:3306" --slave="192.168.100.166:3306" --cluster-id=19 --remote-cluster-id=11 --log

The parameters are:

  • Replication: To monitor and control data replication.
  • Stage: Stage/Rebuild a Replication Slave.
  • Master: The replication master in the master cluster.
  • Slave: The replication slave in the slave cluster.
  • Cluster-id: The Slave Cluster ID.
  • Remote-cluster-id: The Master Cluster ID.
  • Log: Wait and monitor job messages.

The job log should be similar to this one:

Rebuild replication slave 192.168.100.166:3306 from master 192.168.100.157:3306.

Remote cluster id = 11

Shutting down Galera Cluster.

192.168.100.166:3306: Stopping node.

192.168.100.166:3306: Stopping mysqld (timeout=60, force stop after timeout=true).

192.168.100.166: Stopping MySQL service.

192.168.100.166: All processes stopped.

192.168.100.166:3306: Stopped node.

192.168.100.167:3306: Stopping node.

192.168.100.167:3306: Stopping mysqld (timeout=60, force stop after timeout=true).

192.168.100.167: Stopping MySQL service.

192.168.100.167: All processes stopped.

…

192.168.100.157:3306: Changing master to 192.168.100.166:3306.

192.168.100.157:3306: Changed master to 192.168.100.166:3306

192.168.100.157:3306: Starting slave.

192.168.100.157:3306: Collecting replication statistics.

192.168.100.157:3306: Started slave successfully.

192.168.100.166:3306: Starting node

Writing file '192.168.100.167:/etc/mysql/my.cnf'.

Writing file '192.168.100.167:/etc/mysql/secrets-backup.cnf'.

Writing file '192.168.100.168:/etc/mysql/my.cnf'.

Topology Changes

You can change your topology using another node in the Master Cluster from which replicate the data, so for example, you can run:

$ s9s replication --failover --master="192.168.100.161:3306" --slave="192.168.100.163:3306" --cluster-id=10 --remote-cluster-id=9 --log

Let’s check the used parameters.

  • Replication: To monitor and control data replication.
  • Failover: Take the role of master from a failed/old master.
  • Master: The new replication master in the Master Cluster.
  • Slave: The replication slave in the Slave Cluster.
  • Cluster-id: The ID of the Slave Cluster.
  • Remote-Cluster-id: The ID of the Master Cluster.
  • Log: Wait and monitor job messages.

You will see this log:

192.168.100.161:3306 belongs to cluster id 9.

192.168.100.163:3306: Changing master to 192.168.100.161:3306

192.168.100.163:3306: My master is 192.168.100.160:3306.

192.168.100.161:3306: Sanity checking replication master '192.168.100.161:3306[cid:9]' to be used by '192.168.100.163[cid:139814070386698]'.

192.168.100.161:3306: Executing GRANT REPLICATION SLAVE ON *.* TO 'cmon_replication'@'192.168.100.163'.

Setting up link between  192.168.100.161:3306 and 192.168.100.163:3306

192.168.100.163:3306: Stopping slave.

192.168.100.163:3306: Successfully stopped slave.

192.168.100.163:3306: Setting up replication using MariaDB GTID: 192.168.100.161:3306->192.168.100.163:3306.

192.168.100.163:3306: Changing Master using master_use_gtid=slave_pos.

192.168.100.163:3306: Changing master to 192.168.100.161:3306.

192.168.100.163:3306: Changed master to 192.168.100.161:3306

192.168.100.163:3306: Starting slave.

192.168.100.163:3306: Collecting replication statistics.

192.168.100.163:3306: Started slave successfully.

192.168.100.160:3306: Flushing logs to update 'SHOW SLAVE HOSTS'

Stop/Start Replication Slave

You can stop to replicate the data from the Master Cluster in this way:

$ s9s replication --stop --slave="192.168.100.166:3306" --cluster-id=19 --log

You will see this:

192.168.100.166:3306: Ensuring the datadir '/var/lib/mysql' exists and is owned by 'mysql'.

192.168.100.166:3306: Stopping slave.

192.168.100.166:3306: Successfully stopped slave.

And now, you can start it again:

$ s9s replication --start --slave="192.168.100.166:3306" --cluster-id=19 --log

So, you will see:

192.168.100.166:3306: Ensuring the datadir '/var/lib/mysql' exists and is owned by 'mysql'.

192.168.100.166:3306: Starting slave.

192.168.100.166:3306: Collecting replication statistics.

192.168.100.166:3306: Started slave successfully.

Now, let’s check the used parameters.

  • Replication: To monitor and control data replication.
  • Stop/Start: To make the slave stop/start replicating.
  • Slave: The replication slave node.
  • Cluster-id: The ID of the cluster in which the slave node is.
  • Log: Wait and monitor job messages.

Reset Replication Slave

Using this command, you can reset the replication process using RESET SLAVE or RESET SLAVE ALL. For more information about this command, please check the usage of this in the previous ClusterControl UI section.

Before using this feature, you must stop the replication process (please refer to the previous command).

RESET SLAVE:

$ s9s replication --reset  --slave="192.168.100.166:3306" --cluster-id=19 --log

The log should be like:

192.168.100.166:3306: Ensuring the datadir '/var/lib/mysql' exists and is owned by 'mysql'.

192.168.100.166:3306: Executing 'RESET SLAVE'.

192.168.100.166:3306: Command 'RESET SLAVE' succeeded.

RESET SLAVE ALL:

$ s9s replication --reset --force  --slave="192.168.100.166:3306" --cluster-id=19 --log

And this log should be:

192.168.100.166:3306: Ensuring the datadir '/var/lib/mysql' exists and is owned by 'mysql'.

192.168.100.166:3306: Executing 'RESET SLAVE /*!50500 ALL */'.

192.168.100.166:3306: Command 'RESET SLAVE /*!50500 ALL */' succeeded.

Let’s see the used parameters for both RESET SLAVE and RESET SLAVE ALL.

  • Replication: To monitor and control data replication.
  • Reset: Reset the slave node.
  • Force: Using this flag you will use the RESET SLAVE ALL command on the slave node.
  • Slave: The replication slave node.
  • Cluster-id: The Slave Cluster ID.
  • Log: Wait and monitor job messages.

Conclusion

This new ClusterControl feature will allow you to create Cluster-to-Cluster Replication fast and manage it in an easy and friendly way. This environment will improve your database/cluster topology and it would be useful for a Disaster Recovery Plan, testing environment and even more options mentioned in the overview blog.

9 ClusterControl Features You Won't Find in Other Database Management Tools

$
0
0

Ensuring smooth operations of your production databases is not a trivial task, and there are a number of tools and utilities to help with the job. There are tools available for monitoring health, server performance, analyzing queries, deployments, managing failover, upgrades, and the list goes on. ClusterControl as a management and monitoring platform for your database infrastructure stands out with its ability to manage the full lifecycle from deployment to monitoring, ongoing management and scaling. 

Although ClusterControl offers important features like automatic database failover, encryption in-transit/at-rest, backup management, point-in-time recovery, Prometheus integration, database scaling, these can be found in other enterprise management/monitoring tools on the market. However, there are some features that you won’t find that easily. In this blog post, we’ll present 9 features that you won't find in any other management and monitoring tools on the market (as the time of this writing). 

Backup Verification

Any backup is literally not a backup until you know it can be recovered - by really verifying that it can be recovered. ClusterControl allows a backup to be verified after the backup has been taken by spinning a new server and testing restore. Verifying a backup is a critical process to make sure you meet your Recovery Point Objective (RPO) policy in the event of disaster recovery. The verification process will perform the restoration on a new standalone host (where ClusterControl will install necessary database packages before restoring) or on a server dedicated for backup verification.

To configure backup verification, simply select an existing backup and click on Restore. There will be an option to Restore and Verify:

Database Backup Verification

Then, simply specify the IP address of the server that you would want to restore and verify:

Database Backup Verification

Make sure the specified host is accessible via passwordless SSH beforehand. You also have a handful of options underneath for provisioning process. You can also shutdown the verification server after restoration to save costs and resources after the backup has been verified. ClusterControl will look for the restoration process exit code and observe the restore log to check whether the verification fails or succeeds.

Simplifying ProxySQL Management Through a GUI

Many would agree that having a graphical user interface is more efficient and less prone to human error when configuring a system. ProxySQL is a part of the critical database layer (although it sits on top of it) and must be visible enough to DBA's eyes to spot common problems and issues. ClusterControl provides a comprehensive graphical user interface for ProxySQL.

ProxySQL instances can be deployed on fresh hosts, or existing ones can be imported into ClusterControl. ClusterControl can configure ProxySQL to be integrated with a virtual IP address (provided by Keepalived) for single endpoint access to the database servers. It also provides monitoring insight to the key ProxySQL components like Queries Backend, Slow Queries, Top Queries, Query Hits, and a bunch of other monitoring stats. The following is a screenshot showing how to add a new query rule:

ProxySQL Management GUI

If you were adding a very complex query rule, you would be more comfortable doing it via the graphical user interface. Every field has a tooltip to assist you when filling in the Query Rule form. When adding or modifying any ProxySQL configuration, ClusterControl will make sure the changes are made to runtime, and saved onto disk for persistency.

ClusterControl 1.7.4 now supports both ProxySQL 1.x and ProxySQL 2.x.

Operational Reports

Operational Reports are a set of summary reports of your database infrastructure that can be generated on-the-fly or can be scheduled to be sent to different recipients. These reports consist of different checks and address various day-to-day DBA tasks. The idea behind ClusterControl operational reporting is to put all of the most relevant data into a single document which can be quickly analyzed in order to get a clear understanding of the status of the databases and its processes.

With ClusterControl you can schedule cross-cluster environment reports like Daily System Report, Package Upgrade Report, Schema Change Report as well as Backups and Availability. These reports will help you to keep your environment secure and operational. You will also see recommendations on how to fix gaps. Reports can be addressed to SysOps, DevOps or even managers who would like to get regular status updates about a given system’s health. 

The following is a sample of daily operational report sent to your mailbox in regards to availability:

Database Operational Report

We have covered this in detail in this blog post, An Overview of Database Operational Reporting in ClusterControl.

Resync a Slave via Backup

ClusterControl allows staging a slave (whether a new slave or a broken slave) via the latest full or incremental backup. It doesn't sound very exciting, but this feature is huge if you have large datasets of 100GB and above. Common practice when resyncing a slave is to stream a backup of the current master which will take some time depending on the database size. This will add an additional burden to the master, which may jeopardize the performance of the master.

To resync a slave via backup, pick the slave node under Nodes page and go to Node Actions -> Rebuild Replication Slave -> Rebuild from a backup. Only PITR-compatible backup will be listed in the dropdown:

Rebuild Database Replication Slave

Resyncing a slave from a backup will not bring any additional overhead to the master, where ClusterControl extracts and streams the backup from the backup storage location into the slave and eventually configures the replication link between the slave to the master. The slave will later catch up with the master once the replication link is established. The master is untouched during the whole process, and you can monitor the whole progress under Activity -> Jobs. 

Bootstrap a Galera Cluster

Galera Cluster is a very popular when implementing high availability for MySQL or MariaDB, but the wrong management commands can lead to disastrous consequences. Take a look at this blog post on how to bootstrap a Galera Cluster under different conditions. This illustrates that bootstrapping a Galera Cluster has many variables and must be performed with extreme care. Otherwise, you may lose data or cause a split-brain. ClusterControl understands the database topology and knows exactly what to do in order to bootstrap a database cluster properly. To bootstrap a cluster via ClusterControl, click on the Cluster Actions -> Bootstrap Cluster:

Bootstrap a Galera Cluster

You will have the option to let ClusterControl pick the right bootstrap node automatically, or perform an initial bootstrap where you pick one of the database nodes from the list to become the reference node and wipe out the MySQL datadir on the joiner nodes to force SST from the bootstrapped node. If bootstrapping process fails, ClusterControl will pull the MySQL error log.

If you would like to perform a manual bootstrap, you can also use "Find Most Advanced Node" feature and perform the cluster bootstrap operation on the most advanced node reported by ClusterControl.

Centralized Configuration and Logging

ClusterControl pulls a number of important configuration and logging files and displays them in a tree structure within ClusterControl. A centralized view of these files is key to efficiently understanding and troubleshooting distributed database setups. The traditional way of tailing/grepping these files is long gone with ClusterControl. The following screenshot shows ClusterControl's configuration file manager which listed out all related configuration files for this cluster in one single view (with syntax highlighting, of course):

Centralized Database Configuration and Logging

ClusterControl eliminates the repetitiveness when changing a configuration option of a database cluster. Changing a configuration option on multiple nodes can be performed via a single interface and will be applied to the database node accordingly. When you click on "Change/Set Parameter", you can select the database instances that you would want to change and specify the configuration group, parameter and value:

Centralized Database Configuration and Logging

You can add a new parameter into the configuration file or modify an existing parameter. The parameter will be applied to the chosen database nodes' runtime and into the configuration file if the option passes the variable validation process. Some variable might require a server restart, which will then be advised by ClusterControl.

Database Cluster Cloning

With ClusterControl, you can quickly clone an existing MySQL Galera Cluster so you have an exact copy of the dataset on the other cluster. ClusterControl performs the cloning operation online, without any locking or bringing downtime to the existing cluster. It's like a cluster scale out operation except both clusters are independent from each other after the syncing completes. The cloned cluster does not necessarily need to be as the same cluster size as the existing one. We could start with a “one-node cluster”, and scale it out with more database nodes at a later stage.

Database Cluster Cloning

Another similar feature offered by ClusterControl is "Create Cluster from Backup". This feature was introduced in ClusterControl 1.7.1, specifically for Galera Cluster and PostgreSQL clusters where one can create a new cluster from the existing backup. Contrary to cluster cloning, this operation does not bring additional load to the source cluster with the tradeoff that the cloned cluster will not be in the same state as the source cluster.

We have covered this topic in detail in this blog post, How to Create a Clone of Your MySQL or PostgreSQL Database Cluster.

Restore Physical Backup

Most database management tools allow backing up a database, and only a handful of them support database restoration of logical backup only. ClusterControl supports full restoration not only for logical backups, but also physical backups, whether it is a full or incremental backup. Restoring a physical backup requires a number of critical steps (especially incremental backups) which basically involves preparing a backup, copying the prepared data into the data directory, assigning correct permission/ownership and starting up the node in a correct order to maintain data consistency across all members in the cluster. ClusterControl performs all of these operations automatically.

You can also restore a physical backup onto another node that is not part of a cluster. In ClusterControl, the option for this is called "Create Cluster from Backup". You can start with a “one-node cluster” to test out the restoration process on another server or to copy out your database cluster to another location.

ClusterControl also supports restoring an external backup, a backup that has been taken not through ClusterControl. You just need to upload the backup to ClusterControl server and specify the physical path to the backup file when restoring. ClusterControl will take care the rest.

Cluster-to-Cluster Replication

This is a new feature introduced in ClusterControl 1.7.4. ClusterControl can now handle and monitor cluster-cluster replication, which basically extends the asynchronous database replication between multiple cluster sets in multiple geographical locations. A cluster can be set as a master cluster (active cluster which processes reads/writes) and the slave cluster can be set as a read-only cluster (standby cluster which can also processes reads). ClusterControl supports asynchronous cluster-cluster replication for Galera Cluster (binary log must be enabled) and also master-slave replication for PostgreSQL Streaming Replication. 

To create a new cluster the replicates from another cluster, go to Cluster Actions -> Create Slave Cluster:

Cluster-to-Cluster Replication

The result of the above deployment is presented clearly on the Database Cluster List dashboard:

Cluster-to-Cluster Replication

The slave cluster is automatically configured as read-only, replicating from the primary cluster and acting as a standby cluster. If disaster strikes the primary cluster and you want to activate the secondary site, simply pick the "Disable Readonly"  menu available under the Nodes -> Node Actions dropdown to promote it as an active cluster.


Avoiding Database Vendor Lock-In for MySQL or MariaDB

$
0
0

Vendor lock-in is defined as "Proprietary lock-in or customer lock-in, which makes a customer dependent on a vendor for their products and services; unable to use another vendor without substantial cost" (wikipedia). Undeniably for many software companies that would be the desired business model. But is it good for their customers?

Proprietary databases have great support for migrations from other popular database software solutions. However, that would just cause another vendor lock-in. Is it then open source a solution? 

Due to limitations that open source had years back many chosen expensive database solutions. Unfortunately, for many open-source was not an option.

In fact over the years, the open-source database has earned Enterprise support and maturity to run critical and complex data transaction systems. 

With the new version database like Percona and MariaDB has added some great new features, either compatibility or enterprise necessitates like 24/7 support, security, auditing, clustering, online backup or fast restore. All that made the migration process more accessible than ever before.

Migration may be a wise move however it comes with the risk. Whether you're planning to migrate from proprietary to open support migration manually or with the help of a commercial tool to automate the entire migration process, you need to know all the possible bottlenecks and methods involved in the process and the validation of the results.

Changing the database system is also an excellent time to consider further vendor lock-in risks. During the migration process, you may think about how to avoid to be locked with some technology.  In this article, we are going to focus on some leading aspects of vendor lock-in of MySQL and MariaDB.

Avoiding Lock-in for Database Monitoring

Users of open source databases often have to use a mixture of tools and homegrown scripts to monitor their production database environments. However, even while having its own homegrown scripts in the solution, it’s hard to maintain it and keep up with new database features. 

Hopefully, there are many interesting free monitoring tools for MySQL/MariaDB.  The most DBA recommended free tools are PMM, Zabbix, ClusterControl Community Edition, Nagios MySQL plugin. Although PMM and ClusterControl are dedicated database sollutions.

Percona Monitoring and Management (PMM) is a fully open-source solution for managing MySQL platform performance and tuning query performance. PMM is an on-premises solution that retains all of your performance and query data inside the confines of your environment. You can find the PMM demo under the below link.

PMM by Percona

Traditional server monitoring tools are not built for modern distributed database architectures. Most production databases today run in some high availability setup - from more straightforward master-slave replication to multi-master clusters fronted by redundant load balancers. Operations teams deal with dozens, often hundreds of services that make up the database environment.

Free Database Monitoring from ClusterControl

Having multiple database systems means your organization will become more agile on the development side and allows the choice to the developers, but it also imposes additional knowledge on the operations side. Extending your infrastructure from only MySQL to deploying other storage backends like MongoDB and PostgreSQL, implies you also have to monitor, manage, and scale them. As every storage backend excels at different use cases, this also means you have to reinvent the wheel for every one of them.

ClusterControl: Replication Setup

ClusterControl was designed to address modern, highly distributed database setups based on replication or clustering. It shows the status of the entire cluster solution however it can be greatly used for a single instance. ClusterControl will show you many advanced metrics however you can also find there build in advisors that will help you to understand them. You can find the ClusterControl demo under the below link.

ClusterControl: Advisors

Avoiding Lock-in for Database Backup Solutions

There are multiple ways to take backups, but which method fits your specific needs? How do I implement point in time recovery?

If you are migrating from Oracle or SQL Server we would like to recommend you xtrabackup tool from Percona or similar mariabackup from Mark.

Percona XtraBackup is the most popular, open-source, MySQL/MariaDB hot backup software that performs non-blocking backups for InnoDB and XtraDB databases. It falls into the physical backup category, which consists of exact copies of the MySQL data directory and files underneath it.

XtraBackup does not lock your database during the backup process. For large databases (100+ GB), it provides much better restoration time as compared to mysqldump. The restoration process involves preparing MySQL data from the backup files, before replacing or switching it with the current data directory on the target node.

Avoiding Lock-in for Database High Availability and Scalability

It is said that if you are not designing for failure, then you are heading for a crash. How do you create a database system from the ground up to withstand failure? This can be a challenge as failures happen in many different ways, sometimes in ways that would be hard to imagine. It is a consequence of the complexity of today's database environments.

Clustering is an expensive feature of databases like Oracle and SQL Server. It requires extra licenses. 

Galera Cluster is a mainstream option for high availability MySQL and MariaDB. And though it has established itself as a credible replacement for traditional MySQL master-slave architectures, it is not a drop-in replacement.

Galera Cluster is a synchronous active-active database clustering technology for MySQL and MariaDB. Galera Cluster differs from what is known as Oracle’s MySQL Cluster - NDB. MariaDB cluster is based on the multi-master replication plugin provided by Codership.

While the Galera Cluster has some characteristics that make it unsuitable for specific use cases, most applications can still be adapted to run on it.

The benefits are clear: multi-master InnoDB setup with built-in failover and read scalability.

Avoiding Lock-in for Database Load Balancing

Proxies are building blocks of high availability setups for MySQL. They can detect failed nodes and route queries to hosts that are still available. If your master failed and you had to promote one of your slaves, proxies will detect such topology changes and route your traffic accordingly.

More advanced proxies can do much more, such as route traffic based on precise query rules, cache queries, or mirror them. They can be even used to implement different types of sharding.

The most useful ones are ProxySQL, HAproxy, MaxScale (limited free usage).

ClusterControl: ProxySQL Load Balancing

Avoiding Lock-in When Migrating to the Cloud

In the last ten years, many businesses have moved to cloud-based technology to avoid the budgetary limitations for data centers and agile software development. Utilizing the cloud enables your company and applications to profit from the cost-savings and versatility that originate with cloud computing.

While cloud solutions offer companies many benefits, it still introduces some risks. For example, vendor lock-in is as high in the cloud as it was in the data center.

As more companies run their workloads in the cloud, cloud database services are increasingly being used to manage data. One of the advantages of using a cloud database service instead of maintaining your database is that it reduces the management overhead. Database services from the leading cloud vendors share many similarities, but they have individual characteristics that may make them well-, or ill-suited to your workload.

ClusterControl: Deploy various database systems in the cloud

The Database Hosting Hybrid Model

As more enterprises are moving to the cloud, the hybrid model is actually becoming more popular. The hybrid model is seen as a safe model for many businesses. 

In fact, it's challenging to do a heart transplant and port everything over immediately. Many companies are doing a slow migration that usually takes a year or even maybe forever until everything is migrated. The move should be made in an acceptable peace.

The hybrid model will not only allow you to build a highly available scalable system but due to its nature is a great first step to avoid lock-in. By architecture design, your systems will work in a kind of mixed mode.

An example of such architectures could be a cluster that operates in house data center and it’s copy located in the cloud. 

ClusterControl: Cluster to Cluster Replication

Conclusion

Migrating from a proprietary database to open source can come with several benefits: lower cost of ownership, access to and use of an open-source database engine, tight integration with the web. Open source has many to offer and due its nature is a great option to avoid vendor lock-in.


Tips for Migrating from MySQL Replication to MySQL Galera Cluster 4.0

$
0
0

We have previously blogged about What’s New in MySQL Galera Cluster 4.0, Handling Large Transactions with Streaming Replication and MariaDB 10.4 and presented some guides about using the new Streaming Replication feature in a part 1& part 2 series.

Moving your database technology from MySQL Replication to MySQL Galera Cluster requires you to have the right skills and an understanding of what you are doing to be successful. In this blog we’ll share some tips for migrating from a MySQL Replication setup to MySQL Galera Cluster 4.0 one.

The Differences Between MySQL Replication and Galera Cluster

If you're not yet familiar with Galera, we suggest you to go over our Galera Cluster for MySQL Tutorial. Galera Cluster uses a whole different level of replication based on synchronous replication, in contrast to the MySQL Replication which uses asynchronous replication (but could be configured also to achieve a semi-synchronous replication). 

Galera Cluster also supports multi-master replication. It is capable of unconstrained parallel applying (i.e., “parallel replication”), multicast replication, and automatic node provisioning. 

The primary focus of Galera Cluster is data consistency, whereas with MySQL Replication, it's prone to data inconsistency (which can be avoided with best practices and proper configuration such as enforcing read-only on the slaves to avoid unwanted writes within the slaves).

Although transactions received by Galera are either applied to every node or not at all,  each of these nodes certifies the replicated write-set in the applier queue (transaction commits) which also includes information on all of the locks that were held by the database during the transaction. These write-set, once no conflicting locks identified, are applied. Up to this point, transactions are considered committed and continues to apply it to the tablespace. Unlike in asynchronous replication, this approach is also called virtually synchronous replication since the writes and commits happens in a logical synchronous mode but the actual writing and committing to the tablespace happens independently and goes asynchronous on each node.

Unlike MySQL Replication, a Galera Cluster is a true multi-master, multi-threaded slave, a pure hot-standby, with no need for master-failover or read-write splitting. However, migrating to Galera Cluster doesn't mean an automatic answer to your problems. Galera Cluster supports only InnoDB, so there could be design modifications if you are using MyISAM or Memory storage engines. 

Converting Non-InnoDB Tables to InnoDB

Galera Cluster does allow you to use MyISAM, but this is not what Galera Cluster was designed for. Galera Cluster is designed to strictly implement data consistency within all of the nodes within the Cluster and this requires a strong ACID compliant database engine. InnoDB is an engine that has this strong capabilities in this area and is recommended that you use InnoDB; especially when dealing with transactions.

If you're using ClusterControl, you can benefit easily to determine your database instance(s) for any MyISAM tables which is provided by Performance Advisors. You can find this under Performance → Advisors tab. For example,

If you require MyISAM and MEMORY tables, you can still use it but make sure your data that does not need to be replicated. You can use your data stored for read-only and, use "START TRANSACTION READONLY" wherever appropriate.

Adding Primary Keys To your InnoDB Tables

Since Galera Cluster only supports InnoDB, it is very important that all of your tables must have a clustered index, (also called primary key or unique key).  To get the best performance from queries, inserts, and other database operations, it is very important that you must define every table with a unique key(s) since InnoDB uses the clustered index to optimize the most common lookup and DML operations for each table. This helps avoid long running queries within the cluster and possible can slow down write/read operations in the cluster.

In ClusterControl, there are advisors which can notify you of this. For example, in your MySQL Replication master/slave cluster, you'll an alarm from the or view from the list of advisors. The example screenshot below reveals that you have no tables that has no primary key:

Identify a Master (or Active-Writer) Node

Galera Cluster is purely a true multi-master replication. However, it doesn't mean that you're all free to write whichever node you would like to target. One thing to identify is, when writing on a different node and a conflicting transaction will be detected, you'll get into a deadlock issue just like below:

2019-11-14T21:14:03.797546Z 12 [Note] [MY-011825] [InnoDB] *** Priority TRANSACTION:

TRANSACTION 728431, ACTIVE 0 sec starting index read

mysql tables in use 1, locked 1

MySQL thread id 12, OS thread handle 140504401893120, query id 1414279 Applying batch of row changes (update)

2019-11-14T21:14:03.797696Z 12 [Note] [MY-011825] [InnoDB] *** Victim TRANSACTION:

TRANSACTION 728426, ACTIVE 3 sec updating or deleting

mysql tables in use 1, locked 1

, undo log entries 11409

MySQL thread id 57, OS thread handle 140504353195776, query id 1414228 localhost root updating

update sbtest1_success set k=k+1 where id > 1000 and id < 100000

2019-11-14T21:14:03.797709Z 12 [Note] [MY-011825] [InnoDB] *** WAITING FOR THIS LOCK TO BE GRANTED:

RECORD LOCKS space id 1663 page no 11 n bits 144 index PRIMARY of table `sbtest`.`sbtest1_success` trx id 728426 lock_mode X

Record lock, heap no 1 PHYSICAL RECORD: n_fields 1; compact format; info bits 0

 0: len 8; hex 73757072656d756d; asc supremum;;

The problem with multiple nodes writing without identifying a current active-writer node, you'll end up with these issues which are very common problems I've seen when using Galera Cluster when writing on multiple nodes at the same time. In order to avoid this, you can use single-master setup approach:

From the documentation,

To relax flow control, you might use the settings below:

wsrep_provider_options = "gcs.fc_limit = 256; gcs.fc_factor = 0.99; gcs.fc_master_slave = YES"

The above requires a server restart since fc_master_slave is not dynamic.

Enable Debugging Mode For Logging Conflicts or Deadlocks

Debugging or tracing issues with your Galera Cluster is very important. Locks in Galera is implemented differently compared to MySQL Replication. It uses optimistic locking when dealing with transactions cluster-wide. Unlike the MySQL Replication, it has only pessimistic locking which doesn't know if there's such same or conflicting transaction being executed in a co-master on a multi-master setup. Galera still uses pessimistic locking but on the local node since it's managed by InnoDB, which is the storage engine supported. Galera uses optimistic locking when it goes to other nodes. This means that no checks are made with other nodes on the cluster when local locks are attained (pessimistic locking). Galera assumes that, once the transaction passes the commit phase within the storage engine and the other nodes are informed, everything will be okay and no conflicts will arise.

In practice, it's best to enable wsrep_logs_conflicts. This will log the details of conflicting MDL as well as InnoDB locks in the cluster. Enabling this variable can be set dynamically but caveat once this is enabled. It will verbosely populate your error-log file and can fill up your disk once your error-log file size is too large.

Be Careful With Your DDL Queries

Unlike MySQL Replication, running an ALTER statement can affect only incoming connections that requires to access or reference that table targeted by your ALTER statement. It can also affect slaves if the table is large and can bring slave lag. However, writes to your master won't be block as long as your queries does not conflict with the current ALTER. However, this is entirely not the case when running your DDL statements such as ALTER with Galera Cluster. ALTER statements  can bring problems such as Galera Cluster stuck due to cluster-wide lock or flow control starts to relax the replication while some nodes are recovering from large writes.

In some situations, you might end up having downtime to your Galera Cluster if that table is too large and is a primary and vital table to your application. However, it can be achieved without downtime. As Rick James pointed out in his blog, you can follow the recommendations below:

RSU vs TOI

  • Rolling Schema Upgrade = manually do one node (offline) at a time
  • Total Order Isolation = Galera synchronizes so that it is done at the same time (in the replication sequence) on all nodes. RSU and TOI

Caution: Since there is no way to synchronize the clients with the DDL, you must make sure that the clients are happy with either the old or the new schema. Otherwise, you will probably need to take down the entire cluster while simultaneously switching over both the schema and the client code.

A "fast" DDL may as well be done via TOI. This is a tentative list of such:

  • CREATE/DROP/RENAME DATABASE/TABLE
  • ALTER to change DEFAULT
  • ALTER to change definition of ENUM or SET (see caveats in manual)
  • Certain PARTITION ALTERs that are fast.
  • DROP INDEX (other than PRIMARY KEY)
  • ADD INDEX?
  • Other ALTERs on 'small' tables.
  • With 5.6 and especially 5.7 having a lot of ALTER ALGORITHM=INPLACE cases, check which ALTERs should be done which way.

Otherwise, use RSU. Do the following separately for each node:

SET GLOBAL wsrep_OSU_method='RSU';

This also takes the node out of the cluster.

ALTER TABLE
SET GLOBAL wsrep_OSU_method='TOI';

Puts back in, leading to resync (hopefully a quick IST, not a slow SST)

Preserve the Consistency Of Your Cluster

Galera Cluster does not support replication filters such as binlog_do_db or binlog_ignore_db since Galera does not rely with binary logging. It relies on the ring-buffer file also called GCache which stores write-sets that are replicated along the cluster. You cannot apply any inconsistent behavior or state of such database nodes. 

Galera, on the other hand, strictly implements data consistency within the cluster. It's still possible that there can be inconsistency where rows or records cannot be found. For example, setting your variable wsrep_OSU_method either RSU or TOI for your DDL ALTER statements might bring inconsistent behavior.  Check this external blog from Percona discussing about inconsistency with Galera with TOI vs RSU.

Setting wsrep_on=OFF and subsequently run DML or DDL queries can be dangerous to your cluster. You must also review your stored procedures, triggers, functions, events, or views if results are not dependent on a node's state or environment. When a certain node(s) can be inconsistent, it can potentially bring the entire cluster to go down. Once Galera detects an inconsistent behavior, Galera will attempt to leave the cluster and terminate that node. Hence, it's possible that all of the nodes can be inconsistent leaving you under a state of dilemma. 

If a Galera Cluster node as well experiences a crash especially upon a high-traffic period, it's better not to start right away the node. Instead, perform a full SST or bring a new instance as soon as possible or once the traffic goes low. It can be possible that node can bring inconsistent behavior which might have corrupted data. 

Segregate Large Transactions and Determine Whether to Use Streaming Replication 

Let's get straight on this one. One of the biggest changes features especially on Galera Cluster 4.0 is the streaming replication. Past versions of Galera Cluster 4.0, it limits transactions < 2GiB which is typically controlled by variables wsrep_max_ws_rows and wsrep_max_ws_size. Since Galera Cluster 4.0, you can able to send > 2GiB of transactions but you must determine how large the fragments has to be processed during replication. It has to be set by session and the only variables you need to take care are wsrep_trx_fragment_unit and wsrep_trx_fragment_size. Disabling the Streaming Replication is simple as setting the wsrep_trx_fragment_size = 0 will do it. Take note that, replicating a large transaction also possess overhead on the slave nodes (nodes that are replicating against the current active-writer/master node) since logs will be written to wsrep_streaming_log table in the MySQL database.

Another thing to add, since you're dealing with large transaction, it's considerable that your transaction might take some time to finish so setting the variable innodb_lock_wait_timeout high must have to be taken into account. Set this via session depending on the time you estimate but larger than the time you estimate it to finish, otherwise raise a timeout.

We recommend you read this previous blog about streaming replication in action.

Replicating GRANTs Statements

If you're using GRANTs and related operations act on the MyISAM/Aria tables in the database `mysql`. The GRANT statements will be replicated, but the underlying tables will not. So this means, INSERT INTO mysql.user ... will not be replicated because the table is MyISAM.

However, the above might not be true anymore since Percona XtraDB Cluster(PXC) 8.0 (currently experimental) as mysql schema tables have been converted to InnoDB, whilst in MariaDB 10.4, some of the tables are still in Aria format but others are in CSV or InnoDB. You should determine what version and provider of Galera you have but best to avoid using DML statements referencing mysql schema. Otherwise, you might end up on unexpected results unless you're sure that this is PXC 8.0.

XA Transactions, LOCK/UNLOCK TABLES, GET_LOCK/RELEASE_LOCK are Not Supported

Galera Cluster does not support XA Transactions since XA Transactions handles rollback and commits differently. LOCK/UNLOCK or GET_LOCK/RELEASE_LOCK statements are dangerous to be applied or used with Galera. You might experience a crash or locks that are not killable and stay locked. For example,

---TRANSACTION 728448, ACTIVE (PREPARED) 13356 sec

mysql tables in use 2, locked 2

3 lock struct(s), heap size 1136, 5 row lock(s), undo log entries 5

MySQL thread id 67, OS thread handle 140504353195776, query id 1798932 localhost root wsrep: write set replicated and certified (13)

insert into sbtest1(k,c,pad) select k,c,pad from sbtest1_success limit 5

This transaction has already been unlocked and even been killed but to no avail. We suggest that you have to redesign your application client and get rid of these functions when migrating to Galera Cluster.

Network Stability is a MUST!!!

Galera Cluster can work even with inter-WAN topology or inter-geo topology without any issues (check this blog about implementing inter-geo topology with Galera). However, if your network connectivity between each nodes is not stable or intermittently going down for an unsuspected time, it can be problematic for the cluster. It's best you have a cluster running in a private and local network where each of these nodes are connected. When designing a node as a disaster recovery, then plan to create a cluster if these are on a different region or geography.  You may start reading our previous blog, Using MySQL Galera Cluster Replication to Create a Geo-Distributed Cluster: Part One as this could help you best to decide your Galera Cluster topology.

Another thing to add about investing your network hardware, it would be problematic if your network transfer rate provides you a lower speed during rebuilding of an instance during IST or worse at SST especially if your data set is massive. It can take long hours of network transfer and that might affect the stability of your cluster especially if you have a 3-node cluster while 2 nodes are not available where these 2 are a donor and a joiner. Take note that, during SST phase, the DONOR/JOINER nodes cannot be in-used until it's finally able to sync with the primary cluster.

In previous version of Galera, when it comes to donor node selection, the State Snapshot Transfer (SST) donor was selected at random. In Glera 4, it has much more improved and has the ability to choose the right donor within the cluster, as it will favour a donor that can provide an Incremental State Transfer (IST), or pick a donor in the same segment. Alternatively, you can set wsrep_sst_donor variable to the right donor you would like to always pick.

Backup Your Data and Do Rigid Testing During Migration and Before Production

Once you are suit up and has decided to try and migrate your data to Galera Cluster 4.0, make sure you always have your backup prepared. If you tried ClusterControl, taking backups shall be easier to do this.

Ensure that you are migrating to the right version of InnoDB and do not forget to always apply and run mysql_upgrade before doing the test. Ensure that all your test passes the desired result from which the MySQL Replication can offer you. Most likely, there's no difference with the InnoDB storage engine you're using in a MySQL Replication Cluster versus the MySQL Galera Cluster as long as the recommendations and tips have been applied and prepared beforehand.

Conclusion

Migrating to Galera Cluster 4.0 might not be your desired database technology solution. However, it is not pulling you away to utilize Galera Cluster 4.0 as long as its specific requirements can be prepared, setup, and provided. Galera Cluster 4.0 has now become a very powerful viable choice and option especially on a highly-available platform and solution. We also suggest that you read these external blogs about Galera Caveats or the Limitations of Galera Cluster or this manual from MariaDB.

How ClusterControl Performs Automatic Database Recovery and Failover

$
0
0

ClusterControl is programmed with a number of recovery algorithms to automatically respond to different types of common failures affecting your database systems. It understands different types of database topologies and database-related process management to help you determine the best way to recover the cluster. In a way, ClusterControl improves your database availability.

Some topology managers only cover cluster recovery like MHA, Orchestrator and mysqlfailover but you have to handle the node recovery by yourself. ClusterControl supports recovery at both cluster and node level.

Configuration Options

There are two recovery components supported by ClusterControl, namely:

  • Cluster - Attempt to recover a cluster to an operational state
  • Node - Attempt to recover a node to an operational state

These two components are the most important things in order to make sure the service availability is as high as possible. If you already have a topology manager on top of ClusterControl, you can disable automatic recovery feature and let other topology manager handle it for you. You have all the possibilities with ClusterControl. 

The automatic recovery feature can be enabled and disabled with a simple toggle ON/OFF, and it works for cluster or node recovery. The green icons mean enabled and red icons means disabled. The following screenshot shows where you can find it in the database cluster list:

There are 3 ClusterControl parameters that can be used to control the recovery behaviour. All parameters are default to true (set with boolean integer 0 or 1):

  • enable_autorecovery - Enable cluster and node recovery. This parameter is the superset of enable_cluster_recovery and enable_node_recovery. If it's set to 0, the subset parameters will be turned off.
  • enable_cluster_recovery - ClusterControl will perform cluster recovery if enabled.
  • enable_node_recovery - ClusterControl will perform node recovery if enabled.

Cluster recovery covers recovery attempt to bring up entire cluster topology. For example, a master-slave replication must have at least one master alive at any given time, regardless of the number of available slave(s). ClusterControl attempts to correct the topology at least once for replication clusters, but infinitely for multi-master replication like NDB Cluster and Galera Cluster.

Node recovery covers node recovery issue like if a node was being stopped without ClusterControl knowledge, e.g, via system stop command from SSH console or being killed by OOM process.

Node Recovery

ClusterControl is able to recover a database node in case of intermittent failure by monitoring the process and connectivity to the database nodes. For the process, it works similarly to systemd, where it will make sure the MySQL service is started and running unless if you intentionally stopped it via ClusterControl UI.

If the node comes back online, ClusterControl will establish a connection back to the database node and will perform the necessary actions. The following is what ClusterControl would do to recover a node:

  • It will wait for systemd/chkconfig/init to start up the monitored services/processes for 30 seconds
  • If the monitored services/processes are still down, ClusterControl will try to start the database service automatically.
  • If ClusterControl is unable to recover the monitored services/processes, an alarm will be raised.

Note that if a database shutdown is initiated by user, ClusterControl will not attempt to recover the particular node. It expects the user to start it back via ClusterControl UI by going to Node -> Node Actions -> Start Node or use the OS command explicitly.

The recovery includes all database-related services like ProxySQL, HAProxy, MaxScale, Keepalived, Prometheus exporters and garbd. Special attention to Prometheus exporters where ClusterControl uses a program called "daemon" to daemonize the exporter process. ClusterControl will try to connect to exporter's listening port for health check and verification. Thus, it's recommended to open the exporter ports from ClusterControl and Prometheus server to make sure no false alarm during recovery.

Cluster Recovery

ClusterControl understands the database topology and follows best practices in performing the recovery. For a database cluster that comes with built-in fault tolerance like Galera Cluster, NDB Cluster and MongoDB Replicaset, the failover process will be performed automatically by the database server via quorum calculation, heartbeat and role switching (if any). ClusterControl monitors the process and make necessary adjustments to the visualization like reflecting the changes under Topology view and adjusting the monitoring and management component for the new role e.g, new primary node in a replica set.

For database technologies that do not have built-in fault tolerance with automatic recovery like MySQL/MariaDB Replication and PostgreSQL/TimescaleDB Streaming Replication, ClusterControl will perform the recovery procedures by following the best-practices provided by the database vendor. If the recovery fails, user intervention is required, and of course you will get an alarm notification regarding this.

In a mixed/hybrid topology, for example an asynchronous slave which is attached to a Galera Cluster or NDB Cluster, the node will be recovered by ClusterControl if cluster recovery is enabled.

Cluster recovery does not apply to standalone MySQL server. However, it's recommended to turn on both node and cluster recoveries for this cluster type in the ClusterControl UI.

MySQL/MariaDB Replication

ClusterControl supports recovery of the following MySQL/MariaDB replication setup:

  • Master-slave with MySQL GTID
  • Master-slave with MariaDB GTID
  • Master-slave with without GTID (both MySQL and MariaDB)
  • Master-master with MySQL GTID
  • Master-master with MariaDB GTID
  • Asynchronous slave attached to a Galera Cluster

ClusterControl will respect the following parameters when performing cluster recovery:

  • enable_cluster_autorecovery
  • auto_manage_readonly
  • repl_password
  • repl_user
  • replication_auto_rebuild_slave
  • replication_check_binlog_filtration_bf_failover
  • replication_check_external_bf_failover
  • replication_failed_reslave_failover_script
  • replication_failover_blacklist
  • replication_failover_events
  • replication_failover_wait_to_apply_timeout
  • replication_failover_whitelist
  • replication_onfail_failover_script
  • replication_post_failover_script
  • replication_post_switchover_script
  • replication_post_unsuccessful_failover_script
  • replication_pre_failover_script
  • replication_pre_switchover_script
  • replication_skip_apply_missing_txs
  • replication_stop_on_error

For more details on each of the parameter, refer to the documentation page.

ClusterControl will obey the following rules when monitoring and managing a master-slave replication:

  • All nodes will be started with read_only=ON and super_read_only=ON (regardless of its role).
  • Only one master (read_only=OFF) is allowed to operate at any given time.
  • Rely on MySQL variable report_host to map the topology.
  • If there are two or more nodes that have read_only=OFF at a time, ClusterControl will automatically set read_only=ON on both masters, to protect them against accidental writes. User intervention is required to pick the actual master by disabling the read-only. Go to Nodes -> Node Actions -> Disable Readonly.

In case the active master goes down, ClusterControl will attempt to perform the master failover in the following order:

  1. After 3 seconds of master unreachability, ClusterControl will raise an alarm.
  2. Check the slave availability, at least one of the slaves must be reachable by ClusterControl.
  3. Pick the slave as a candidate to be a master.
  4. ClusterControl will calculate the probability of errant transactions if GTID is enabled. 
  5. If no errant transaction is detected, the chosen will be promoted as the new master.
  6. Create and grant replication user to be used by slaves.
  7. Change master for all slaves that were pointing to the old master to the newly promoted master.
  8. Start slave and enable read only.
  9. Flush logs on all nodes.
  10. If the slave promotion fails, ClusterControl will abort the recovery job. User intervention or a cmon service restart is required to trigger the recovery job again.
  11. When old master is available again, it will be started as read-only and will not be part of the replication. User intervention is required.

At the same time, the following alarms will be raised:

Check out Introduction to Failover for MySQL Replication - the 101 Blog and Automatic Failover of MySQL Replication - New in ClusterControl 1.4 to get further information on how to configure and manage MySQL replication failover with ClusterControl.

PostgreSQL/TimescaleDB Streaming Replication

ClusterControl supports recovery of the following PostgreSQL replication setup:

ClusterControl will respect the following parameters when performing cluster recovery:

  • enable_cluster_autorecovery
  • repl_password
  • repl_user
  • replication_auto_rebuild_slave
  • replication_failover_whitelist
  • replication_failover_blacklist

For more details on each of the parameter, refer to the documentation page.

ClusterControl will obey the following rules for managing and monitoring a PostgreSQL streaming replication setup:

  • wal_level is set to "replica" (or "hot_standby" depending on the PostgreSQL version).
  • Variable archive_mode is set to ON on the master.
  • Set recovery.conf file on the slave nodes, which turns the node into a hot standby with read-only enabled.

In case if the active master goes down, ClusterControl will attempt to perform the cluster recovery in the following order:

  1. After 10 seconds of master unreachability, ClusterControl will raise an alarm.
  2. After 10 seconds of graceful waiting timeout, ClusterControl will initiate the master failover job.
  3. Sample the replayLocation and receiveLocation on all available nodes to determine the most advanced node.
  4. Promote the most advanced node as the new master.
  5. Stop slaves.
  6. Verify the synchronization state with pg_rewind.
  7. Restarting slaves with the new master.
  8. If the slave promotion fails, ClusterControl will abort the recovery job. User intervention or a cmon service restart is required to trigger the recovery job again.
  9. When old master is available again, it will be forced to shut down and will not be part of the replication. User intervention is required. See further down.

When the old master comes back online, if PostgreSQL service is running, ClusterControl will force shutdown of the PostgreSQL service. This is to protect the server from accidental writes, since it would be started without a recovery file (recovery.conf), which means it would be writable. You should expect the following lines will appear in postgresql-{day}.log:

2019-11-27 05:06:10.091 UTC [2392] LOG:  database system is ready to accept connections

2019-11-27 05:06:27.696 UTC [2392] LOG:  received fast shutdown request

2019-11-27 05:06:27.700 UTC [2392] LOG:  aborting any active transactions

2019-11-27 05:06:27.703 UTC [2766] FATAL:  terminating connection due to administrator command

2019-11-27 05:06:27.704 UTC [2758] FATAL:  terminating connection due to administrator command

2019-11-27 05:06:27.709 UTC [2392] LOG:  background worker "logical replication launcher" (PID 2419) exited with exit code 1

2019-11-27 05:06:27.709 UTC [2414] LOG:  shutting down

2019-11-27 05:06:27.735 UTC [2392] LOG:  database system is shut down

The PostgreSQL was started after the server was back online around 05:06:10 but ClusterControl performs a fast shutdown 17 seconds after that around 05:06:27. If this is something that you would not want it to be, you can disable node recovery for this cluster momentarily.

Check out Automatic Failover of Postgres Replication and Failover for PostgreSQL Replication 101 to get further information on how to configure and manage PostgreSQL replication failover with ClusterControl.

Conclusion

ClusterControl automatic recovery understands database cluster topology and is able to recover a down or degraded cluster to a fully operational cluster which will improve the database service uptime tremendously. Try ClusterControl now and achieve your nines in SLA and database availability. Don't know your nines? Check out this cool nines calculator.

Clustered Database Node Failure and its Impact on High Availability

$
0
0

A node crash can happen at any time, it is unavoidable in any real world situation. Back then, when giant, standalone databases roamed the data world, each fall of such a titan created ripples of issues that moved across the world. Nowadays data world has changed. Few of the titans survived, they were replaced by swarms of small, agile, clustered database instances that can adapt to the ever changing business requirements. 

One example of such a database is Galera Cluster, which (typically) is deployed in the form of a cluster of nodes. What changes if one of the Galera nodes fail? How does this affect the availability of the cluster as a whole? In this blog post we will dig into this and explain the Galera High Availability basics.

Galera Cluster and Database High Availability

Galera Cluster is typically deployed in clusters of at least three nodes. This is due to the fact that Galera uses a quorum mechanism to ensure that the cluster state is clear for all of the nodes and that the automated fault handling can happen. For that three nodes are required - more than 50% of the nodes have to be alive after a node’s crash in order for cluster to be able to operate.

Galera Cluster

Let’s assume you have a three nodes in Galera Cluster, just as on the diagram above. If one node crashes, the situation changes into following:

Node “3” is off but there are nodes “1” and “2”, which consist of 66% of all nodes in the cluster. This means, those two nodes can continue to operate and form a cluster. Node “3” (if it happens to be alive but it cannot connect to the other nodes in the cluster) will account for 33% of the nodes in the cluster, thus it will cease to operate.

We hope this is now clear: three nodes are the minimum. With two nodes each would be 50% of the nodes in the cluster thus neither will have majority - such cluster does not provide HA. What if we would add one more node?

Such setup allows also for one node to fail:

In such case we have three (75%) nodes up-and-running, which is the majority. What would happen if two nodes fail?

Two nodes are up, two are down. Only 50% of the nodes are available, there is no majority thus cluster has to cease its operations. The minimal cluster size to support failure of two nodes is five nodes:

In the case as above two nodes are off, three are remaining which makes it 60% available thus the majority is reached and cluster can operate.

To sum up, three nodes are the minimum cluster size to allow for one node to fail. Cluster should have an odd number of nodes - this is not a requirement but as we have seen, increasing cluster size from three to four did not make any difference on the high availability - still only one failure at the same time is allowed. To make the cluster more resilient and support two node failures at the same time, cluster size has to be increased from three to five. If you want to increase the cluster's ability to handle failures even further you have to add another two nodes.

Impact of Database Node Failure on the Cluster Load

In the previous section we have discussed the basic math of the high availability in Galera Cluster. One node can be off in a three node cluster, two off in a five node cluster. This is a basic requirement for Galera. 

You have to also keep in mind other aspects too. We’ll take a quick look at them just now. For starters, the load on the cluster. 

Let’s assume all nodes have been created equal. Same configuration, same hardware, they can handle the same load. Having load on one node only doesn’t make too much sense cost-wise on three node cluster (not to mention five node clusters or larger). You can safely expect that if you invest in three or five galera nodes you want to utilize all of them. This is quite easy - load balancers can distribute the load across all Galera nodes for you. You can send the writes to one node and balance reads across all nodes in the cluster. This poses additional threat you have to keep in mind. How does the load will look like if one node will be taken out of the cluster? Let’s take a look at the following case of a five node cluster.

We have five nodes, each one is handling 50% load. This is quite ok, nodes are fairly loaded yet they still have some capacity to accommodate unexpected spikes in the workload. As we discussed, such cluster can handle up to two node failures. Ok, let’s see how this would look like:

Two nodes are down, that’s ok. Galera can handle it. 100% of the load has to be redistributed across three remaining nodes. This makes it a total 250% of the load distributed across three nodes. As a result, each of them will be running at 83% of their capacity. This may be acceptable but 83% of the load on average means that the response time will be increased, queries will take longer and any spike in the workload most likely will cause serious issues. 

Will our five node cluster (with 50% utilization of all nodes) really able to handle failure of two nodes? Well, not really, no. It will definitely not be as performant as the cluster before the crashes. It may survive but it’s availability may be seriously affected by temporary spikes in the workload.

You also have to keep in mind one more thing - failed nodes will have to be rebuilt. Galera has an internal mechanism that allows it to provision nodes which join the cluster after the crash. It can either be IST, incremental state transfer, when one of the remaining nodes have required data in gcache. If not, full data transfer will have to happen - all data will be transferred from one node (donor) to the joining node. The process is called SST - state snapshot transfer. Both IST and SST requires some resources. Data has to be read from disk on the donor and then transferred over the network. IST is more light-weight, SST is much heavier as all the data has to be read from disk on the donor. No matter which method will be used, some additional CPU cycles will be burnt. Will the 17% of the free resources on the donor enough to run the data transfer? It’ll depend on the hardware. Maybe. Maybe not. What doesn’t help is that most of the proxies, by default, remove donor node from the pool of nodes to send traffic to. This makes perfect sense - node in “Donor/Desync” state may lag behind the rest of the cluster. 

When using Galera, which is virtually a synchronous cluster, we don’t expect nodes to lag. This could be a serious issue for the application. On the other hand, in our case, removing donor from the pool of nodes to load balance the workload ensures that the cluster will be overloaded (250% of the load will be distributed across two nodes only, 125% of node’s capacity is, well, more than it can handle). This would make the cluster definitely not available at all.

Conclusion

As you can see, high availability in the cluster is not just a matter of quorum calculation. You have to account for other factors like workload, its change in time, handling state transfers. When in doubt, test yourself. We hope this short blog post helped you to understand that high availability is quite a tricky subject even if only discussed based on two variables - number of nodes and node’s capacity. Understanding this should help you design better and more reliable HA environments with Galera Cluster.

ClusterControl CMON HA for Distributed Database High Availability - Part One (Installation)

$
0
0

High Availability is a paramount nowadays and there’s no better way to introduce high availability than to build it on top of the quorum-based cluster. Such cluster is able to easily handle failures of individual nodes and ensure that all nodes, which have disconnected from the cluster, will not continue to operate. There are several protocols that allow you to solve consensus issues, examples being Paxos or RAFT. You can always introduce your own code. 

With this in mind, we would like to introduce you to CMON HA, a solution we created which allows to build highly available clusters of cmon daemons to achieve ClusterControl high availability. Please keep in mind this is a beta feature - it works but we are adding better debugging and more usability features. Having said that, let’s take a look at how it can be deployed, configured and accessed.

Prerequisites

CMON, the daemon that executes tasks in ClusterControl, works with a MySQL database to store some of the data - configuration settings, metrics, backup schedules and many others. In the typical setup this is a standalone MySQL instance. As we want to build highly available solution, we have to consider highly available database backend as well. One of the common solutions for that is MySQL Galera Cluster. As the installation scripts for ClusterControl sets up the standalone database, we have to deploy our Galera Cluster first, before we attempt to install highly available ClusterControl. What is the better way of deploying a Galera cluster than using ClusterControl? We will use temporary ClusterControl to deploy Galera on top of which we will deploy highly available version of ClusterControl.

Deploying a MySQL Galera Cluster

We won’t cover here the installation of the standalone ClusterControl. It’s as easy as downloading it for free and then following the steps you are provided with. Once it is ready, you can use the deployment wizard to deploy 3 nodes of Galera Cluster in couple of minutes.

Pick the deployment option, you will be then presented with a deployment wizard.

Define SSH connectivity details. You can use either root or password or passwordless sudo user. Make sure you correctly set SSH port and path to the SSH key.

Then you should pick a vendor, version and few of the configuration details including server port and root password. Finally, define the nodes you want to deploy your cluster on. Once this is done, ClusterControl will deploy a Galera cluster on the nodes you picked. From now on you can as well remove this ClusterControl instance, it won’t be needed anymore.

Deploying a Highly Available ClusterControl Installation

We are going to start with one node, configure it to start the cluster and then we will proceed with adding additional nodes.

Enabling Clustered Mode on the First Node

What we want to do is to deploy a normal ClusterControl instance therefore we are going to proceed with typical installation steps. We can download the installation script and then run it. The main difference, compared to the steps we took when we installed a temporary ClusterControl to deploy Galera Cluster, is that in this case there is already existing MySQL database. Thus the script will detect it, ask if we want to use it and if so, request password for the superuser. Other than that, installation is basically the same.

Next step would be to reconfigure cmon to listen not only on the localhost but also to bind to IP’s that can be accessed from outside. Communication between nodes in the cluster will happen on that IP on port (by default) 9501. We can accomplish this by editing file: /etc/default/cmon and adding IP to the RPC_BIND_ADDRESSES variable:

RPC_BIND_ADDRESSES="127.0.0.1,10.0.0.101"

Afterwards we have to restart cmon service:

service cmon restart

Following step will be to configure s9s CLI tools, which we will use to create and monitor cmon HA cluster. As per the documentation, those are the steps to take:

wget http://repo.severalnines.com/s9s-tools/install-s9s-tools.sh

chmod 755 install-s9s-tools.sh

./install-s9s-tools.sh

Once we have s9s tools installed, we can enable the clustered mode for cmon:

s9s controller --enable-cmon-ha

We can then verify the state of the cluster:

s9s controller --list --long

S VERSION    OWNER GROUP NAME            IP PORT COMMENT

l 1.7.4.3565 system admins 10.0.0.101      10.0.0.101 9501 Acting as leader.

Total: 1 controller(s)

As you can see, we have one node up and it is acting as a leader. Obviously, we need at least three nodes to be fault-tolerant therefore the next step will be to set up the remaining nodes.

Enabling Clustered Mode on Remaining Nodes

There are a couple of things we have to keep in mind while setting up additional nodes. First of all, ClusterControl creates tokens that “links” cmon daemon with clusters. That information is stored in several locations, including in the cmon database therefore we have to ensure every place contains the same token. Otherwise cmon nodes won’t be able to collect information about clusters and execute RPC calls. To do that we should copy existing configuration files from the first node to the other nodes. In this example we’ll use node with IP of 10.0.0.103 but you should do that for every node you plan to include in the cluster.

We’ll start by copying the cmon configuration files to new node:

scp -r /etc/cmon* 10.0.0.103:/etc/

We may need to edit /etc/cmon.cnf and set the proper hostname:

hostname=10.0.0.103

Then we’ll proceed with regular installation of the cmon, just like we did on the first node. There is one main difference though. Script will detect configuration files and ask if we want to install the controller:

=> An existing Controller installation detected!

=> A re-installation of the Controller will overwrite the /etc/cmon.cnf file

=> Install the Controller? (y/N):

We don’t want to do it for now. As on the first node we will be asked if we want to use existing MySQL database. We do want that. Then we’ll be asked to provide passwords:

=> Enter your MySQL root user's password:

=> Set a password for ClusterControl's MySQL user (cmon) [cmon]

=> Supported special characters: ~!@#$%^&*()_+{}<>?

=> Enter a CMON user password:

=> Enter the CMON user password again: => Creating the MySQL cmon user ...

Please make sure you use exactly the same password for cmon user as you did on the first node.

As the next step, we want to install s9s tools on new nodes:

wget http://repo.severalnines.com/s9s-tools/install-s9s-tools.sh

chmod 755 install-s9s-tools.sh

./install-s9s-tools.sh

We want to have them configured exactly as on the first node thus we’ll copy the config:

scp -r ~/.s9s/ 10.0.0.103:/root/

scp /etc/s9s.conf 10.0.0.103:/etc/

There’s one more place where we ClusterControl stores token: /var/www/clustercontrol/bootstrap.php. We want to copy that file as well:

scp /var/www/clustercontrol/bootstrap.php 10.0.0.103:/var/www/clustercontrol/

Finally, we want to install the controller (as we skipped this when we ran the installation script):

apt install clustercontrol-controller

Make sure you do not overwrite existing configuration files. Default options should be safe and leave correct configuration files in place.

There is one more piece of configuration you may want to copy: /etc/default/cmon. You want to copy it to other nodes:

scp /etc/default/cmon 10.0.0.103:/etc/default

Then you want to edit RPC_BIND_ADDRESSES to point to a correct IP of the node.

RPC_BIND_ADDRESSES="127.0.0.1,10.0.0.103"

Then we can start the cmon service on the nodes, one by one, and see if they managed to join the cluster. If everything went well, you should see something like this:

s9s controller --list --long

S VERSION    OWNER GROUP NAME            IP PORT COMMENT

l 1.7.4.3565 system admins 10.0.0.101      10.0.0.101 9501 Acting as leader.

f 1.7.4.3565 system admins 10.0.0.102      10.0.0.102 9501 Accepting heartbeats.

f 1.7.4.3565 system admins 10.0.0.103      10.0.0.103 9501 Accepting heartbeats.

Total: 3 controller(s)

In case of any issues, please check if all the cmon services are bound to the correct IP addresses. If not, kill them and start again, to re-read the proper configuration:

root      8016 0.4 2.2 658616 17124 ?        Ssl 09:16 0:00 /usr/sbin/cmon --rpc-port=9500 --bind-addr='127.0.0.1,10.0.0.103' --events-client='http://127.0.0.1:9510' --cloud-service='http://127.0.0.1:9518'

If you manage to see the output from ‘s9s controller --list --long’ as above, this means that, technically, we have a running cmon HA cluster of three nodes. We can end here but it’s not over yet. The main problem that remains is the UI access. Only leader node can execute jobs. Some of the s9s commands support this but as of now UI does not. This means that the UI will work only on the leader node, in our current situation it is the UI accessible via https://10.0.0.101/clustercontrol

In the second part we will show you one of the ways in which you could solve this problem.

 
Viewing all 210 articles
Browse latest View live