ProxySQL commonly sits between the application and database tiers, in so called reverse-proxy tier. When your application containers are orchestrated and managed by Kubernetes, you might want to use ProxySQL in front of your database servers.
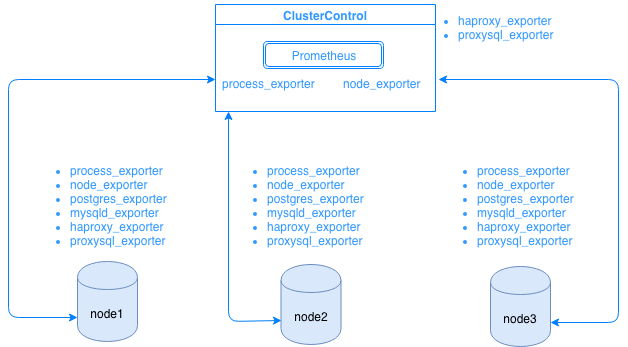
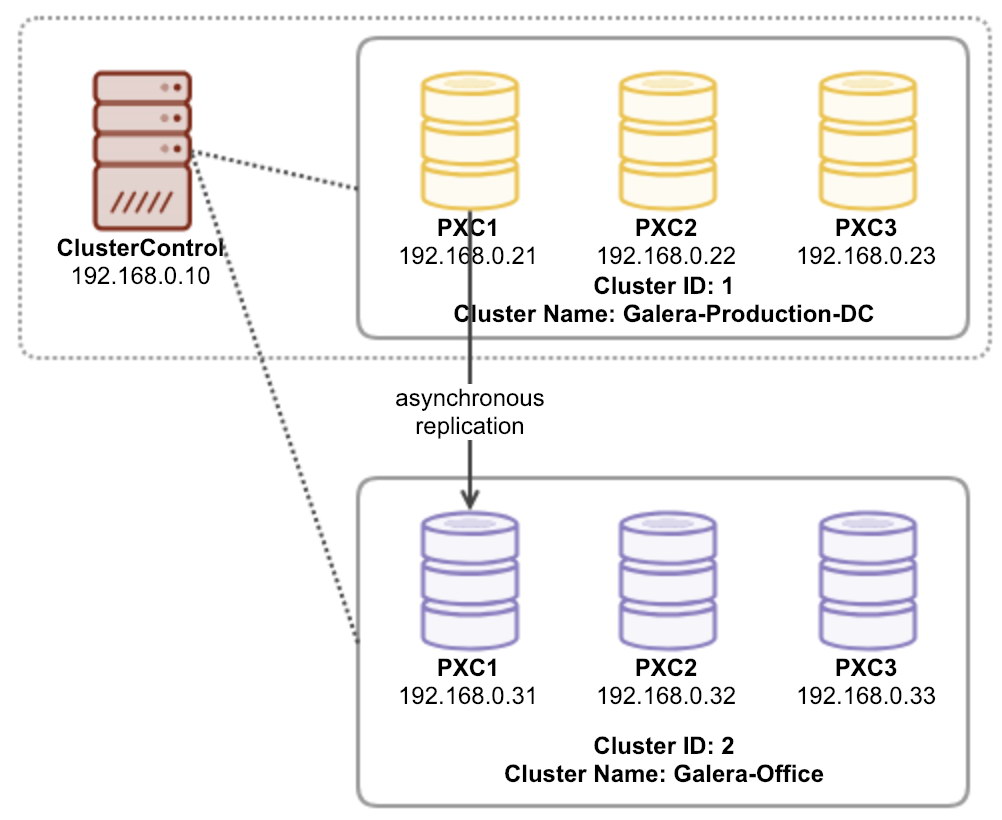
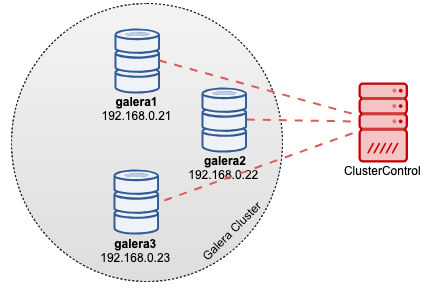
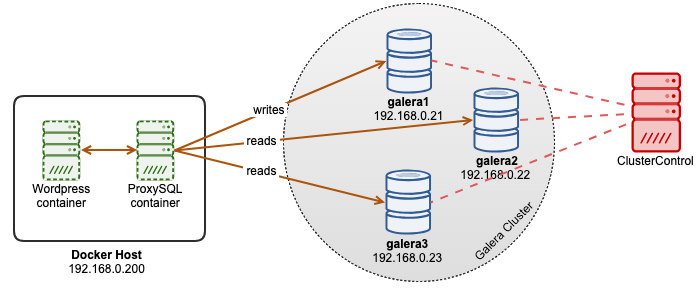
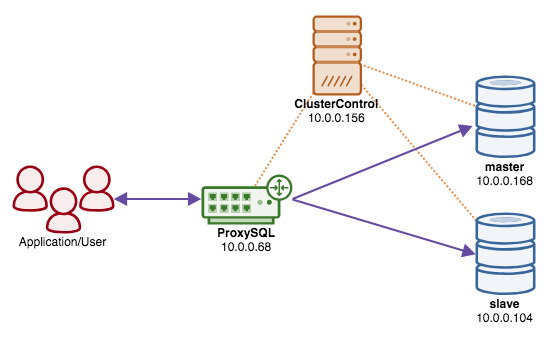
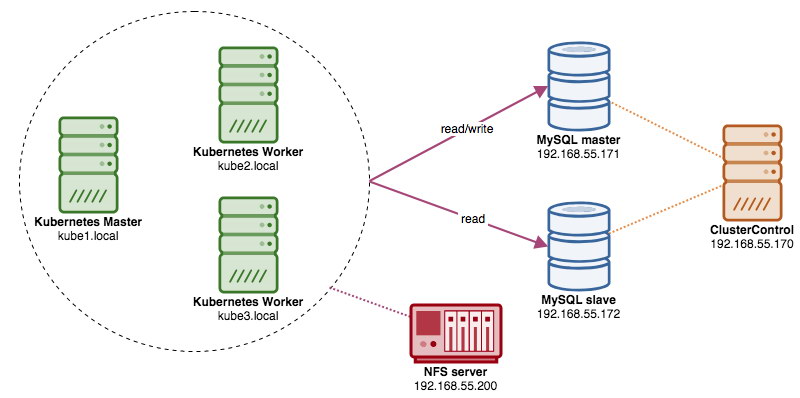
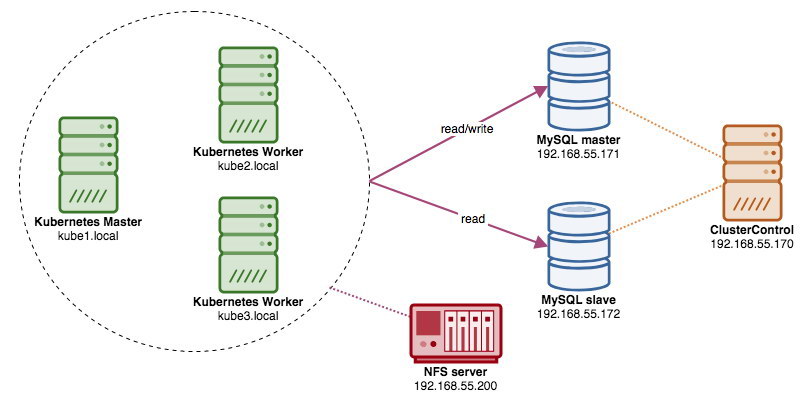
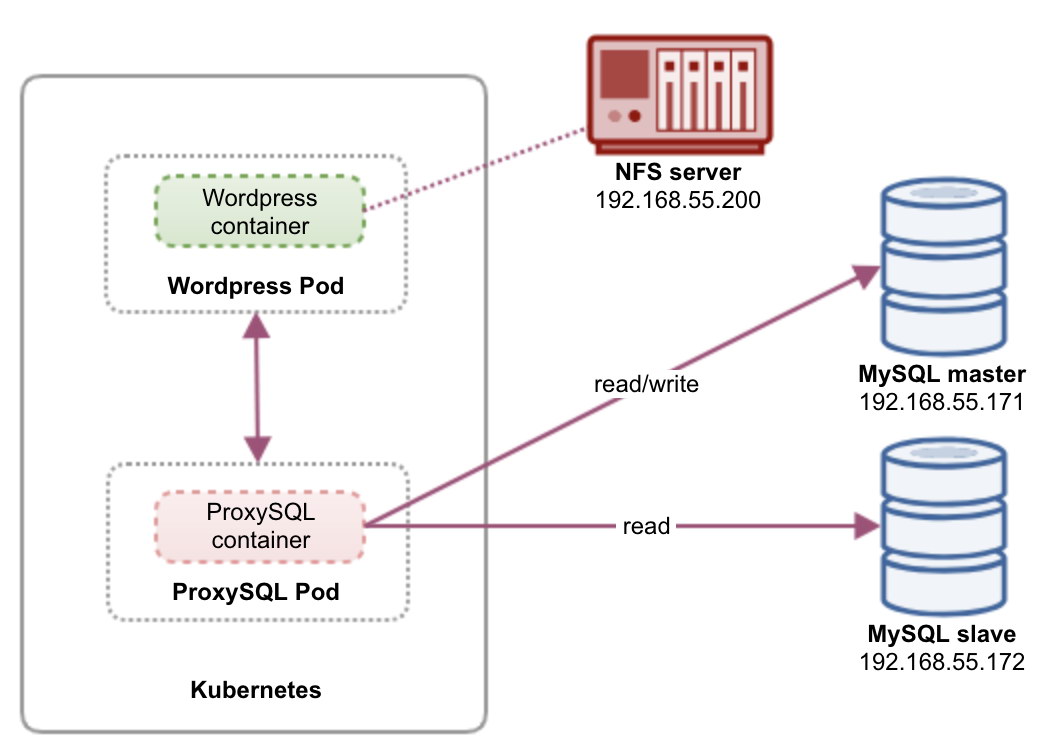
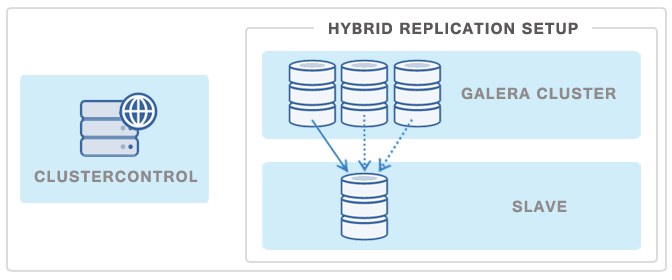
In this post, we’ll show you how to run ProxySQL on Kubernetes as a helper container in a pod. We are going to use Wordpress as an example application. The data service is provided by our two-node MySQL Replication, deployed using ClusterControl and sitting outside of the Kubernetes network on a bare-metal infrastructure, as illustrated in the following diagram:
ProxySQL Docker Image
In this example, we are going to use ProxySQL Docker image maintained by Severalnines, a general public image built for multi-purpose usage. The image comes with no entrypoint script and supports Galera Cluster (in addition to built-in support for MySQL Replication), where an extra script is required for health check purposes.
Basically, to run a ProxySQL container, simply execute the following command:
$ docker run -d -v /path/to/proxysql.cnf:/etc/proxysql.cnf severalnines/proxysql
This image recommends you to bind a ProxySQL configuration file to the mount point, /etc/proxysql.cnf, albeit you can skip this and configure it later using ProxySQL Admin console. Example configurations are provided in the Docker Hub page or the Github page.
ProxySQL on Kubernetes
Designing the ProxySQL architecture is a subjective topic and highly dependent on the placement of the application and database containers as well as the role of ProxySQL itself. ProxySQL does not only route queries, it can also be used to rewrite and cache queries. Efficient cache hits might require a custom configuration tailored specifically for the application database workload.
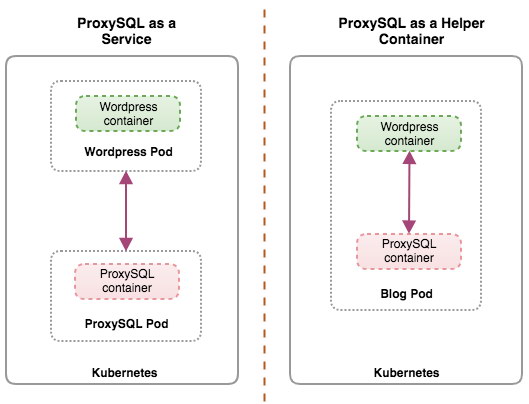
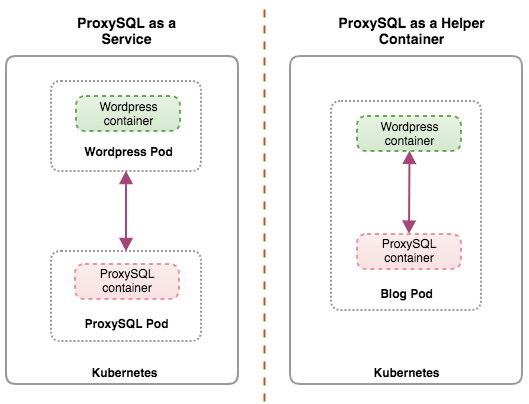
Ideally, we can configure ProxySQL to be managed by Kubernetes with two configurations:
- ProxySQL as a Kubernetes service (centralized deployment).
- ProxySQL as a helper container in a pod (distributed deployment).
The first option is pretty straightforward, where we create a ProxySQL pod and attach a Kubernetes service to it. Applications will then connect to the ProxySQL service via networking on the configured ports. Default to 6033 for MySQL load-balanced port and 6032 for ProxySQL administration port. This deployment will be covered in the upcoming blog post.
The second option is a bit different. Kubernetes has a concept called "pod". You can have one or more containers per pod, these are relatively tightly coupled. A pod’s contents are always co-located and co-scheduled, and run in a shared context. A pod is the smallest manageable container unit in Kubernetes.
Both deployments can be distinguished easily by looking at the following diagram:
The primary reason that pods can have multiple containers is to support helper applications that assist a primary application. Typical examples of helper applications are data pullers, data pushers, and proxies. Helper and primary applications often need to communicate with each other. Typically this is done through a shared filesystem, as shown in this exercise, or through the loopback network interface, localhost. An example of this pattern is a web server along with a helper program that polls a Git repository for new updates.
This blog post will cover the second configuration - running ProxySQL as a helper container in a pod.
ProxySQL as Helper in a Pod
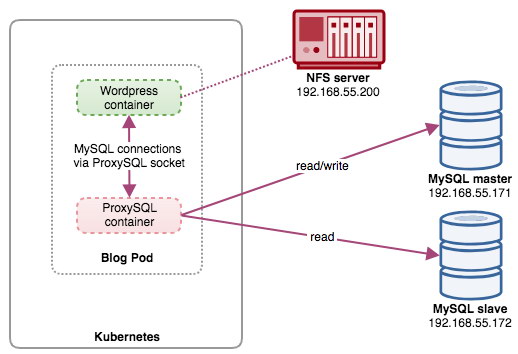
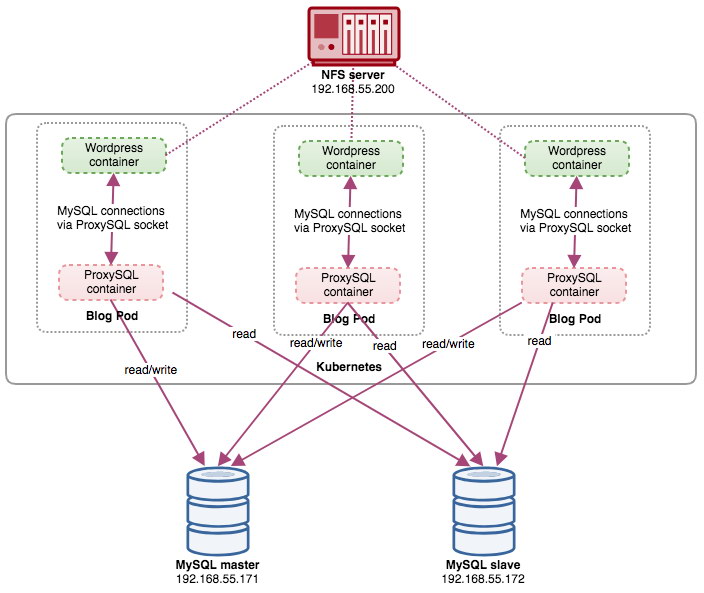
In this setup, we run ProxySQL as a helper container to our Wordpress container. The following diagram illustrates our high-level architecture:
In this setup, ProxySQL container is tightly coupled with the Wordpress container, and we named it as "blog" pod. If rescheduling happens e.g, the Kubernetes worker node goes down, these two containers will always be rescheduled together as one logical unit on the next available host. To keep the application containers' content persistent across multiple nodes, we have to use a clustered or remote file system, which in this case is NFS.
ProxySQL role is to provide a database abstraction layer to the application container. Since we are running a two-node MySQL Replication as the backend database service, read-write splitting is vital to maximize resource consumption on both MySQL servers. ProxySQL excels at this and requires minimal to no changes to the application.
There are a number of other benefits running ProxySQL in this setup:
- Bring query caching capability closest to the application layer running in Kubernetes.
- Secure implementation by connecting through ProxySQL UNIX socket file. It is like a pipe that the server and the clients can use to connect and exchange requests and data.
- Distributed reverse proxy tier with shared nothing architecture.
- Less network overhead due to "skip-networking" implementation.
- Stateless deployment approach by utilizing Kubernetes ConfigMaps.
Preparing the Database
Create the wordpress database and user on the master and assign with correct privilege:
mysql-master> CREATE DATABASE wordpress;
mysql-master> CREATE USER wordpress@'%' IDENTIFIED BY 'passw0rd';
mysql-master> GRANT ALL PRIVILEGES ON wordpress.* TO wordpress@'%';
Also, create the ProxySQL monitoring user:
mysql-master> CREATE USER proxysql@'%' IDENTIFIED BY 'proxysqlpassw0rd';
Then, reload the grant table:
mysql-master> FLUSH PRIVILEGES;
Preparing the Pod
Now, copy paste the following lines into a file called blog-deployment.yml on the host where kubectl is configured:
apiVersion: apps/v1
kind: Deployment
metadata:
  name: blog
  labels:
    app: blog
spec:
  replicas: 1
  selector:
    matchLabels:
      app: blog
      tier: frontend
  strategy:
    type: RollingUpdate
  template:
    metadata:
      labels:
        app: blog
        tier: frontend
    spec:

      restartPolicy: Always

      containers:
      - image: wordpress:4.9-apache
        name: wordpress
        env:
        - name: WORDPRESS_DB_HOST
          value: localhost:/tmp/proxysql.sock
        - name: WORDPRESS_DB_USER
          value: wordpress
        - name: WORDPRESS_DB_PASSWORD
          valueFrom:
            secretKeyRef:
              name: mysql-pass
              key: password
        ports:
        - containerPort: 80
          name: wordpress
        volumeMounts:
        - name: wordpress-persistent-storage
          mountPath: /var/www/html
        - name: shared-data
          mountPath: /tmp

      - image: severalnines/proxysql
        name: proxysql
        volumeMounts:
        - name: proxysql-config
          mountPath: /etc/proxysql.cnf
          subPath: proxysql.cnf
        - name: shared-data
          mountPath: /tmp

      volumes:
      - name: wordpress-persistent-storage
        persistentVolumeClaim:
          claimName: wp-pv-claim
      - name: proxysql-config
        configMap:
          name: proxysql-configmap
      - name: shared-data
        emptyDir: {}
The YAML file has many lines and let's look the interesting part only. The first section:
apiVersion: apps/v1
kind: Deployment
The first line is the apiVersion. Our Kubernetes cluster is running on v1.12 so we should refer to the Kubernetes v1.12 API documentation and follow the resource declaration according to this API. The next one is the kind, which tells what type of resource that we want to deploy. Deployment, Service, ReplicaSet, DaemonSet, PersistentVolume are some of the examples.
The next important section is the "containers" section. Here we define all containers that we would like to run together in this pod. The first part is the Wordpress container:
      - image: wordpress:4.9-apache
        name: wordpress
        env:
        - name: WORDPRESS_DB_HOST
          value: localhost:/tmp/proxysql.sock
        - name: WORDPRESS_DB_USER
          value: wordpress
        - name: WORDPRESS_DB_PASSWORD
          valueFrom:
            secretKeyRef:
              name: mysql-pass
              key: password
        ports:
        - containerPort: 80
          name: wordpress
        volumeMounts:
        - name: wordpress-persistent-storage
          mountPath: /var/www/html
        - name: shared-data
          mountPath: /tmp
In this section, we are telling Kubernetes to deploy Wordpress 4.9 using Apache web server and we gave the container the name "wordpress". We also want Kubernetes to pass a number of environment variables:
- WORDPRESS_DB_HOST - The database host. Since our ProxySQL container resides in the same Pod with the Wordpress container, it's more secure to use a ProxySQL socket file instead. The format to use socket file in Wordpress is "localhost:{path to the socket file}". By default, it's located under /tmp directory of the ProxySQL container. This /tmp path is shared between Wordpress and ProxySQL containers by using "shared-data" volumeMounts as shown further down. Both containers have to mount this volume to share the same content under /tmp directory.
- WORDPRESS_DB_USER - Specify the wordpress database user.
- WORDPRESS_DB_PASSWORD - The password for WORDPRESS_DB_USER. Since we do not want to expose the password in this file, we can hide it using Kubernetes Secrets. Here we instruct Kubernetes to read the "mysql-pass" Secret resource instead. Secrets has to be created in advanced before the pod deployment, as explained further down.
We also want to publish port 80 of the container for the end user. The Wordpress content stored inside /var/www/html in the container will be mounted into our persistent storage running on NFS.
Next, we define the ProxySQL container:
      - image: severalnines/proxysql:1.4.12
        name: proxysql
        volumeMounts:
        - name: proxysql-config
          mountPath: /etc/proxysql.cnf
          subPath: proxysql.cnf
        - name: shared-data
          mountPath: /tmp
        ports:
        - containerPort: 6033
          name: proxysql
In the above section, we are telling Kubernetes to deploy a ProxySQL using severalnines/proxysql image version 1.4.12. We also want Kubernetes to mount our custom, pre-configured configuration file and map it to /etc/proxysql.cnf inside the container. There will be a volume called "shared-data" which map to /tmp directory to share with the Wordpress image - a temporary directory that shares a pod's lifetime. This allows ProxySQL socket file (/tmp/proxysql.sock) to be used by the Wordpress container when connecting to the database, bypassing the TCP/IP networking.
The last part is the "volumes" section:
      volumes:
      - name: wordpress-persistent-storage
        persistentVolumeClaim:
          claimName: wp-pv-claim
      - name: proxysql-config
        configMap:
          name: proxysql-configmap
      - name: shared-data
        emptyDir: {}
Kubernetes will have to create three volumes for this pod:
- wordpress-persistent-storage - Use the PersistentVolumeClaim resource to map NFS export into the container for persistent data storage for Wordpress content.
- proxysql-config - Use the ConfigMap resource to map the ProxySQL configuration file.
- shared-data - Use the emptyDir resource to mount a shared directory for our containers inside the Pod. emptyDir resource is a temporary directory that shares a pod's lifetime.
Therefore, based on our YAML definition above, we have to prepare a number of Kubernetes resources before we can begin to deploy the "blog" pod:
- PersistentVolume and PersistentVolumeClaim - To store the web contents of our Wordpress application, so when the pod is being rescheduled to other worker node, we won't lose the last changes.
- Secrets - To hide the Wordpress database user password inside the YAML file.
- ConfigMap - To map the configuration file to ProxySQL container, so when it's being rescheduled to other node, Kubernetes can automatically remount it again.
MySQL on Docker: How to Containerize Your Database
Discover all you need to understand when considering to run a MySQL service on top of Docker container virtualization
PersistentVolume and PersistentVolumeClaim
A good persistent storage for Kubernetes should be accessible by all Kubernetes nodes in the cluster. For the sake of this blog post, we used NFS as the PersistentVolume (PV) provider because it's easy and supported out-of-the-box. The NFS server is located somewhere outside of our Kubernetes network and we have configured it to allow all Kubernetes nodes with the following line inside /etc/exports:
/nfs 192.168.55.*(rw,sync,no_root_squash,no_all_squash)
Take note that NFS client package must be installed on all Kubernetes nodes. Otherwise, Kubernetes wouldn't be able to mount the NFS correctly. On all nodes:
$ sudo apt-install nfs-common #Ubuntu/Debian
$ yum install nfs-utils #RHEL/CentOS
Also, make sure on the NFS server, the target directory exists:
(nfs-server)$ mkdir /nfs/kubernetes/wordpress
Then, create a file called wordpress-pv-pvc.yml and add the following lines:
apiVersion: v1
kind: PersistentVolume
metadata:
  name: wp-pv
  labels:
    app: blog
spec:
  accessModes:
    - ReadWriteOnce
  capacity:
    storage: 3Gi
  mountOptions:
    - hard
    - nfsvers=4.1
  nfs:
    path: /nfs/kubernetes/wordpress
    server: 192.168.55.200
---
kind: PersistentVolumeClaim
apiVersion: v1
metadata:
  name: wp-pvc
spec:
  accessModes:
    - ReadWriteOnce
  resources:
    requests:
      storage: 3Gi
  selector:
    matchLabels:
      app: blog
      tier: frontend
In the above definition, we would like Kubernetes to allocate 3GB of volume space on the NFS server for our Wordpress container. Take note for production usage, NFS should be configured with automatic provisioner and storage class.
Create the PV and PVC resources:
$ kubectl create -f wordpress-pv-pvc.yml
Verify if those resources are created and the status must be "Bound":
$ kubectl get pv,pvc
NAME                     CAPACITY   ACCESS MODES   RECLAIM POLICY   STATUS   CLAIM            STORAGECLASS   REASON   AGE
persistentvolume/wp-pv   3Gi        RWO            Recycle          Bound    default/wp-pvc                           22h

NAME                           STATUS   VOLUME   CAPACITY   ACCESS MODES   STORAGECLASS   AGE
persistentvolumeclaim/wp-pvc   Bound    wp-pv    3Gi        RWO                           22h
Secrets
The first one is to create a secret to be used by the Wordpress container for WORDPRESS_DB_PASSWORD environment variable. The reason is simply because we don't want to expose the password in clear text inside the YAML file.
Create a secret resource called mysql-pass and pass the password accordingly:
$ kubectl create secret generic mysql-pass --from-literal=password=passw0rd
Verify that our secret is created:
$ kubectl get secrets mysql-pass
NAME         TYPE     DATA   AGE
mysql-pass   Opaque   1      7h12m
ConfigMap
We also need to create a ConfigMap resource for our ProxySQL container. A Kubernetes ConfigMap file holds key-value pairs of configuration data that can be consumed in pods or used to store configuration data. ConfigMaps allow you to decouple configuration artifacts from image content to keep containerized applications portable.
Since our database server is already running on bare-metal servers with a static hostname and IP address plus static monitoring username and password, in this use case the ConfigMap file will store pre-configured configuration information about the ProxySQL service that we want to use.
First create a text file called proxysql.cnf and add the following lines:
datadir="/var/lib/proxysql"
admin_variables=
{
admin_credentials="admin:adminpassw0rd"
mysql_ifaces="0.0.0.0:6032"
refresh_interval=2000
}
mysql_variables=
{
threads=4
max_connections=2048
default_query_delay=0
default_query_timeout=36000000
have_compress=true
poll_timeout=2000
interfaces="0.0.0.0:6033;/tmp/proxysql.sock"
default_schema="information_schema"
stacksize=1048576
server_version="5.1.30"
connect_timeout_server=10000
monitor_history=60000
monitor_connect_interval=200000
monitor_ping_interval=200000
ping_interval_server_msec=10000
ping_timeout_server=200
commands_stats=true
sessions_sort=true
monitor_username="proxysql"
monitor_password="proxysqlpassw0rd"
}
mysql_servers =
(
{ address="192.168.55.171" , port=3306 , hostgroup=10, max_connections=100 },
{ address="192.168.55.172" , port=3306 , hostgroup=10, max_connections=100 },
{ address="192.168.55.171" , port=3306 , hostgroup=20, max_connections=100 },
{ address="192.168.55.172" , port=3306 , hostgroup=20, max_connections=100 }
)
mysql_users =
(
{ username = "wordpress" , password = "passw0rd" , default_hostgroup = 10 , active = 1 }
)
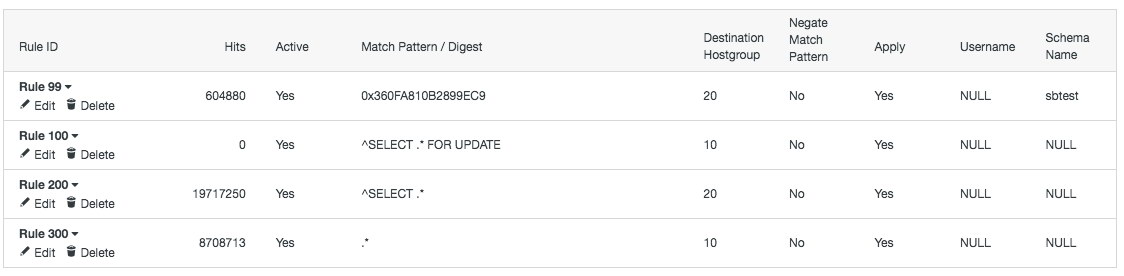
mysql_query_rules =
(
{
rule_id=100
active=1
match_pattern="^SELECT .* FOR UPDATE"
destination_hostgroup=10
apply=1
},
{
rule_id=200
active=1
match_pattern="^SELECT .*"
destination_hostgroup=20
apply=1
},
{
rule_id=300
active=1
match_pattern=".*"
destination_hostgroup=10
apply=1
}
)
mysql_replication_hostgroups =
(
{ writer_hostgroup=10, reader_hostgroup=20, comment="MySQL Replication 5.7" }
)
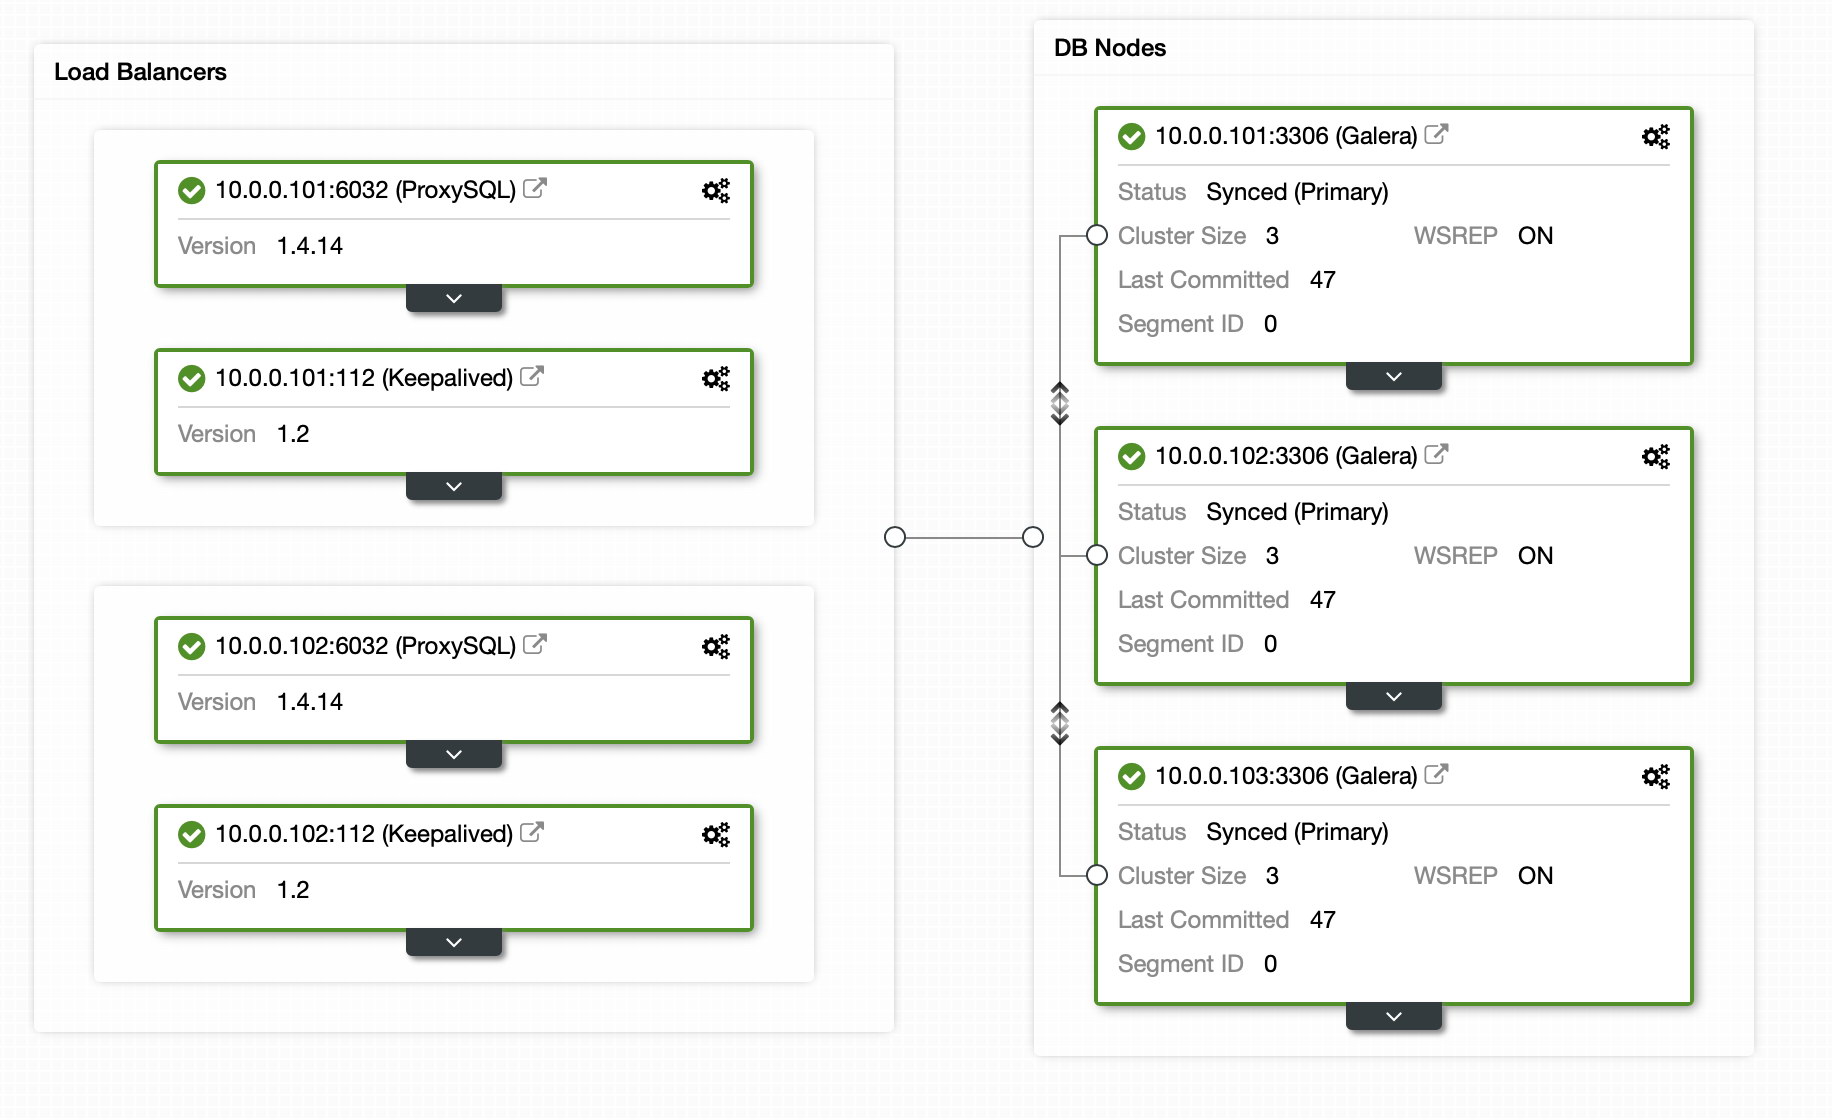
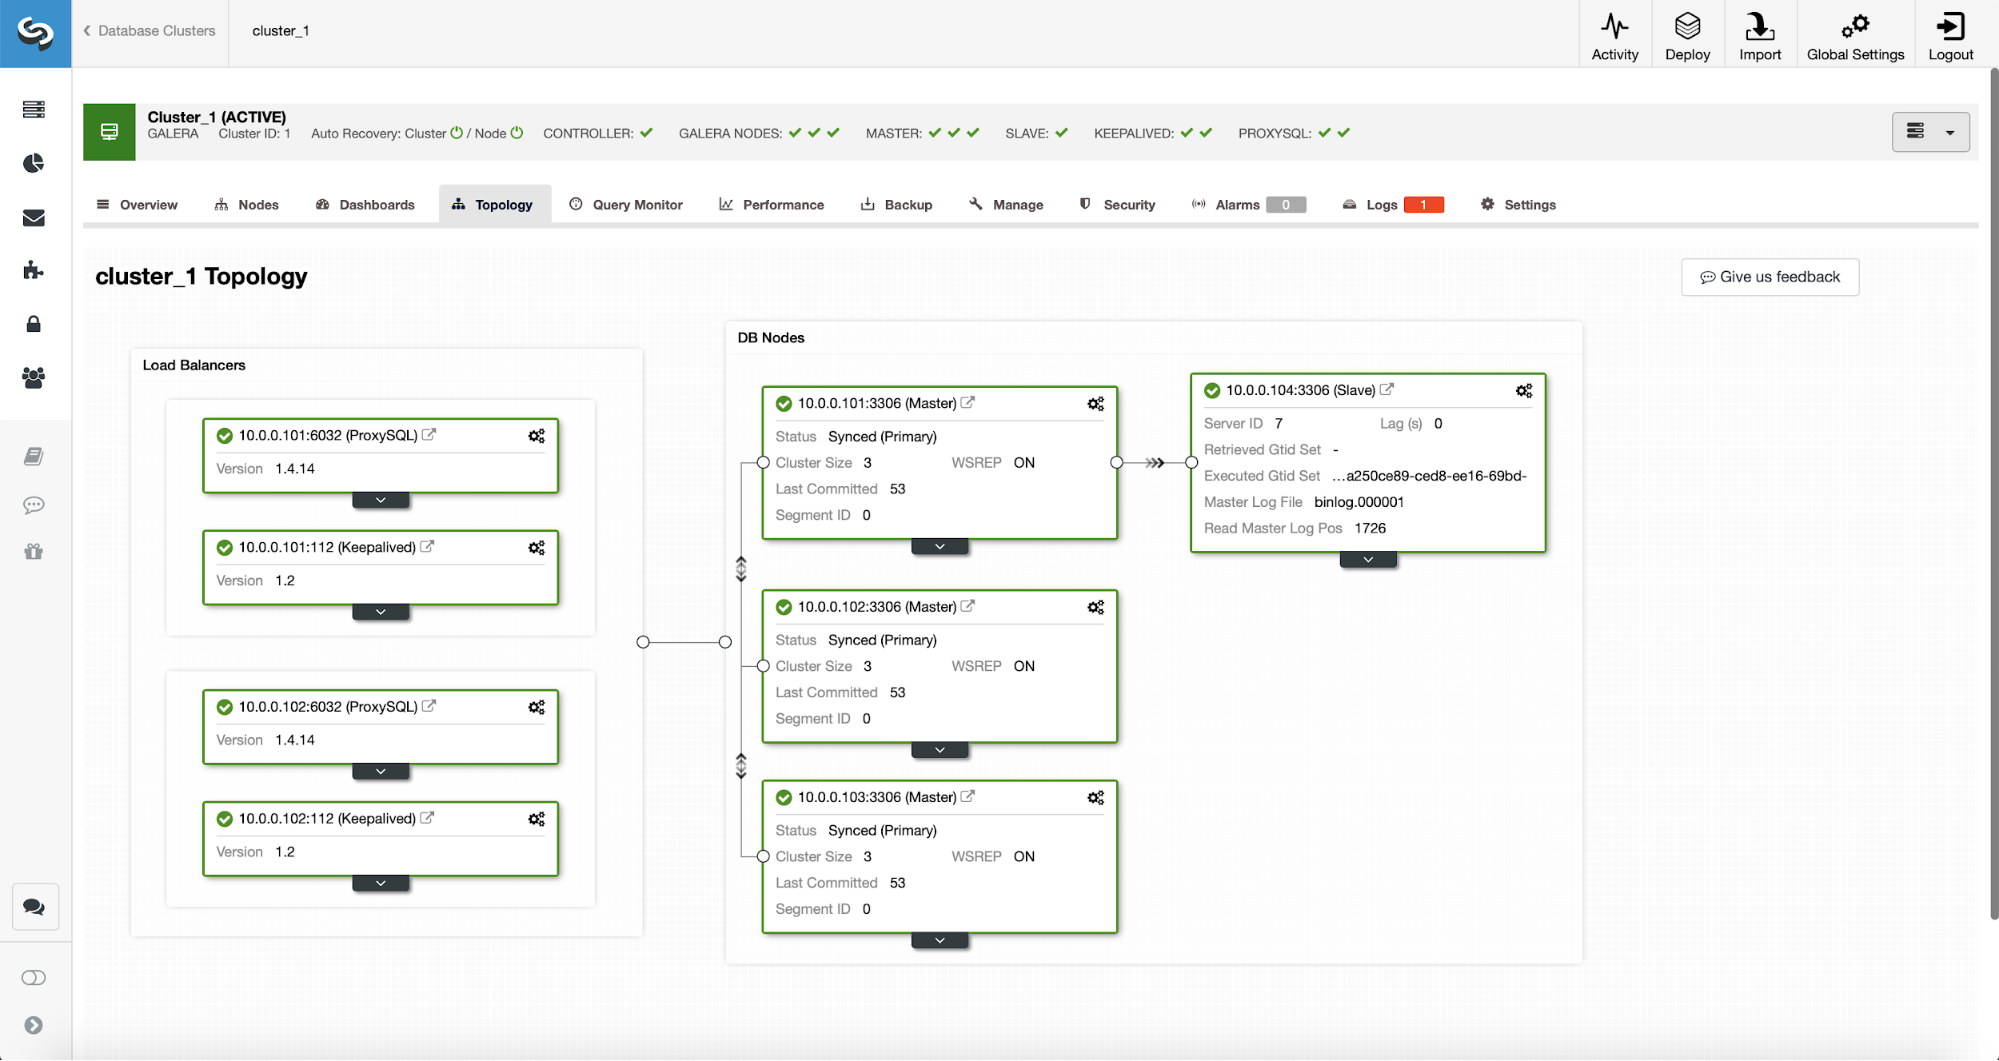
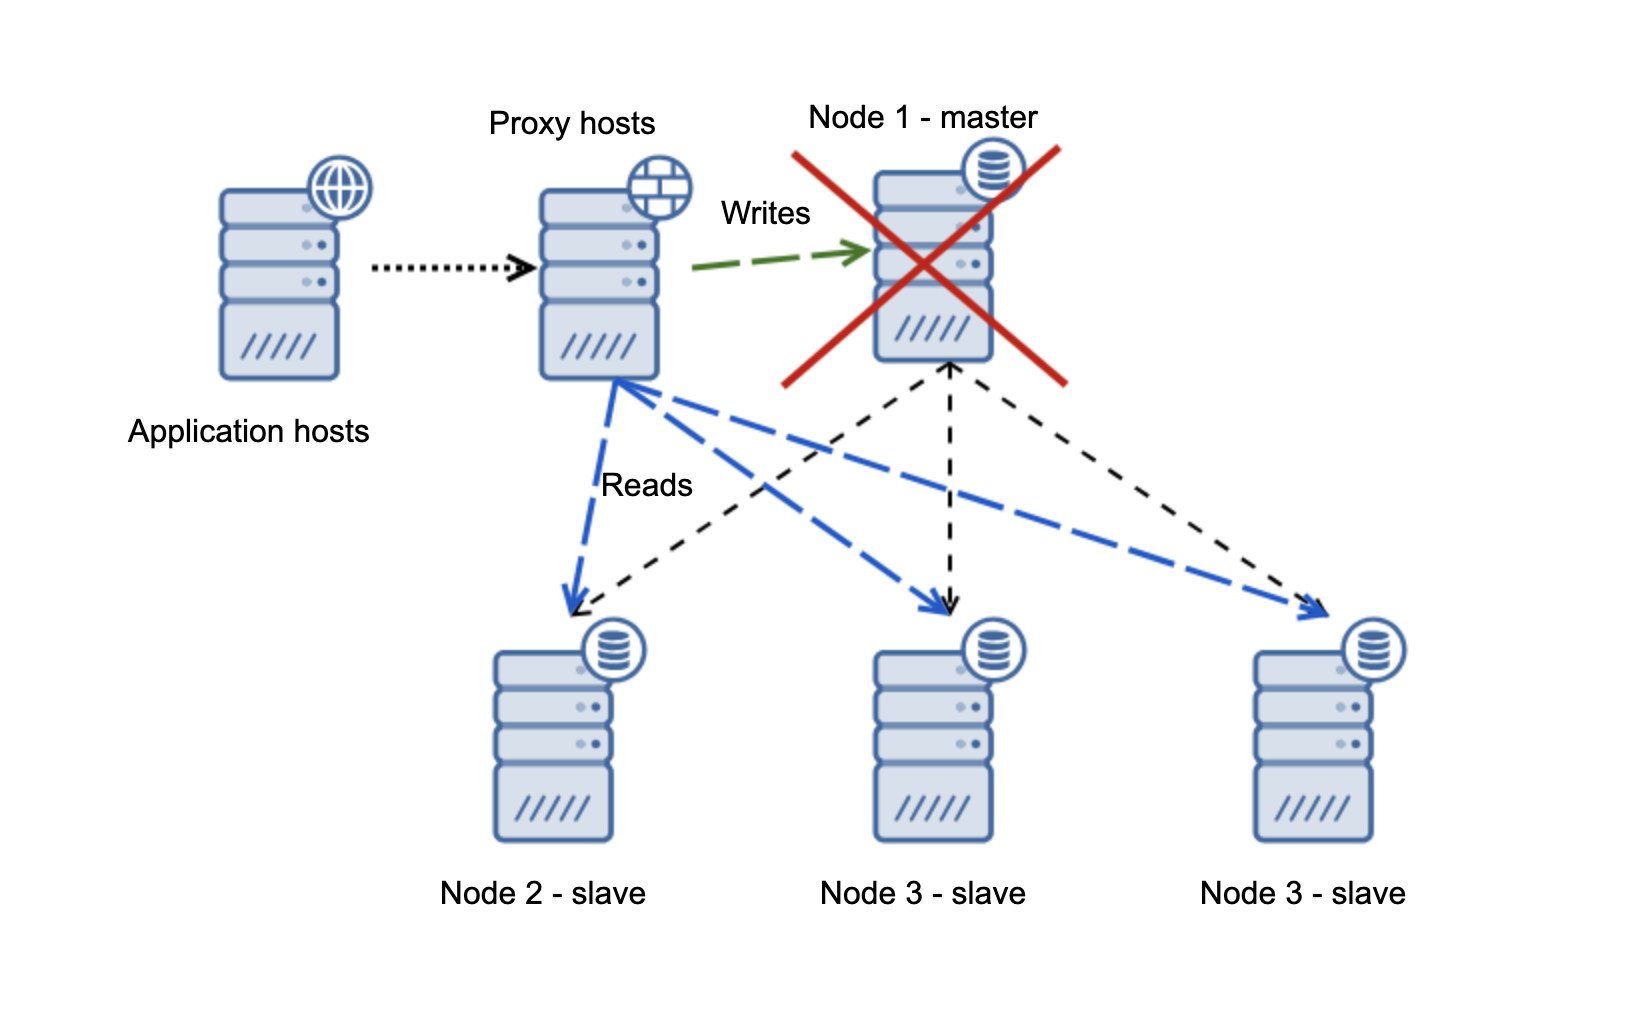
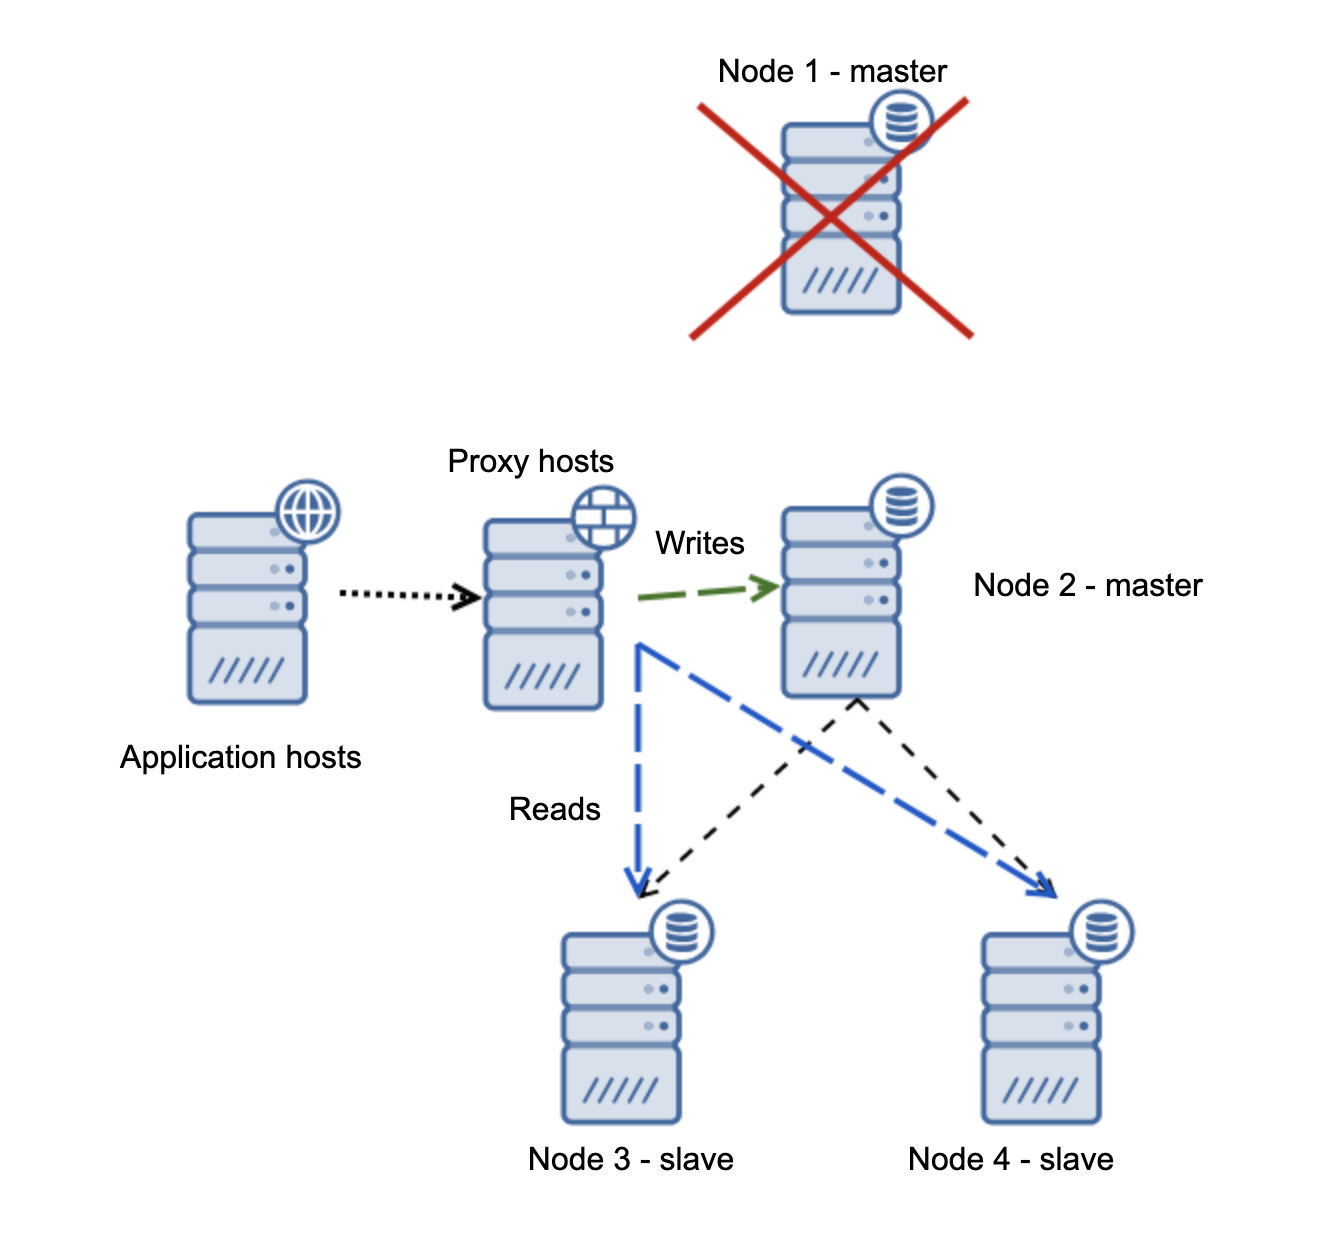
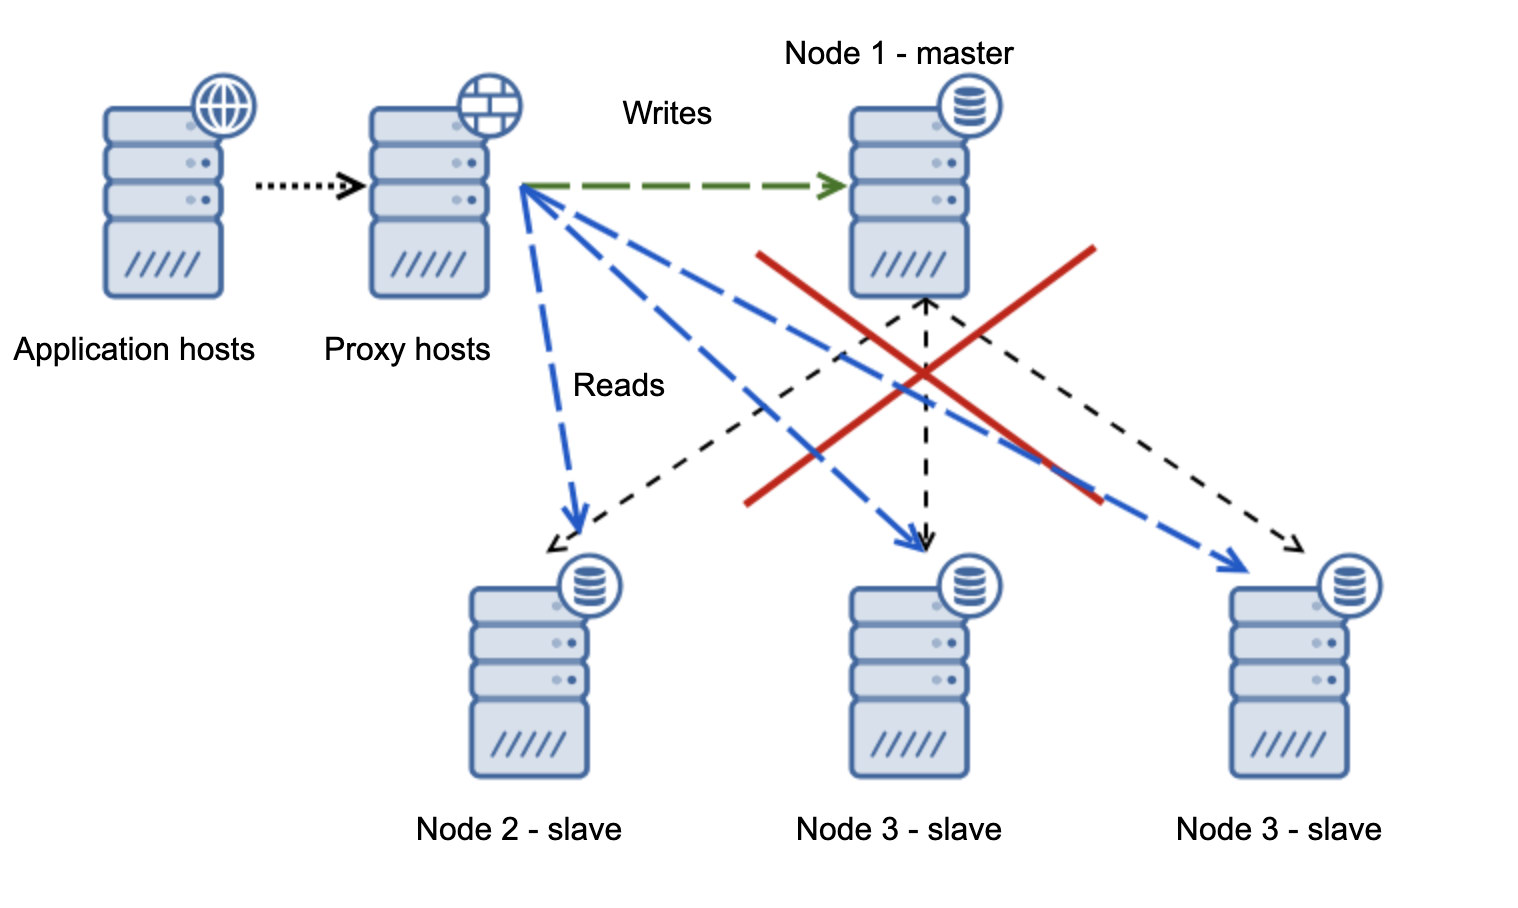
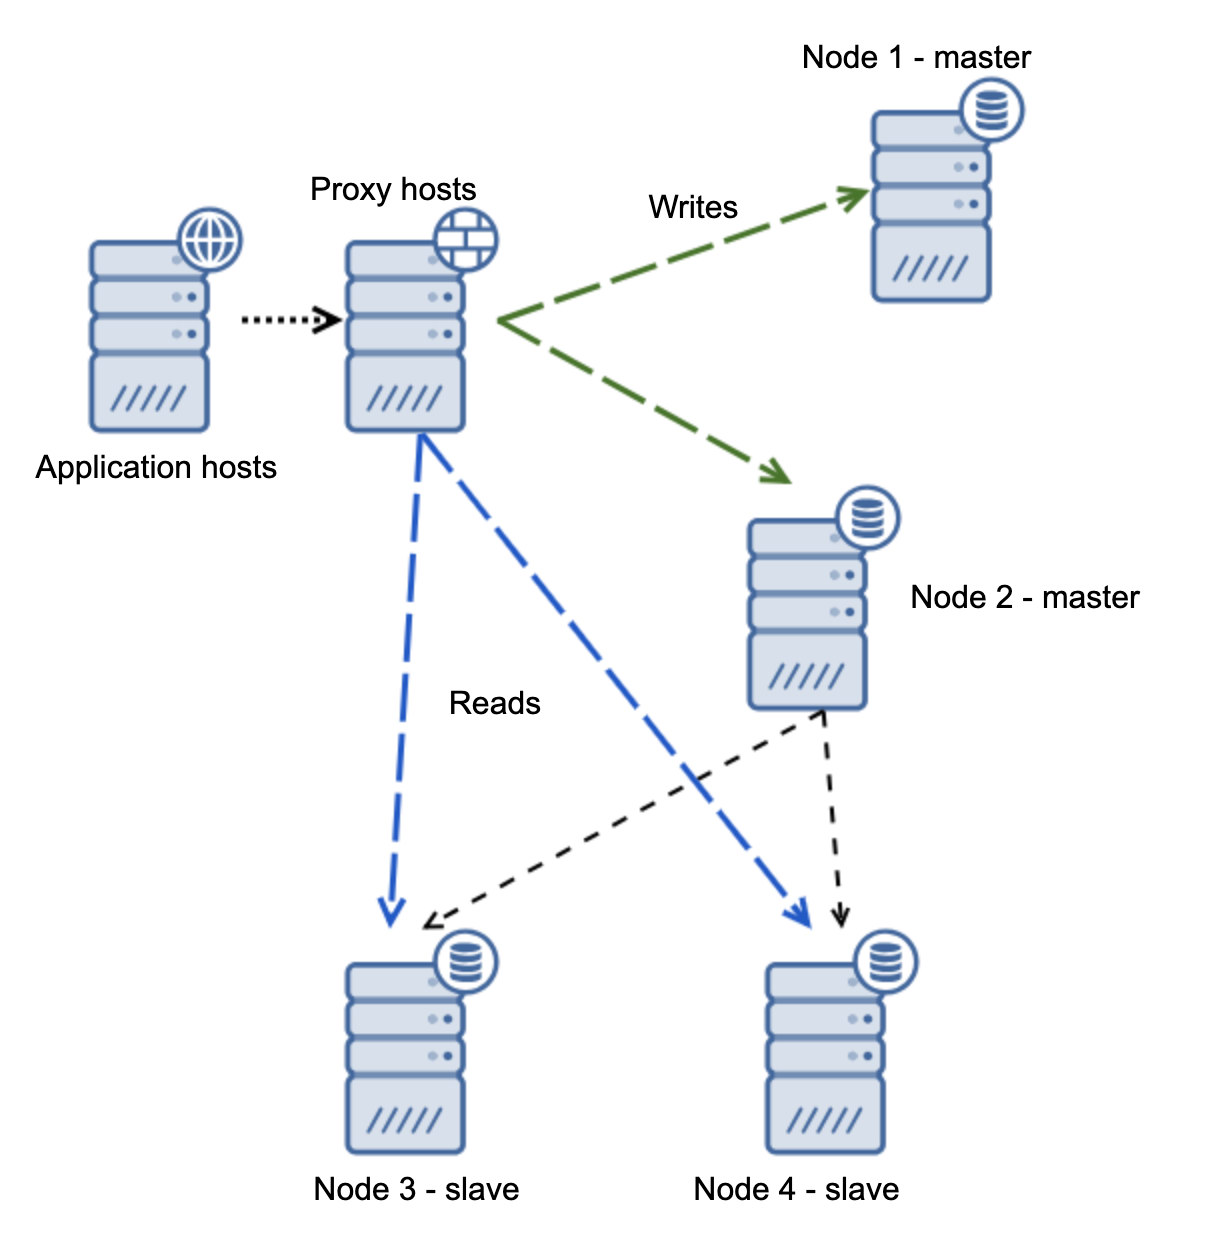
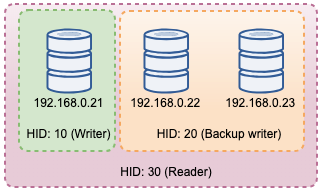
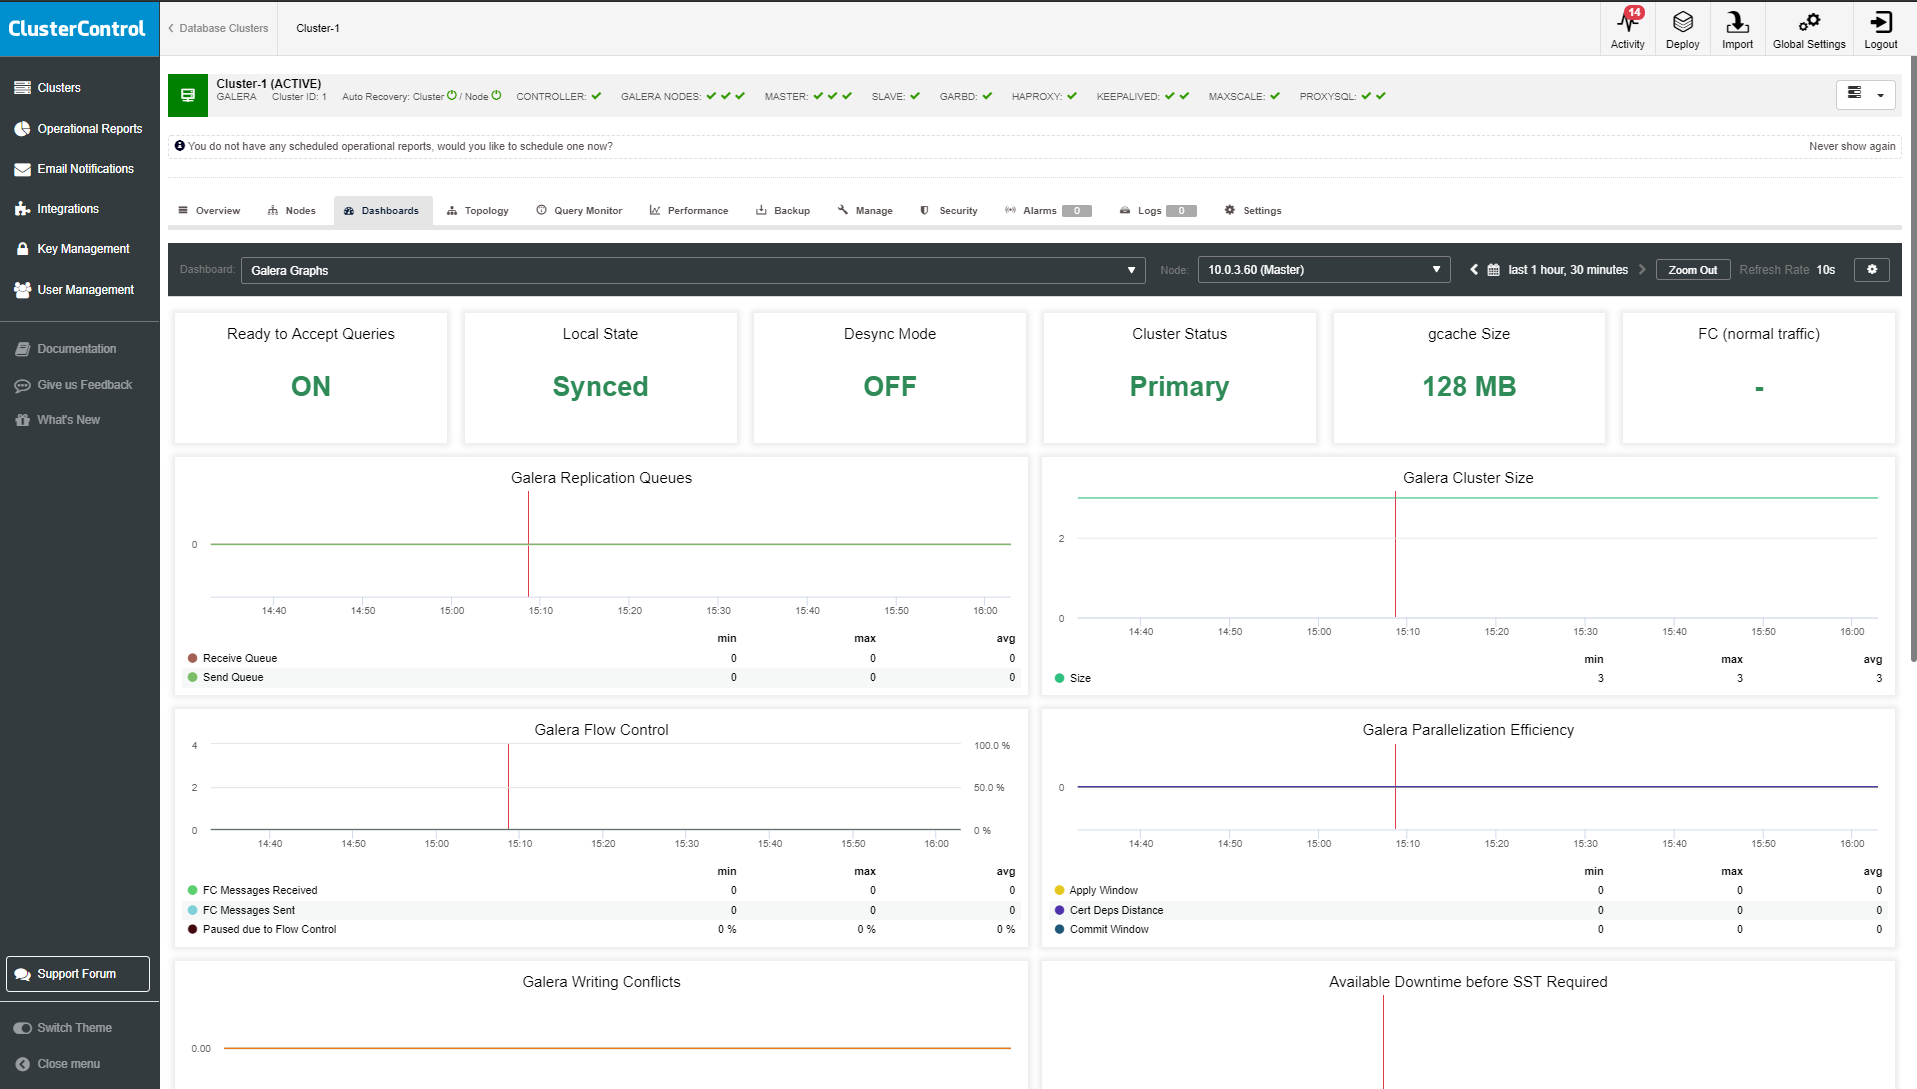
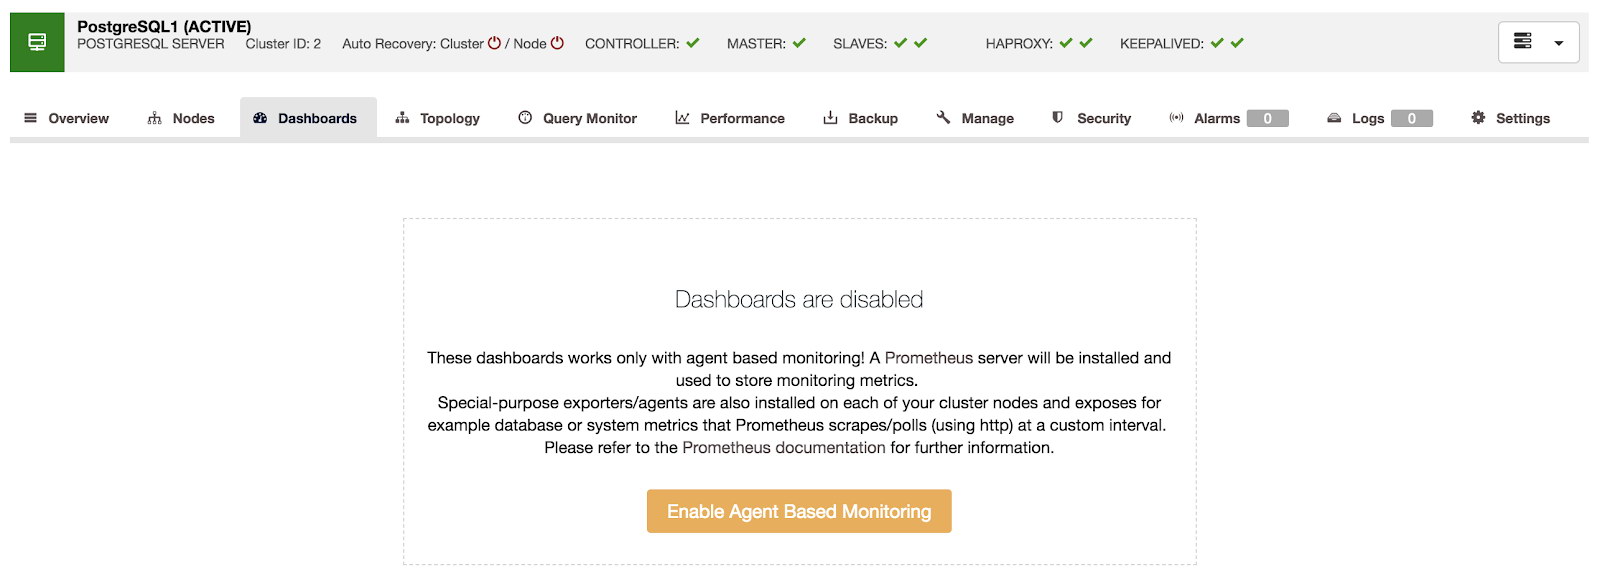
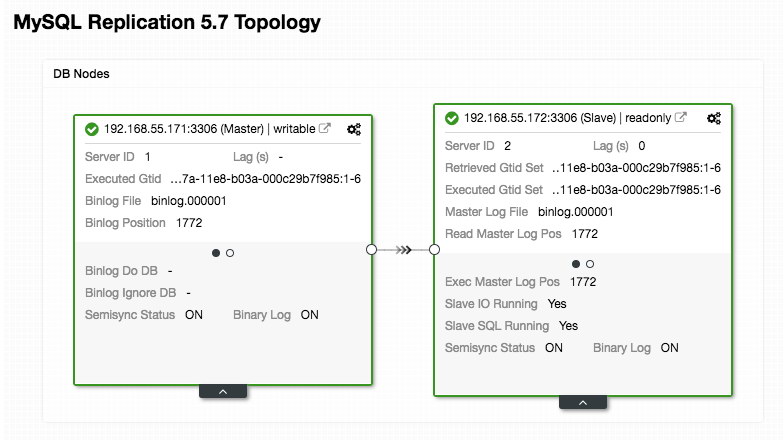
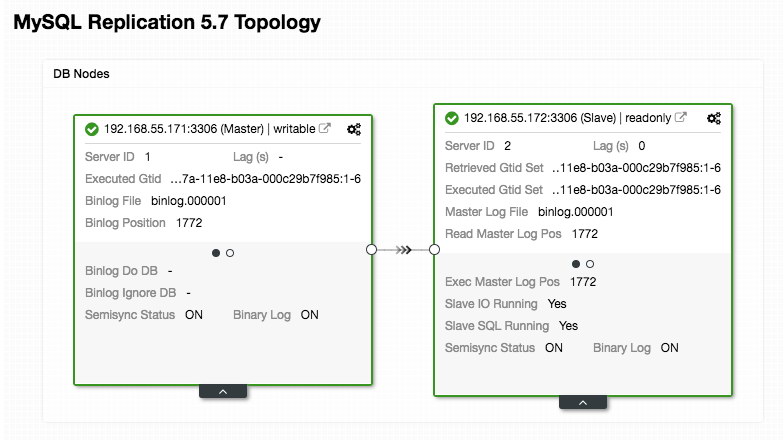
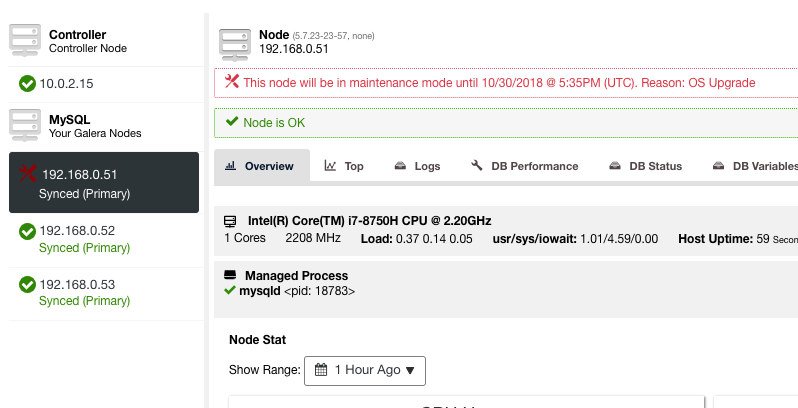
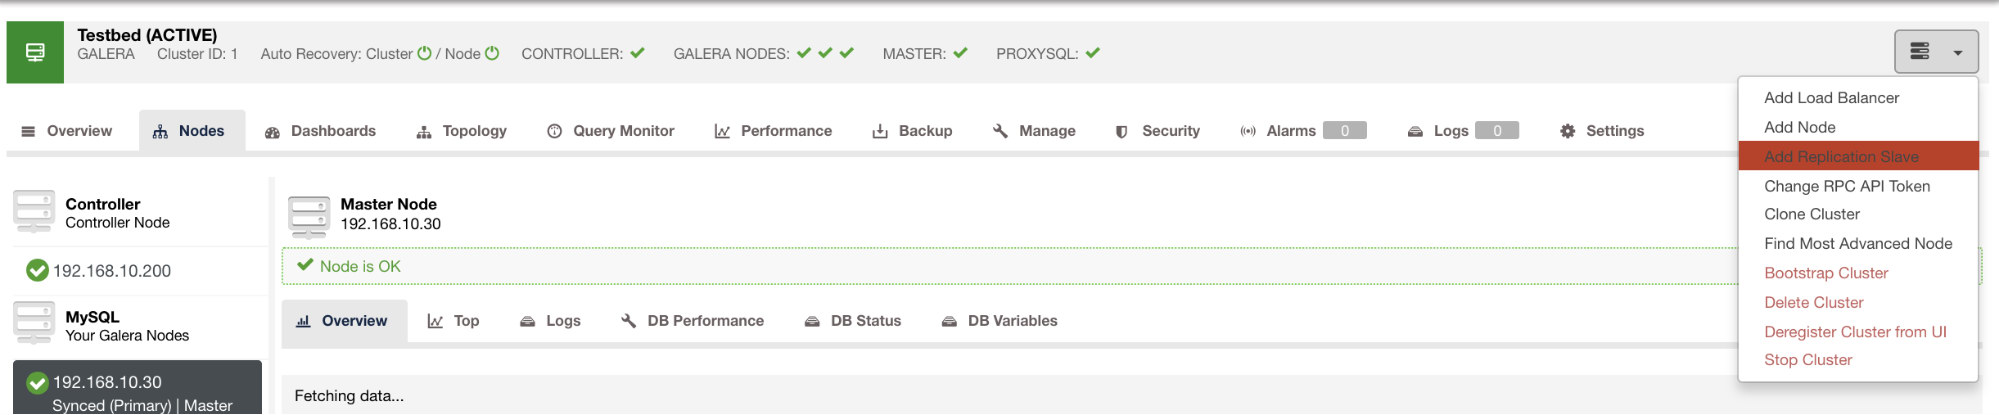
Pay extra attention to the "mysql_servers" and "mysql_users" sections, where you might need to modify the values to suit your database cluster setup. In this case, we have two database servers running in MySQL Replication as summarized in the following Topology screenshot taken from ClusterControl:
All writes should go to the master node while reads are forwarded to hostgroup 20, as defined under "mysql_query_rules" section. That's the basic of read/write splitting and we want to utilize them altogether.
Then, import the configuration file into ConfigMap:
$ kubectl create configmap proxysql-configmap --from-file=proxysql.cnf
configmap/proxysql-configmap created
Verify if the ConfigMap is loaded into Kubernetes:
$ kubectl get configmap
NAME                 DATA   AGE
proxysql-configmap   1      45s
Deploying the Pod
Now we should be good to deploy the blog pod. Send the deployment job to Kubernetes:
$ kubectl create -f blog-deployment.yml
Verify the pod status:
$ kubectl get pods
NAME                           READY   STATUS              RESTARTS   AGE
blog-54755cbcb5-t4cb7          2/2     Running             0          100s
It must show 2/2 under the READY column, indicating there are two containers running inside the pod. Use the -c option flag to check the Wordpress and ProxySQL containers inside the blog pod:
$ kubectl logs blog-54755cbcb5-t4cb7 -c wordpress
$ kubectl logs blog-54755cbcb5-t4cb7 -c proxysql
From the ProxySQL container log, you should see the following lines:
2018-10-20 08:57:14 [INFO] Dumping current MySQL Servers structures for hostgroup ALL
HID: 10 , address: 192.168.55.171 , port: 3306 , weight: 1 , status: ONLINE , max_connections: 100 , max_replication_lag: 0 , use_ssl: 0 , max_latency_ms: 0 , comment:
HID: 10 , address: 192.168.55.172 , port: 3306 , weight: 1 , status: OFFLINE_HARD , max_connections: 100 , max_replication_lag: 0 , use_ssl: 0 , max_latency_ms: 0 , comment:
HID: 20 , address: 192.168.55.171 , port: 3306 , weight: 1 , status: ONLINE , max_connections: 100 , max_replication_lag: 0 , use_ssl: 0 , max_latency_ms: 0 , comment:
HID: 20 , address: 192.168.55.172 , port: 3306 , weight: 1 , status: ONLINE , max_connections: 100 , max_replication_lag: 0 , use_ssl: 0 , max_latency_ms: 0 , comment:
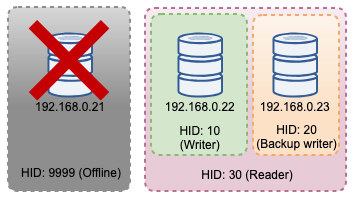
HID 10 (writer hostgroup) must have only one ONLINE node (indicating a single master) and the other host must be in at least in OFFLINE_HARD status. For HID 20, it's expected to be ONLINE for all nodes (indicating multiple read replicas).
To get a summary of the deployment, use the describe flag:
$ kubectl describe deployments blog
Our blog is now running, however we can't access it from outside of the Kubernetes network without configuring the service, as explained in the next section.
Creating the Blog Service
The last step is to create attach a service to our pod. This to ensure that our Wordpress blog pod is accessible from the outside world. Create a file called blog-svc.yml and paste the following line:
apiVersion: v1
kind: Service
metadata:
  name: blog
  labels:
    app: blog
    tier: frontend
spec:
  type: NodePort
  ports:
  - name: blog
    nodePort: 30080
    port: 80
  selector:
    app: blog
    tier: frontend
Create the service:
$ kubectl create -f blog-svc.yml
Verify if the service is created correctly:
root@kube1:~/proxysql-blog# kubectl get svc
NAME         TYPE        CLUSTER-IP     EXTERNAL-IP   PORT(S)        AGE
blog         NodePort    10.96.140.37   <none>        80:30080/TCP   26s
kubernetes   ClusterIP   10.96.0.1      <none>        443/TCP        43h
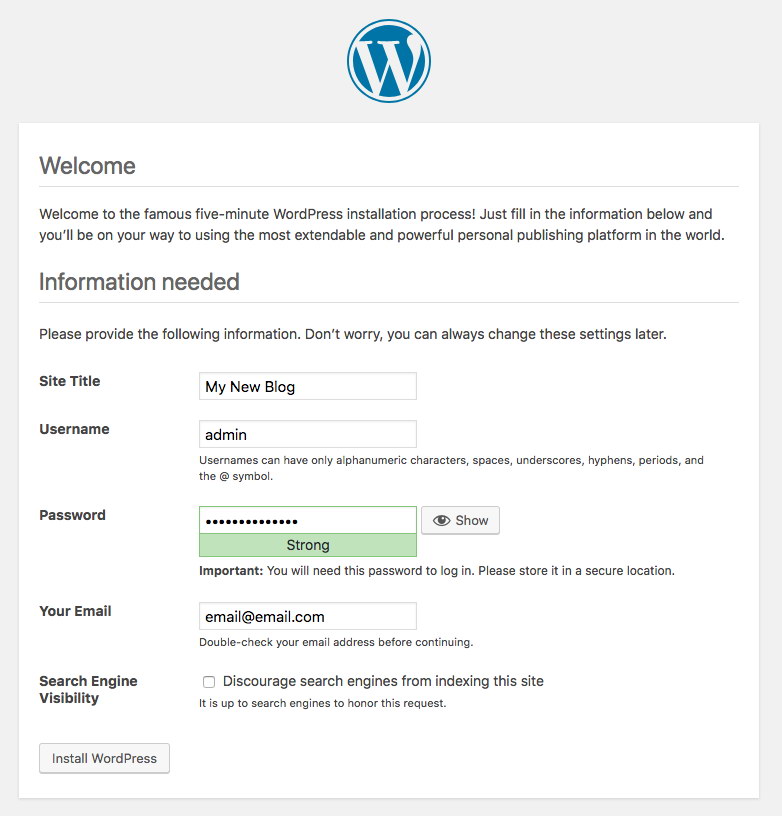
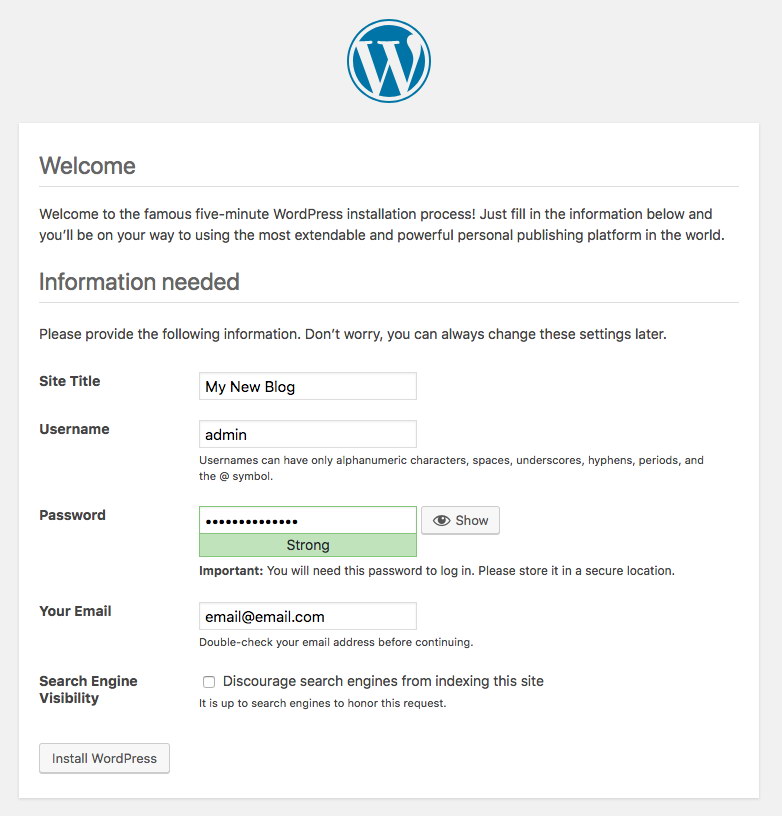
Port 80 published by the blog pod is now mapped to the outside world via port 30080. We can access our blog post at http://{any_kubernetes_host}:30080/ and should be redirected to the Wordpress installation page. If we proceed with the installation, it would skip the database connection part and directly show this page:
It indicates that our MySQL and ProxySQL configuration is correctly configured inside wp-config.php file. Otherwise, you would be redirected to the database configuration page.
Our deployment is now complete.
Managing ProxySQL Container inside a Pod
Failover and recovery are expected to be handled automatically by Kubernetes. For example, if Kubernetes worker goes down, the pod will be recreated in the next available node after --pod-eviction-timeout (default to 5 minutes). If the container crashes or is killed, Kubernetes will replace it almost instantly.
Some common management tasks are expected to be different when running within Kubernetes, as shown in the next sections.
Scaling Up and Down
In the above configuration, we were deploying one replica in our deployment. To scale up, simply change the spec.replicas value accordingly by using kubectl edit command:
$ kubectl edit deployment blog
It will open up the deployment definition in a default text file and simply change the spec.replicas value to something higher, for example, "replicas: 3". Then, save the file and immediately check the rollout status by using the following command:
$ kubectl rollout status deployment blog
Waiting for deployment "blog" rollout to finish: 1 of 3 updated replicas are available...
Waiting for deployment "blog" rollout to finish: 2 of 3 updated replicas are available...
deployment "blog" successfully rolled out
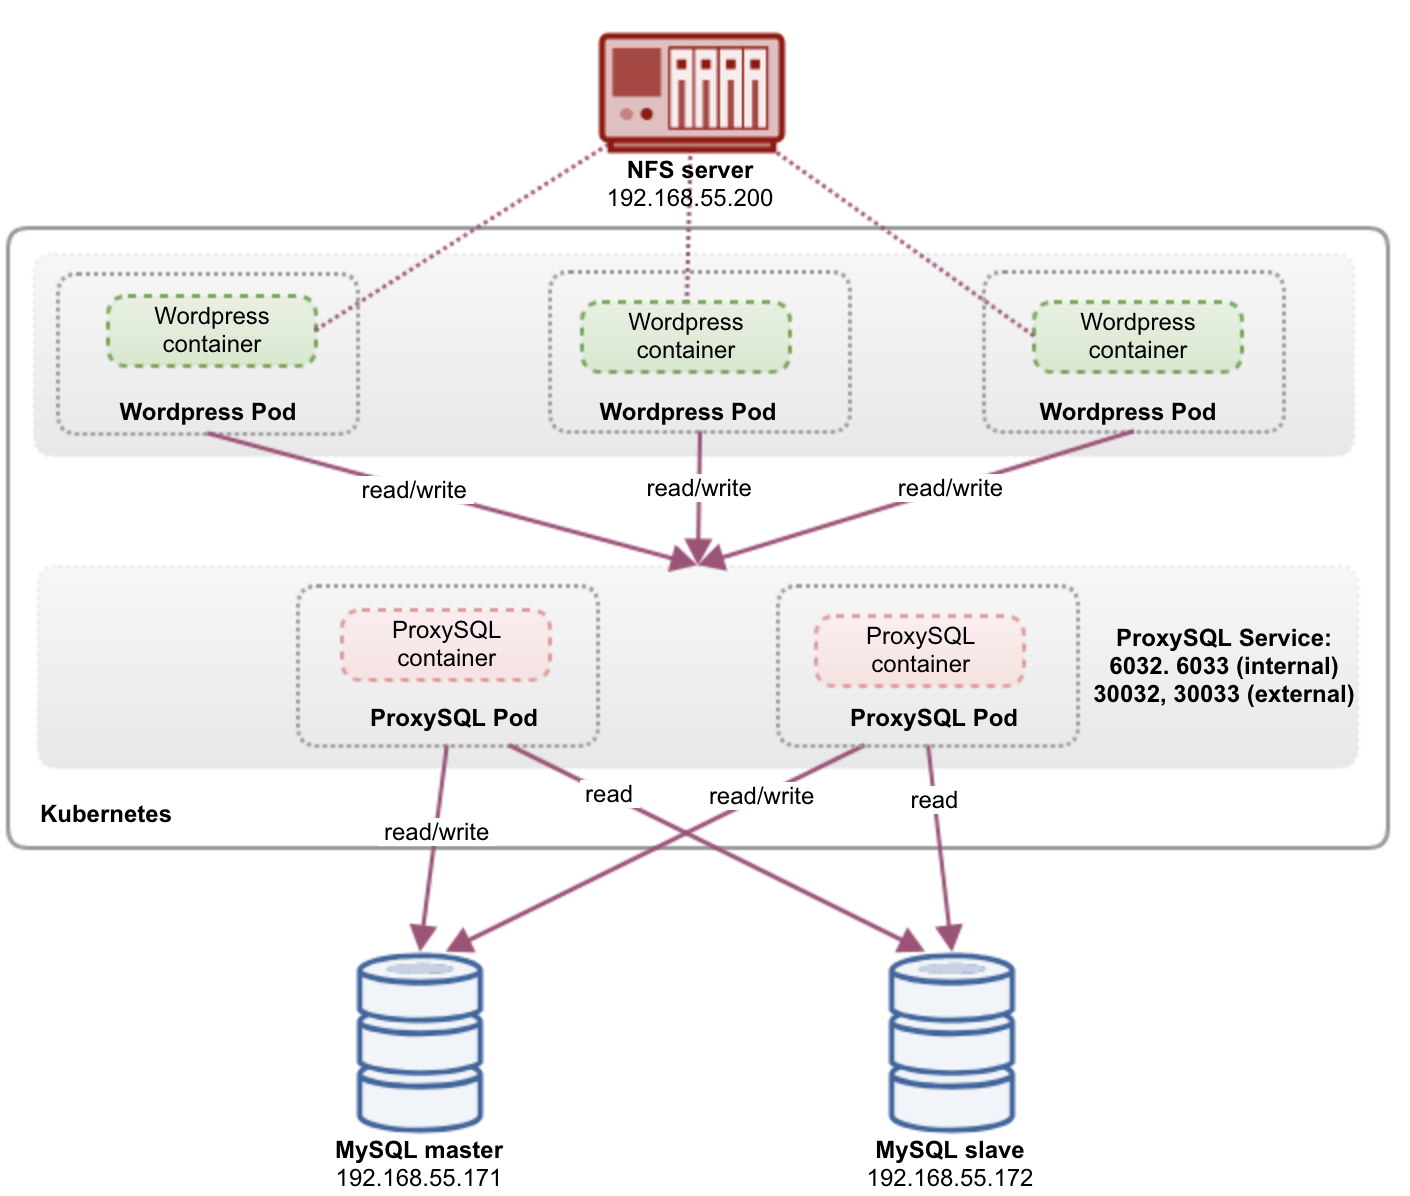
At this point, we have three blog pods (Wordpress + ProxySQL) running simultanouesly in Kubernetes:
$ kubectl get pods
NAME                             READY   STATUS              RESTARTS   AGE
blog-54755cbcb5-6fnqn            2/2     Running             0          11m
blog-54755cbcb5-cwpdj            2/2     Running             0          11m
blog-54755cbcb5-jxtvc            2/2     Running             0          22m
At this point, our architecture is looking something like this:
Take note that it might require more customization than our current configuration to run Wordpress smoothly in a horizontal-scaled production environment (think about static contents, session management and others). Those are actually beyond the scope of this blog post.
Scaling down procedures are similar.
Configuration Management
Configuration management is important in ProxySQL. This is where the magic happens where you can define your own set of query rules to do query caching, firewalling and rewriting. Contrary to the common practice, where ProxySQL would be configured via Admin console and push into persistency by using "SAVE .. TO DISK", we will stick with configuration files only to make things more portable in Kubernetes. That's the reason we are using ConfigMaps.
Since we are relying on our centralized configuration stored by Kubernetes ConfigMaps, there are a number of ways to perform configuration changes. Firstly, by using the kubectl edit command:
$ kubectl edit configmap proxysql-configmap
It will open up the configuration in a default text editor and you can directly make changes to it and save the text file once done. Otherwise, recreate the configmaps should also do:
$ vi proxysql.cnf # edit the configuration first
$ kubectl delete configmap proxysql-configmap
$ kubectl create configmap proxysql-configmap --from-file=proxysql.cnf
After the configuration is pushed into ConfigMap, restart the pod or container as shown in the Service Control section. Configuring the container via ProxySQL admin interface (port 6032) won't make it persistent after pod rescheduling by Kubernetes.
Service Control
Since the two containers inside a pod are tightly coupled, the best way to apply the ProxySQL configuration changes is to force Kubernetes to do pod replacement. Consider we are having three blog pods now after we scaled up:
$ kubectl get pods
NAME                             READY   STATUS              RESTARTS   AGE
blog-54755cbcb5-6fnqn            2/2     Running             0          31m
blog-54755cbcb5-cwpdj            2/2     Running             0          31m
blog-54755cbcb5-jxtvc            2/2     Running             1          22m
Use the following command to replace one pod at a time:
$ kubectl get pod blog-54755cbcb5-6fnqn -n default -o yaml | kubectl replace --force -f -
pod "blog-54755cbcb5-6fnqn" deleted
pod/blog-54755cbcb5-6fnqn
Then, verify with the following:
$ kubectl get pods
NAME                             READY   STATUS              RESTARTS   AGE
blog-54755cbcb5-6fnqn            2/2     Running             0          31m
blog-54755cbcb5-cwpdj            2/2     Running             0          31m
blog-54755cbcb5-qs6jm            2/2     Running             1          2m26s
You will notice the most recent pod has been restarted by looking at the AGE and RESTART column, it came up with a different pod name. Repeat the same steps for the remaining pods. Otherwise, you can also use "docker kill" command to kill the ProxySQL container manually inside the Kubernetes worker node. For example:
(kube-worker)$ docker kill $(docker ps | grep -i proxysql_blog | awk {'print $1'})
Kubernetes will then replace the killed ProxySQL container with a new one.
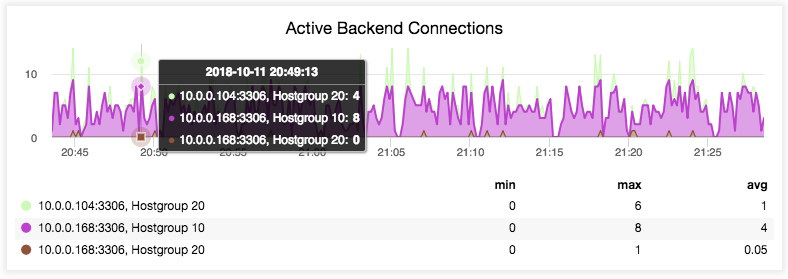
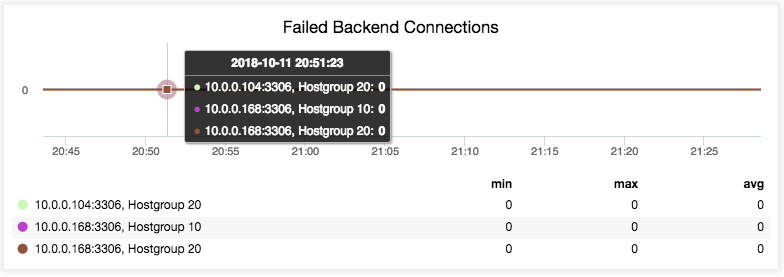
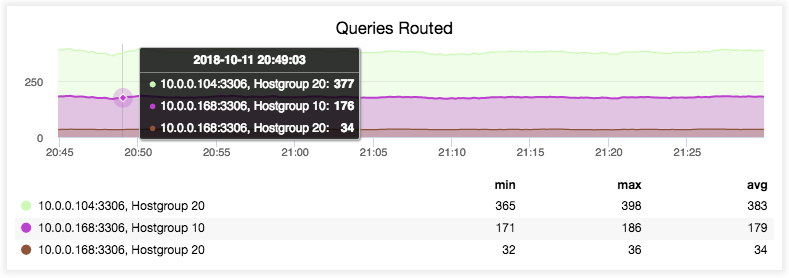
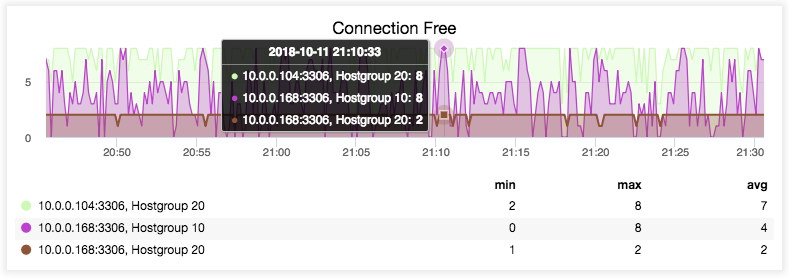
Monitoring
Use kubectl exec command to execute SQL statement via mysql client. For example, to monitor query digestion:
$ kubectl exec -it blog-54755cbcb5-29hqt -c proxysql -- mysql -uadmin -p -h127.0.0.1 -P6032
mysql> SELECT * FROM stats_mysql_query_digest;
Or with a one-liner:
$ kubectl exec -it blog-54755cbcb5-29hqt -c proxysql -- mysql -uadmin -p -h127.0.0.1 -P6032 -e 'SELECT * FROM stats_mysql_query_digest'
By changing the SQL statement, you can monitor other ProxySQL components or perform any administration tasks via this Admin console. Again, it will only persist during the ProxySQL container lifetime and won't get persisted if the pod is rescheduled.
Final Thoughts
ProxySQL holds a key role if you want to scale your application containers and and have an intelligent way to access a distributed database backend. There are a number of ways to deploy ProxySQL on Kubernetes to support our application growth when running at scale. This blog post only covers one of them.
In an upcoming blog post, we are going to look at how to run ProxySQL in a centralized approach by using it as a Kubernetes service.


 .
.
 button will allow you to replace the certificate which is currently being used or deployed by ClusterControl during deployment of your newly provisioned cluster. You can check this blog "