Someone accidently deleted part of the database. Someone forgot to include a WHERE clause in a DELETE query, or they dropped the wrong table. Things like that may and will happen, it is inevitable and human. But the impact can be disastrous. What can you do to guard yourself against such situations, and how can you recover your data? In this blog post, we will cover some of the most typical cases of the data loss, and how you can prepare yourself so you can recover from them.
Preparations
There are things you should do in order to ensure a smooth recovery. Let’s go through them. Please keep in mind that it’s not “pick one” situation - ideally you will implement all of the measures we are going to discuss below.
Backup
You have to have a backup, there is no getting away from it. You should have your backup files tested - unless you test your backups, you cannot be sure if they are any good and if you will ever be able to restore them. For disaster recovery you should keep a copy of your backup somewhere outside of your datacenter - just in case the whole datacenter becomes unavailable. To speed up the recovery, it’s very useful to keep a copy of the backup also on the database nodes. If your dataset is large, copying it over the network from a backup server to the database node which you want to restore may take significant time. Keeping the latest backup locally may significantly improve recovery times.
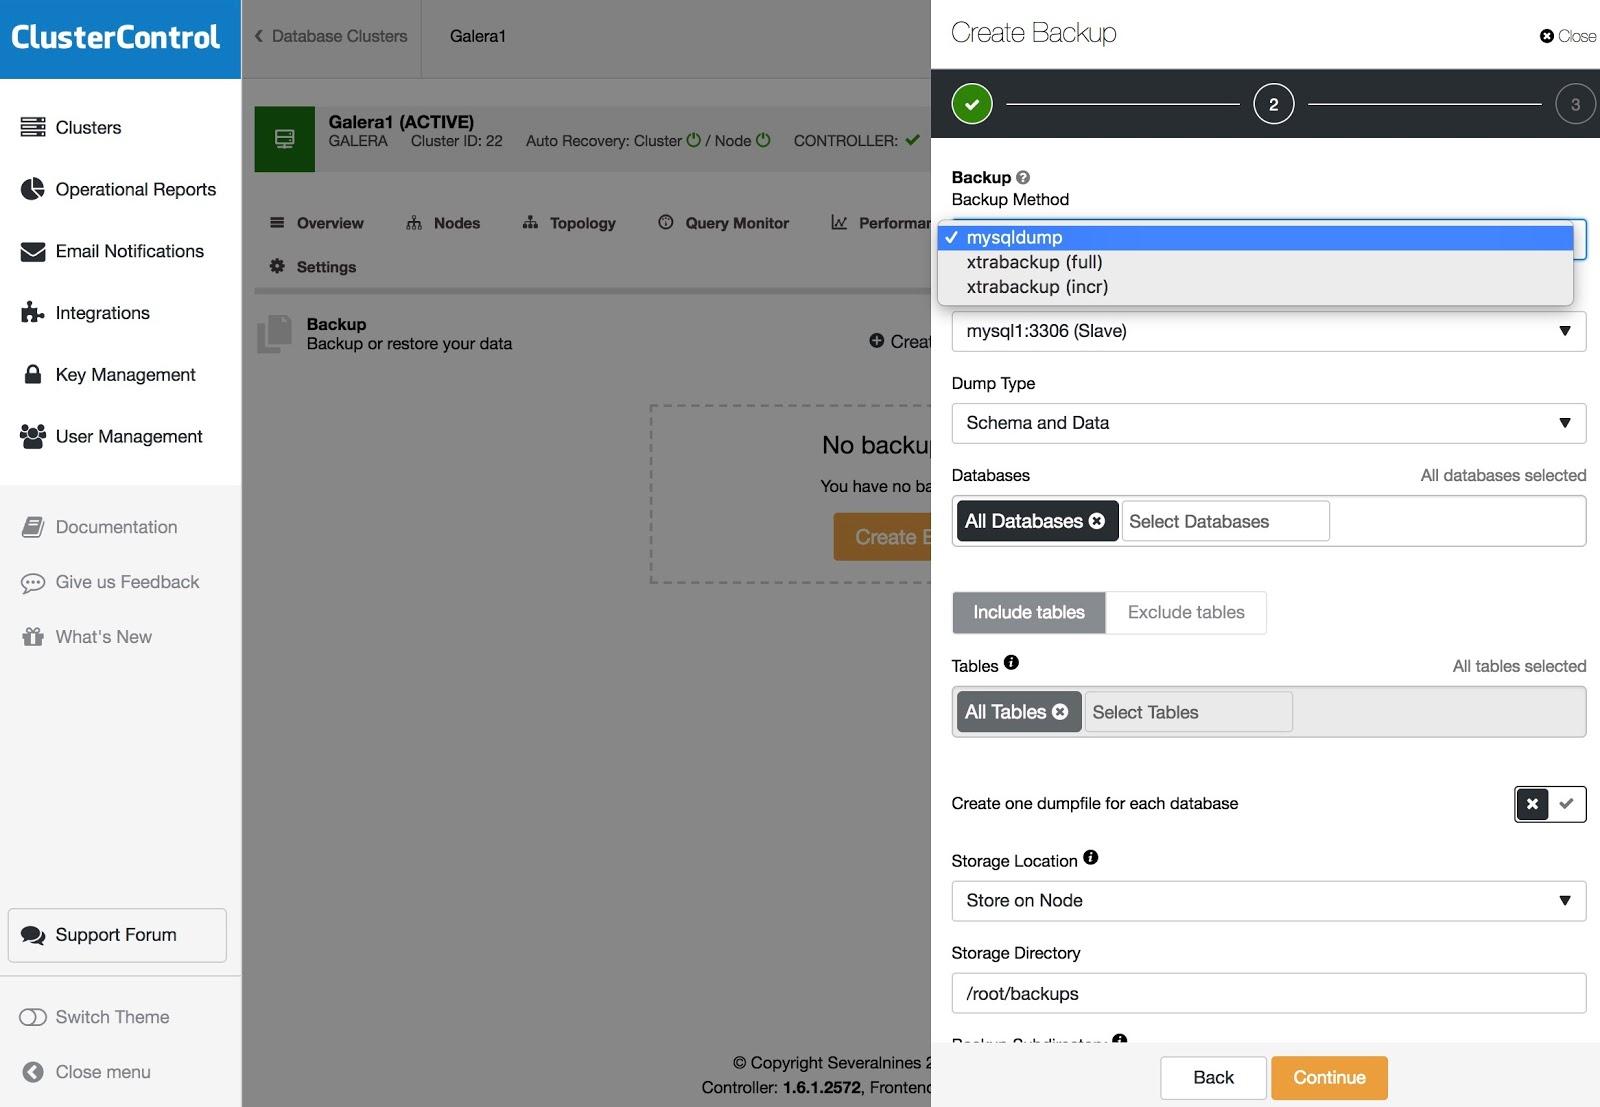
Logical Backup
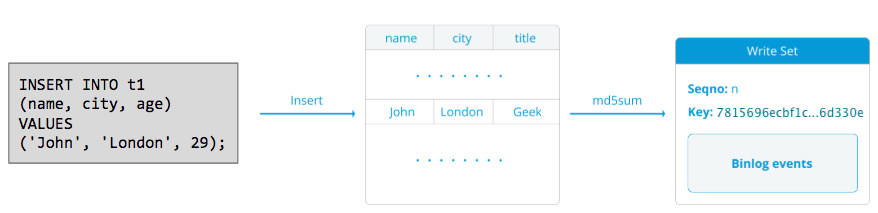
Your first backup, most likely, will be a physical backup. For MySQL or MariaDB, it will be either something like xtrabackup or some sort of filesystem snapshot. Such backups are great for restoring a whole dataset or for provisioning new nodes. However, in case of deletion of a subset of data, they suffer from significant overhead. First of all, you are not able to restore all of the data, or else you will overwrite all changes that happened after the backup was created. What you are looking for is the ability to restore just a subset of data, only the rows which were accidentally removed. To do that with a physical backup, you would have to restore it on a separate host, locate removed rows, dump them and then restore them on the production cluster. Copying and restoring hundreds of gigabytes of data just to recover a handful of rows is something we would definitely call a significant overhead. To avoid it you can use logical backups - instead of storing physical data, such backups store data in a text format. This makes it easier to locate the exact data which was removed, which can then be restored directly on the production cluster. To make it even easier, you can also split such logical backup in parts and backup each and every table to a separate file. If your dataset is large, it will make sense to split one huge text file as much as possible. This will make the backup inconsistent but for the majority of the cases, this is no issue - if you will need to restore the whole dataset to a consistent state, you will use physical backup, which is much faster in this regard. If you need to restore just a subset of data, the requirements for consistency are less stringent.
Point-In-Time Recovery
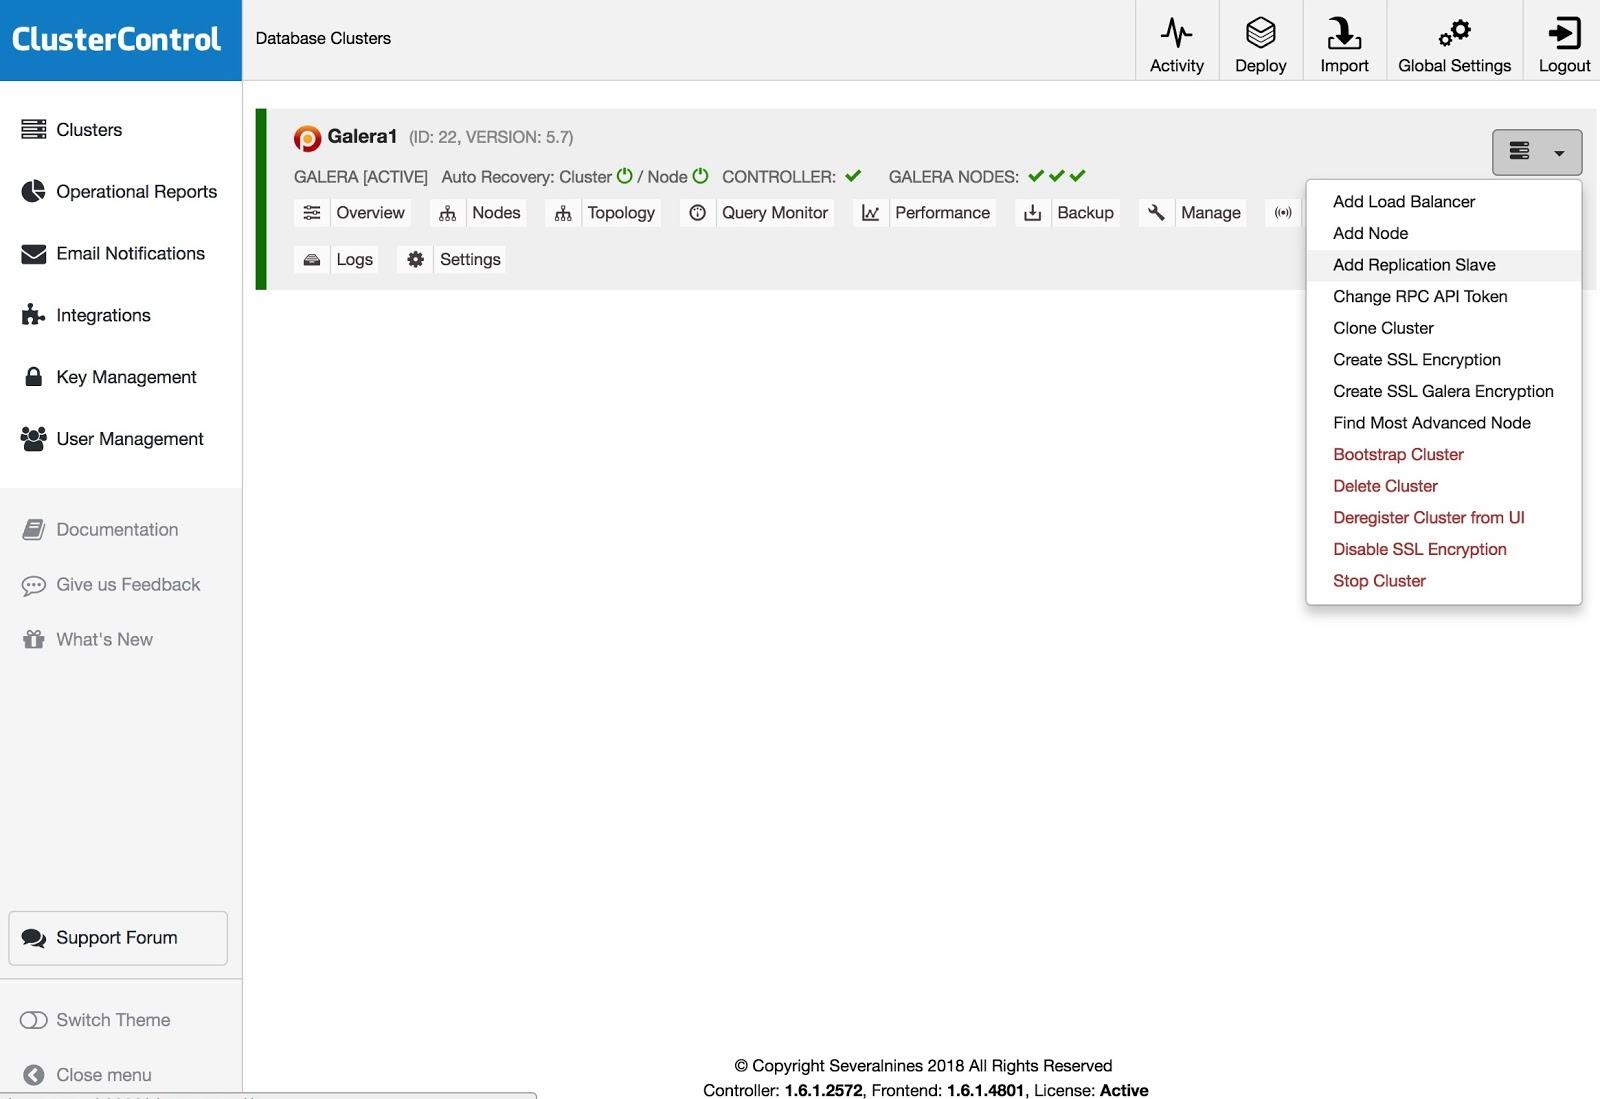
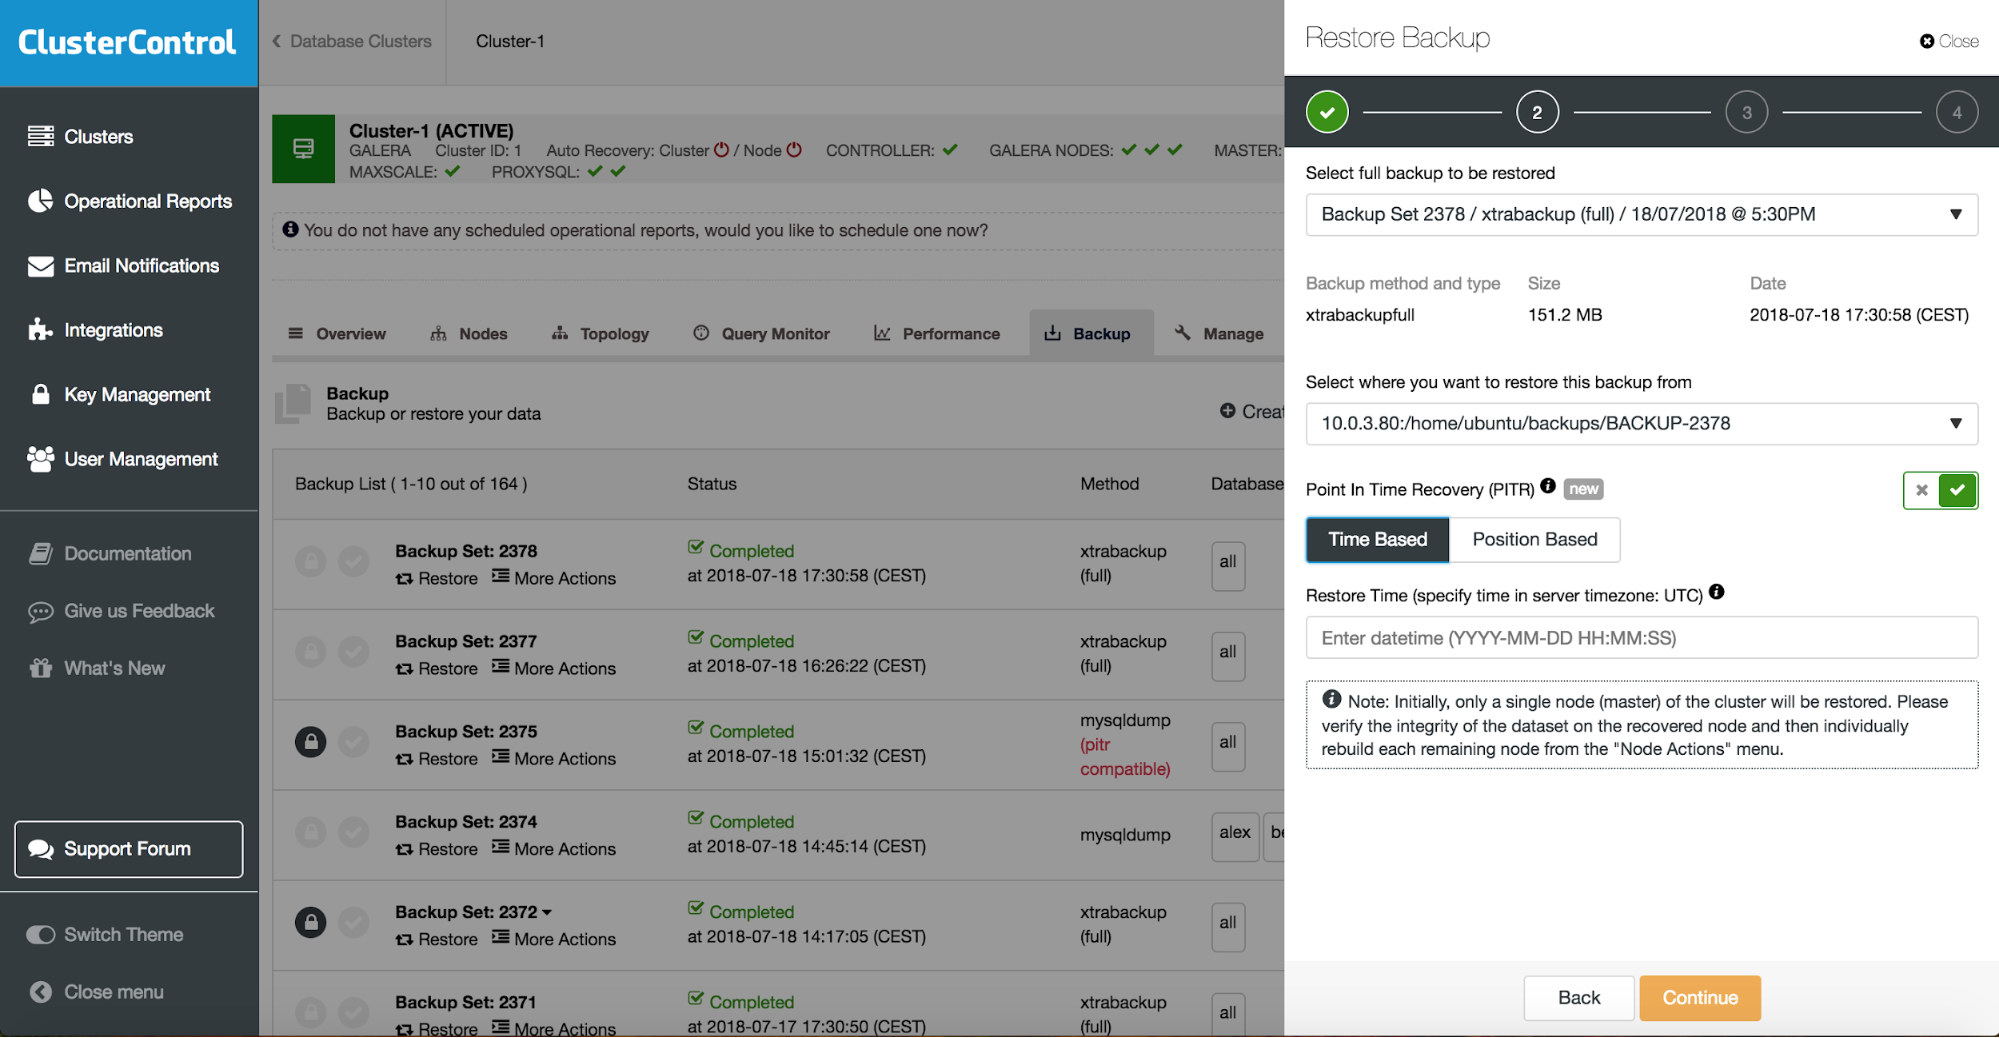
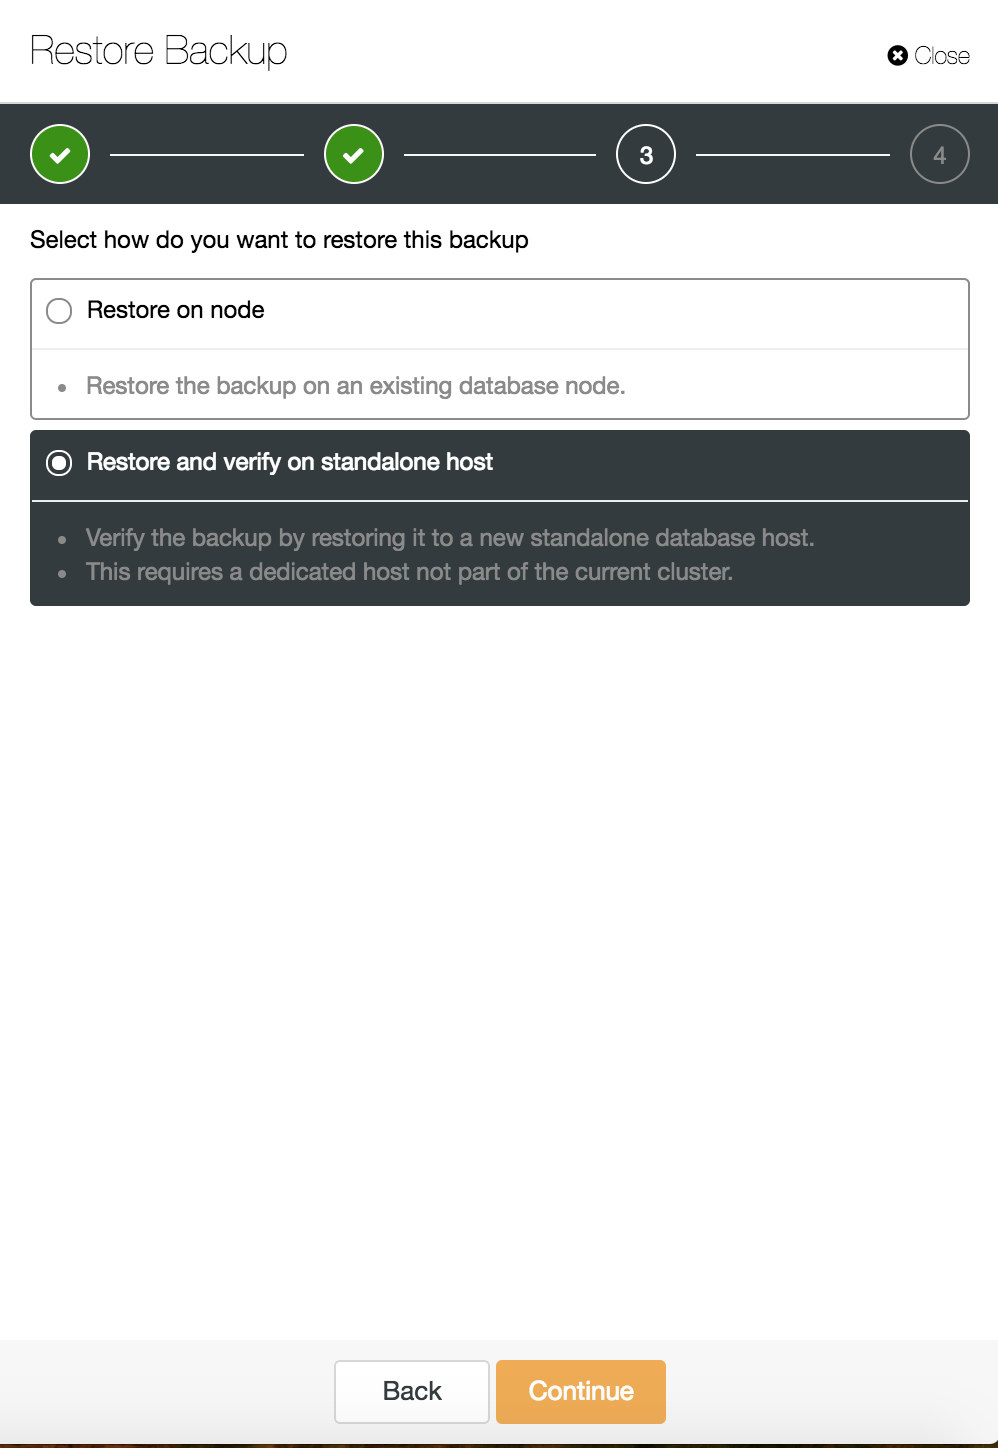
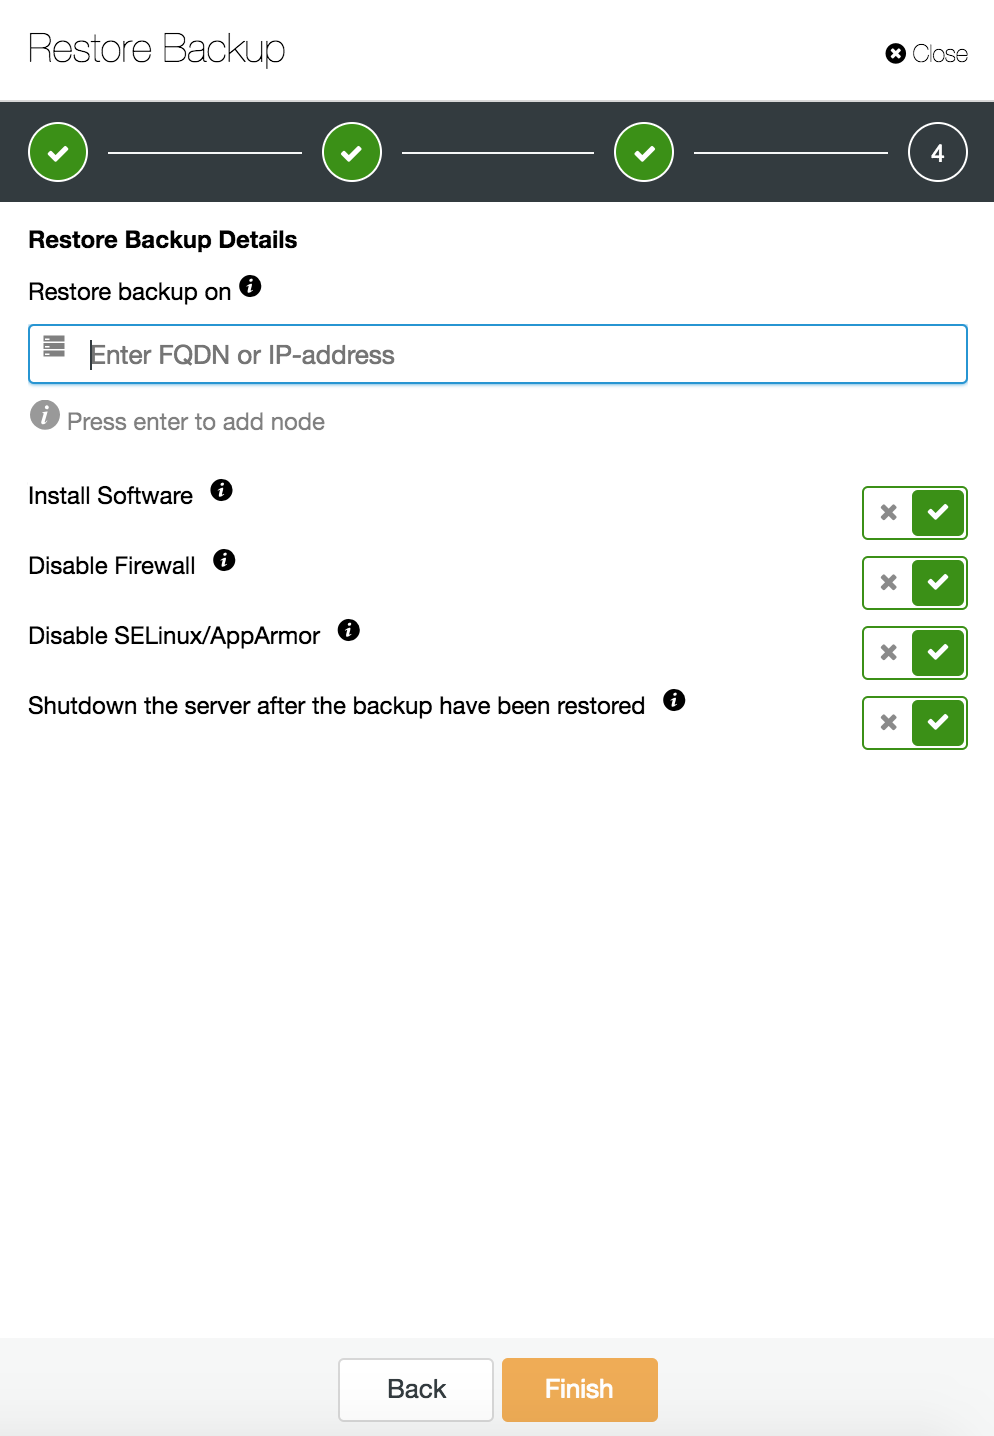
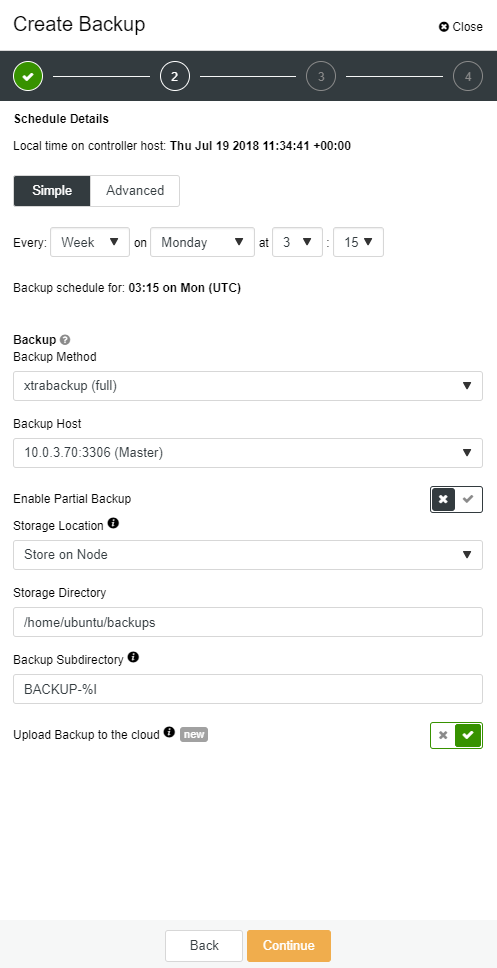
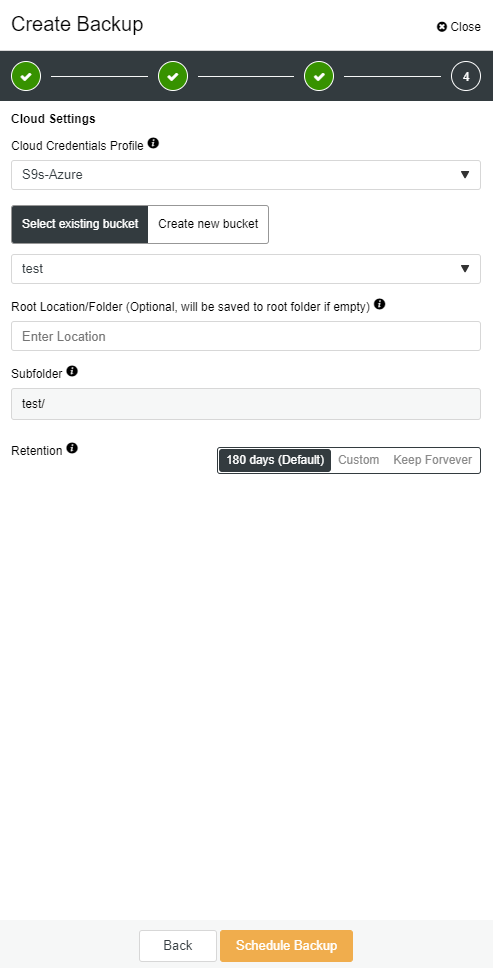
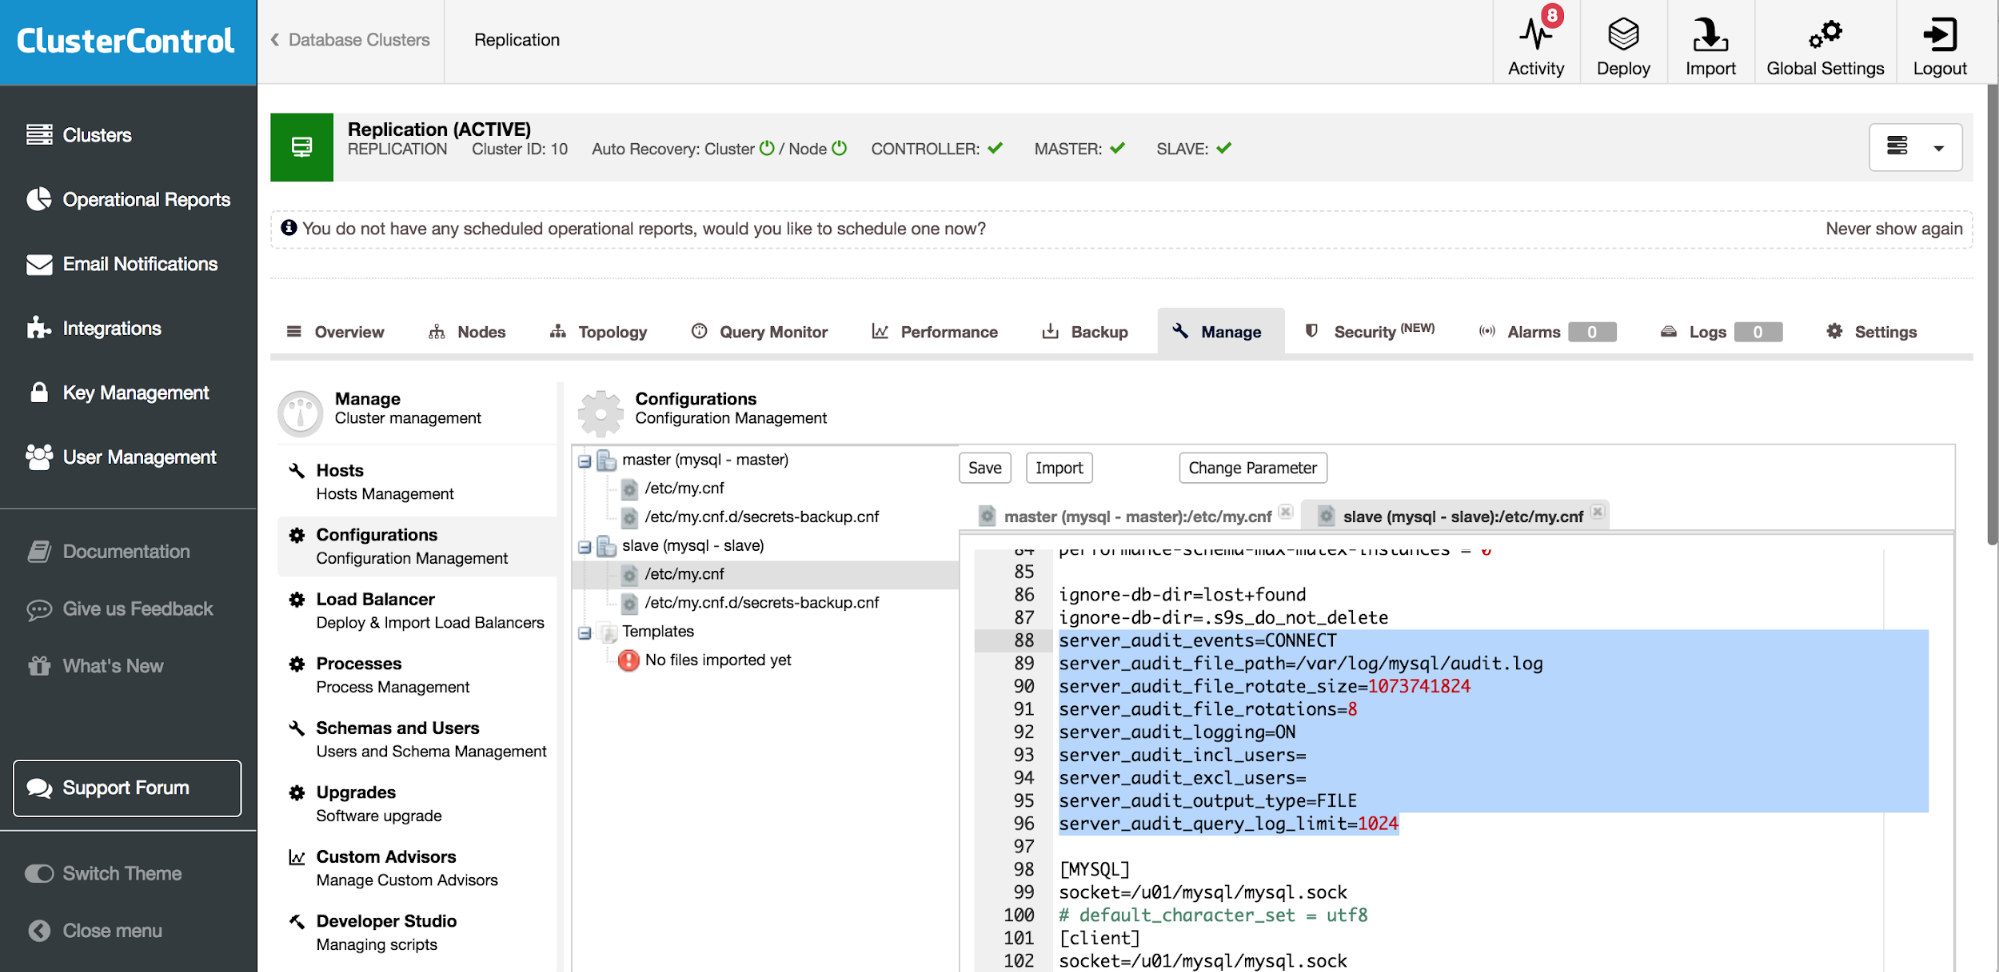
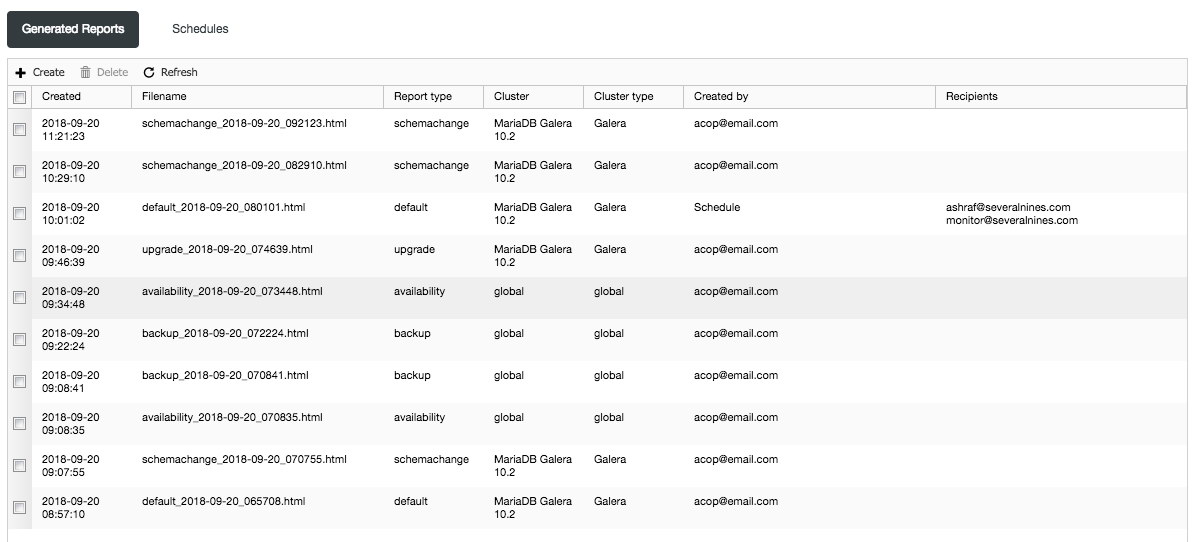
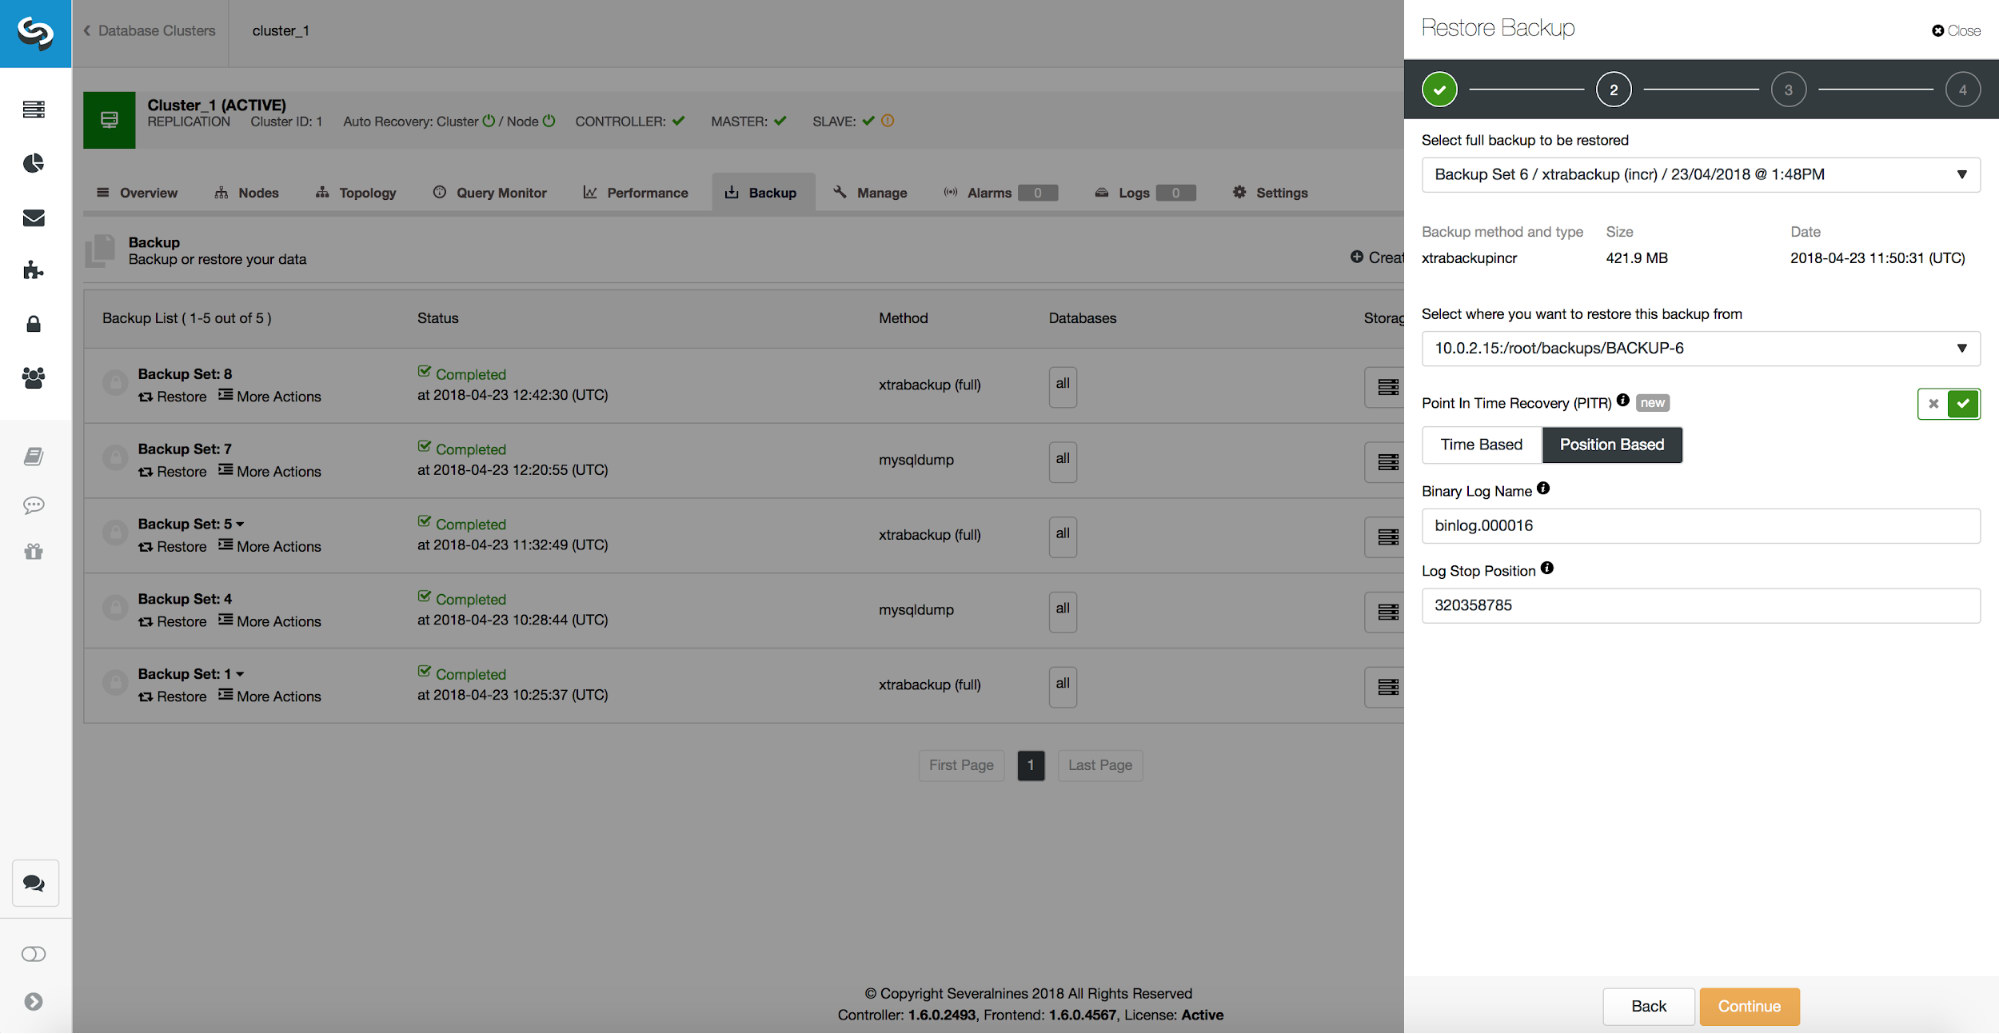
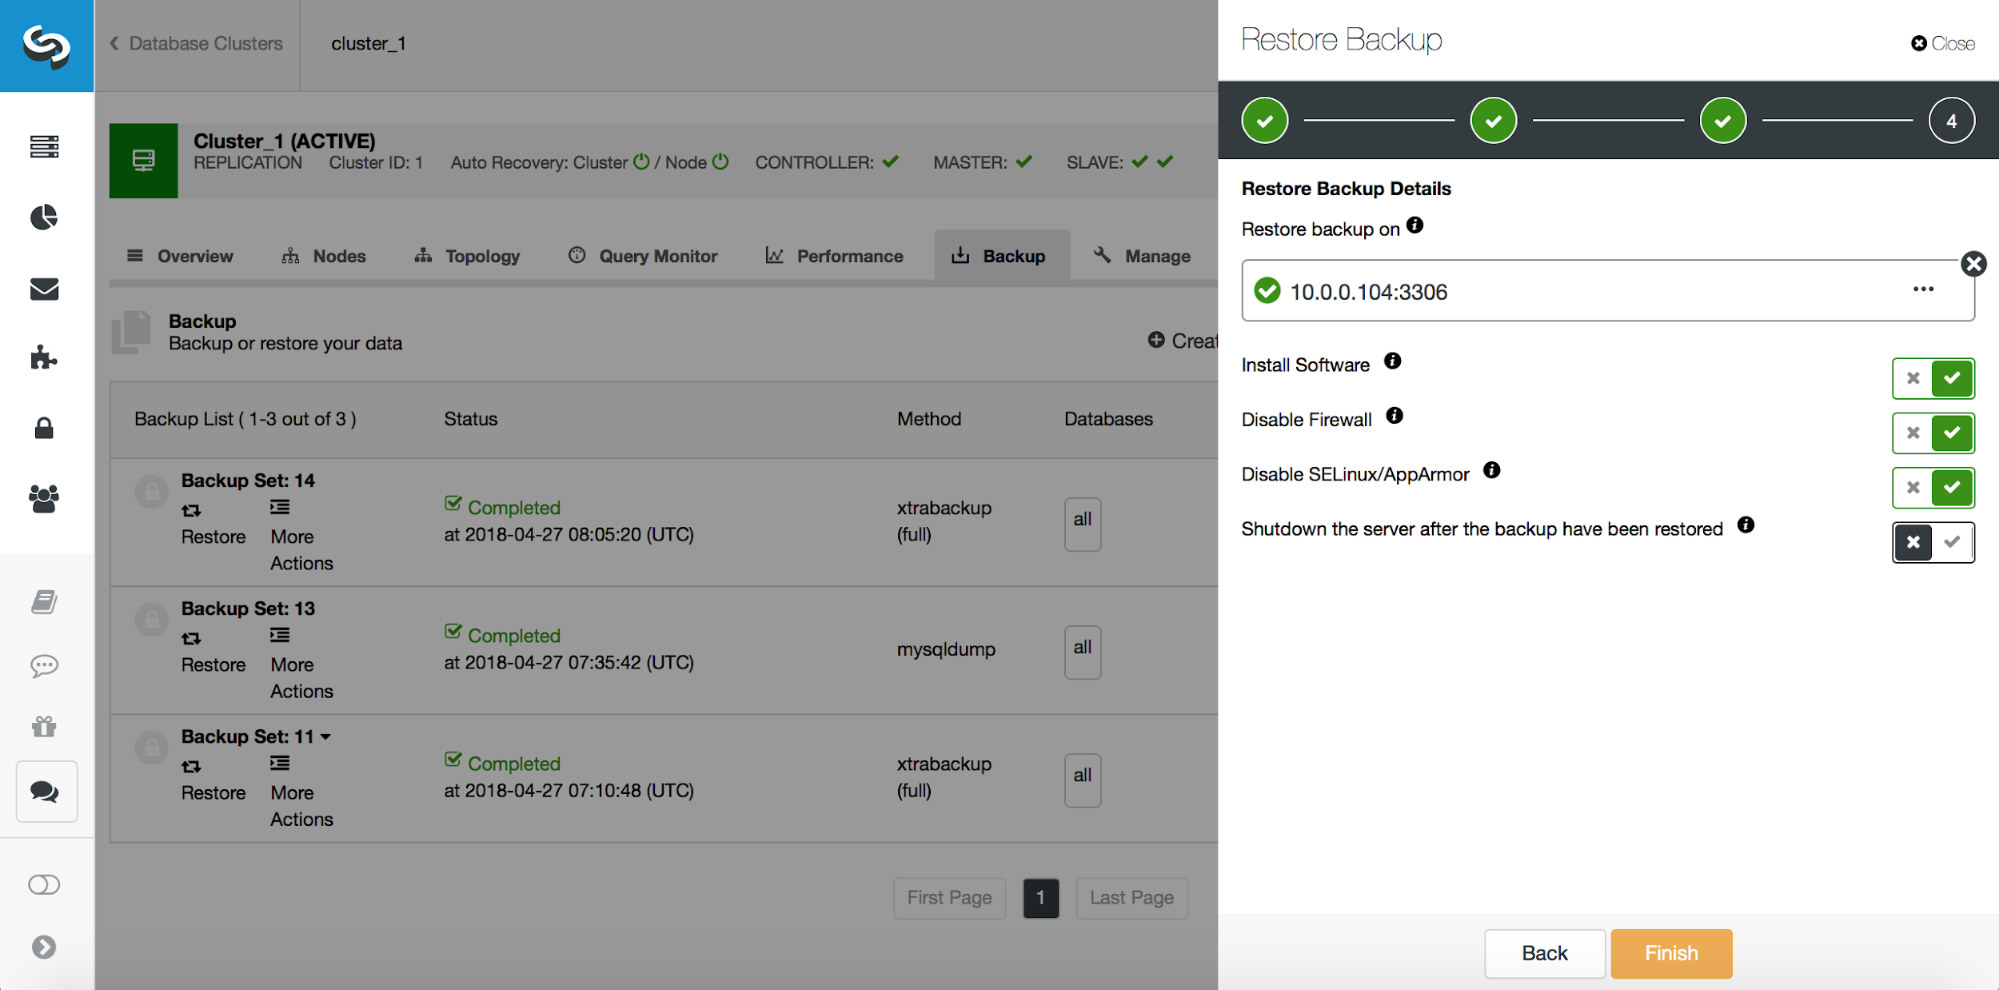
Backup is just a beginning - you will be able to restore your data to the point at which the backup was taken but, most likely, data was removed after that time. Just by restoring missing data from the latest backup, you may lose any data that was changed after the backup. To avoid that you should implement Point-In-Time Recovery. For MySQL it basically means you will have to use binary logs to replay all the changes which happened between the moment of the backup and the data loss event. The below screenshot shows how ClusterControl can help with that.
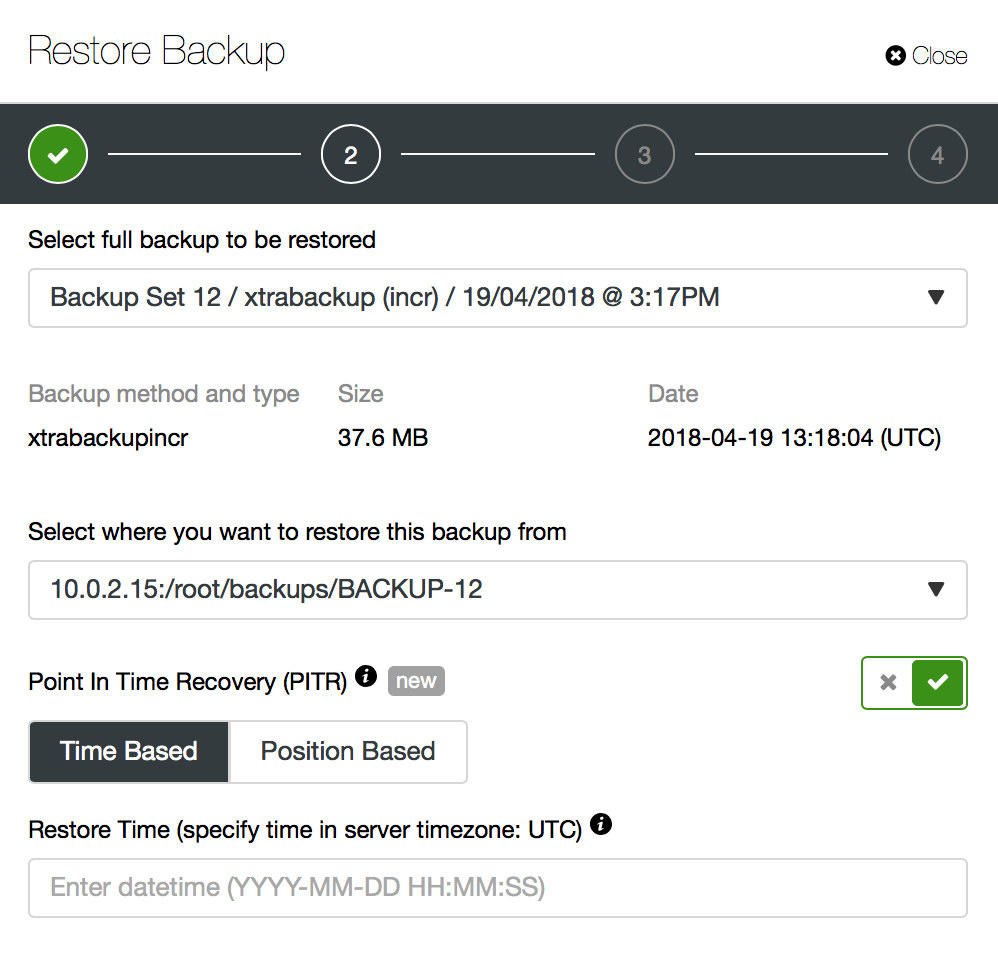
What you will have to do is to restore this backup up to the moment just before the data loss. You will have to restore it on a separate host in order not to make changes on the production cluster. Once you have the backup restored, you can log into that host, find the missing data, dump it and restore on the production cluster.
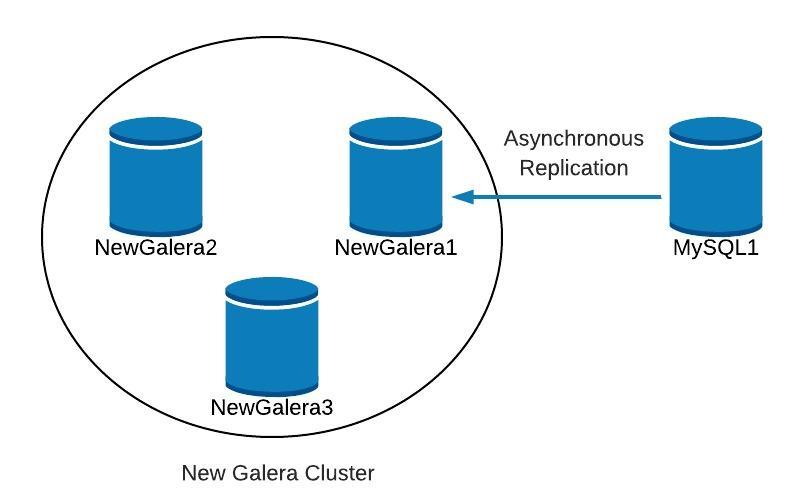
Delayed Slave
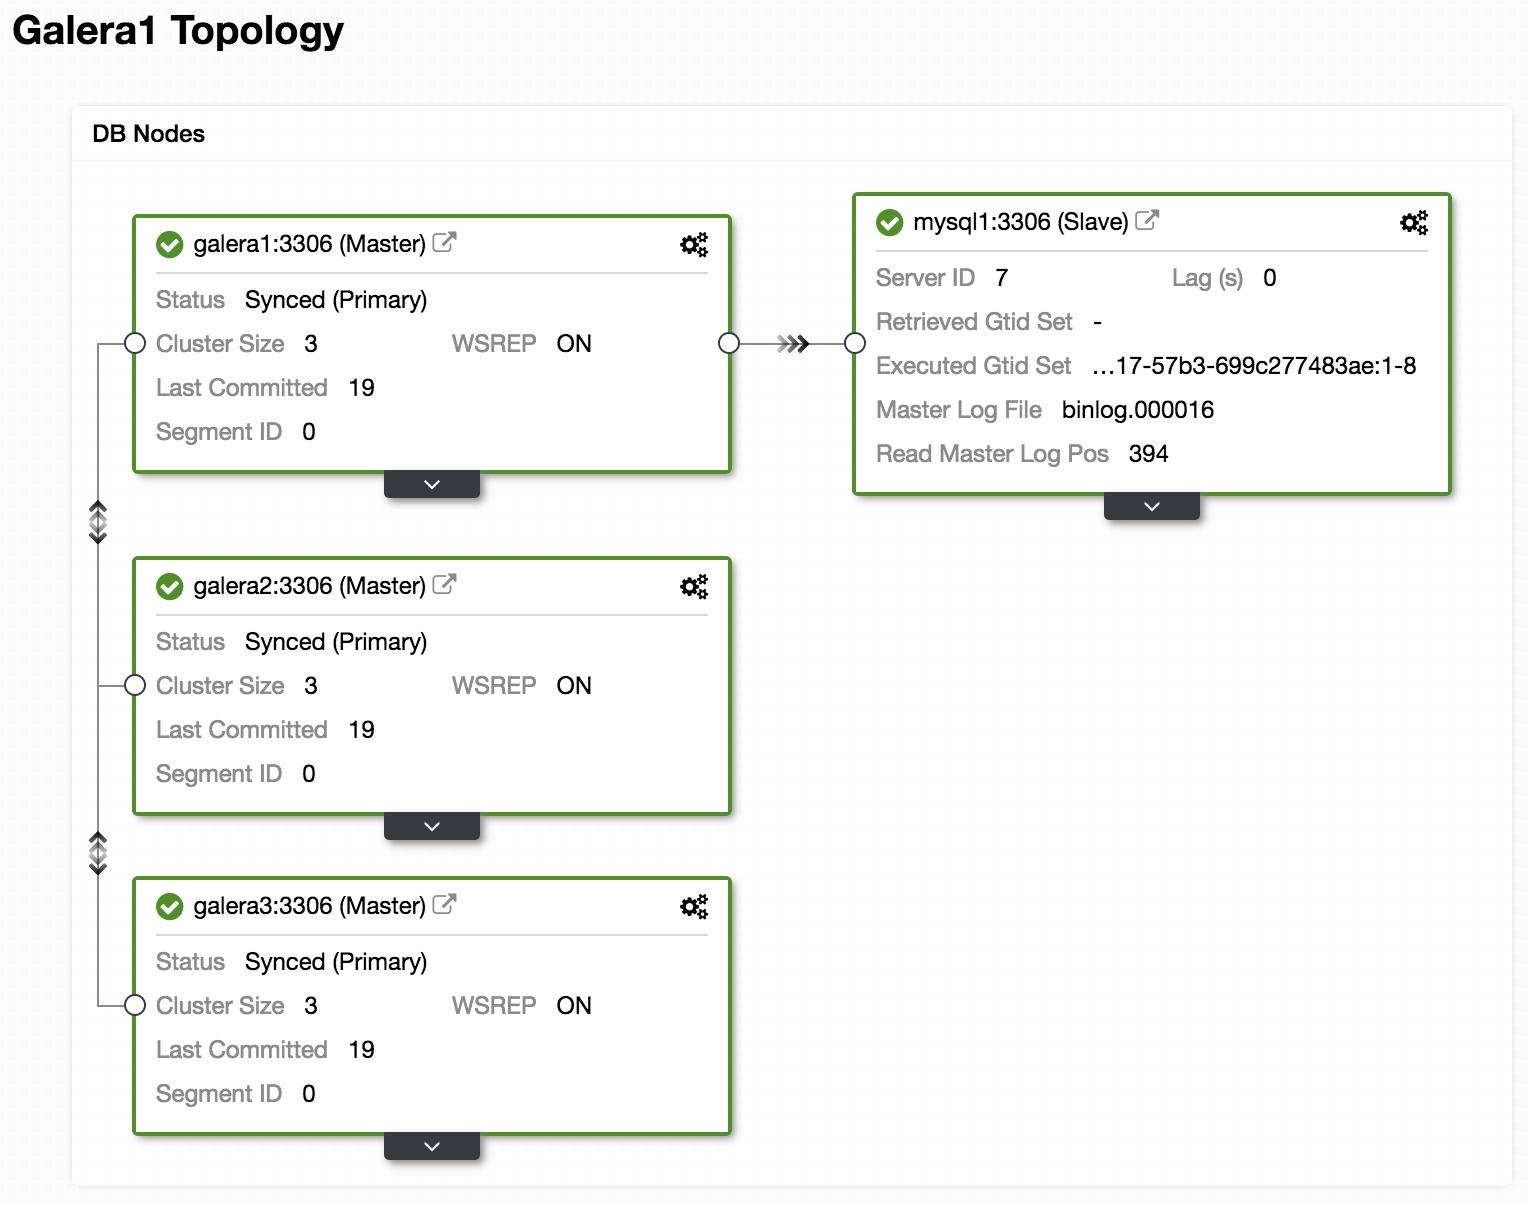
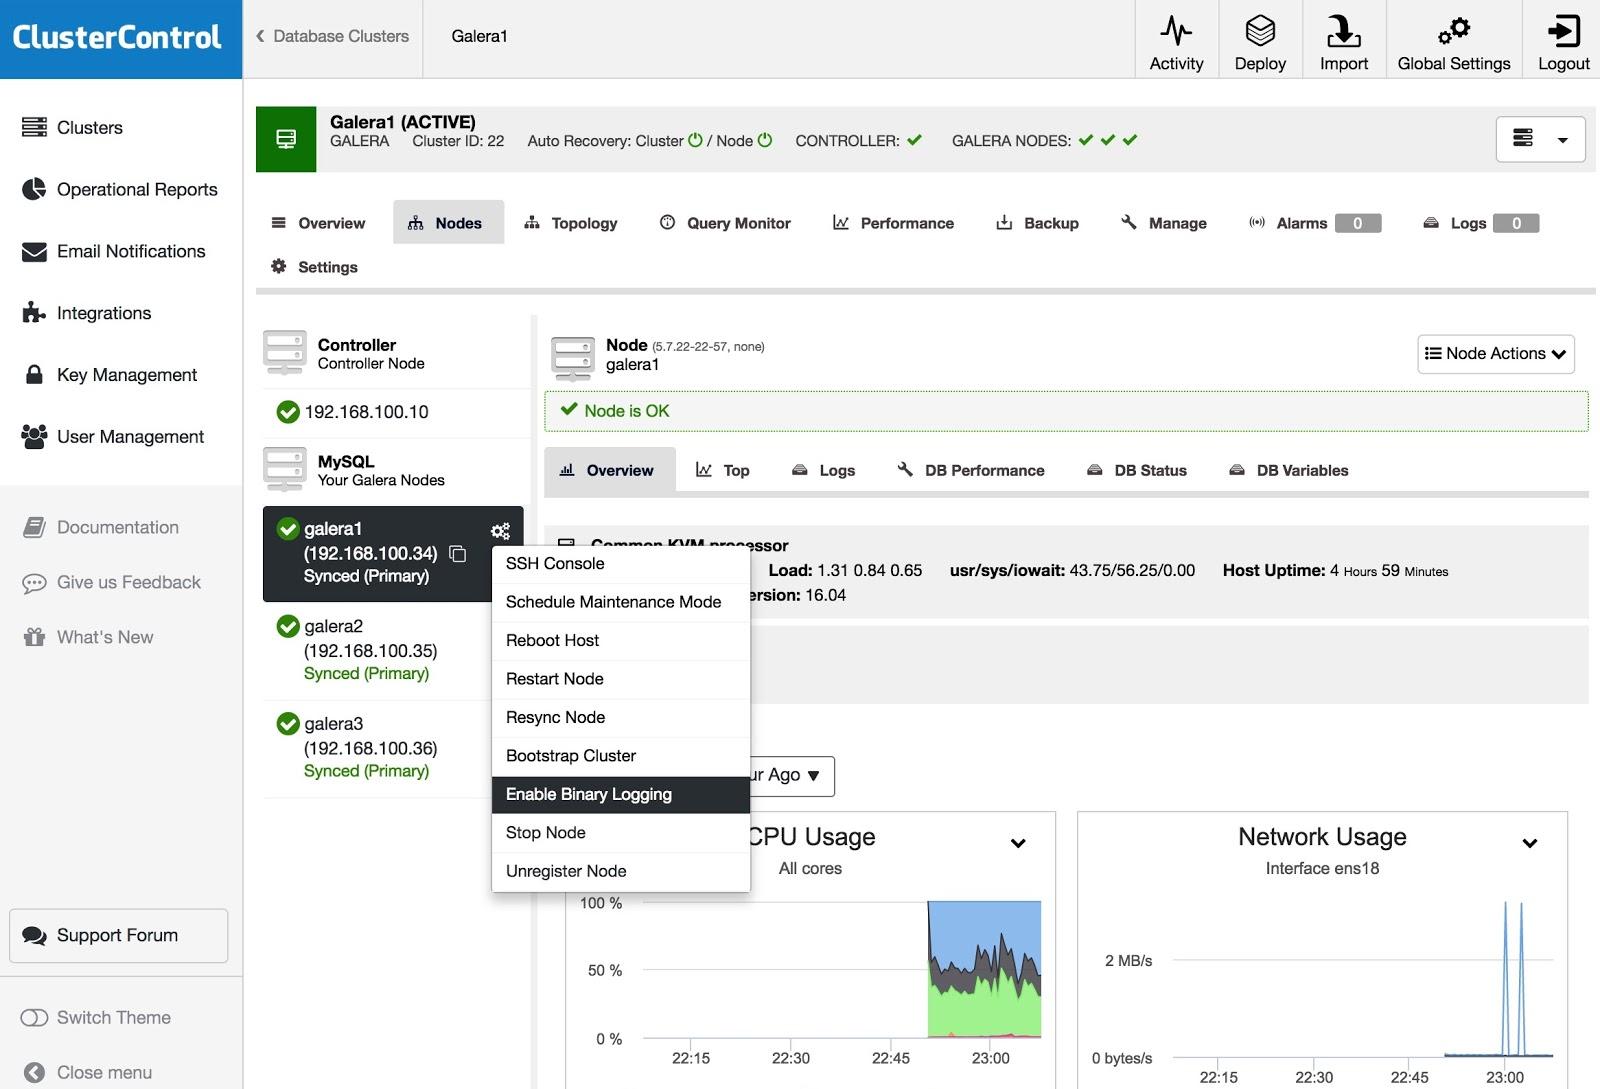
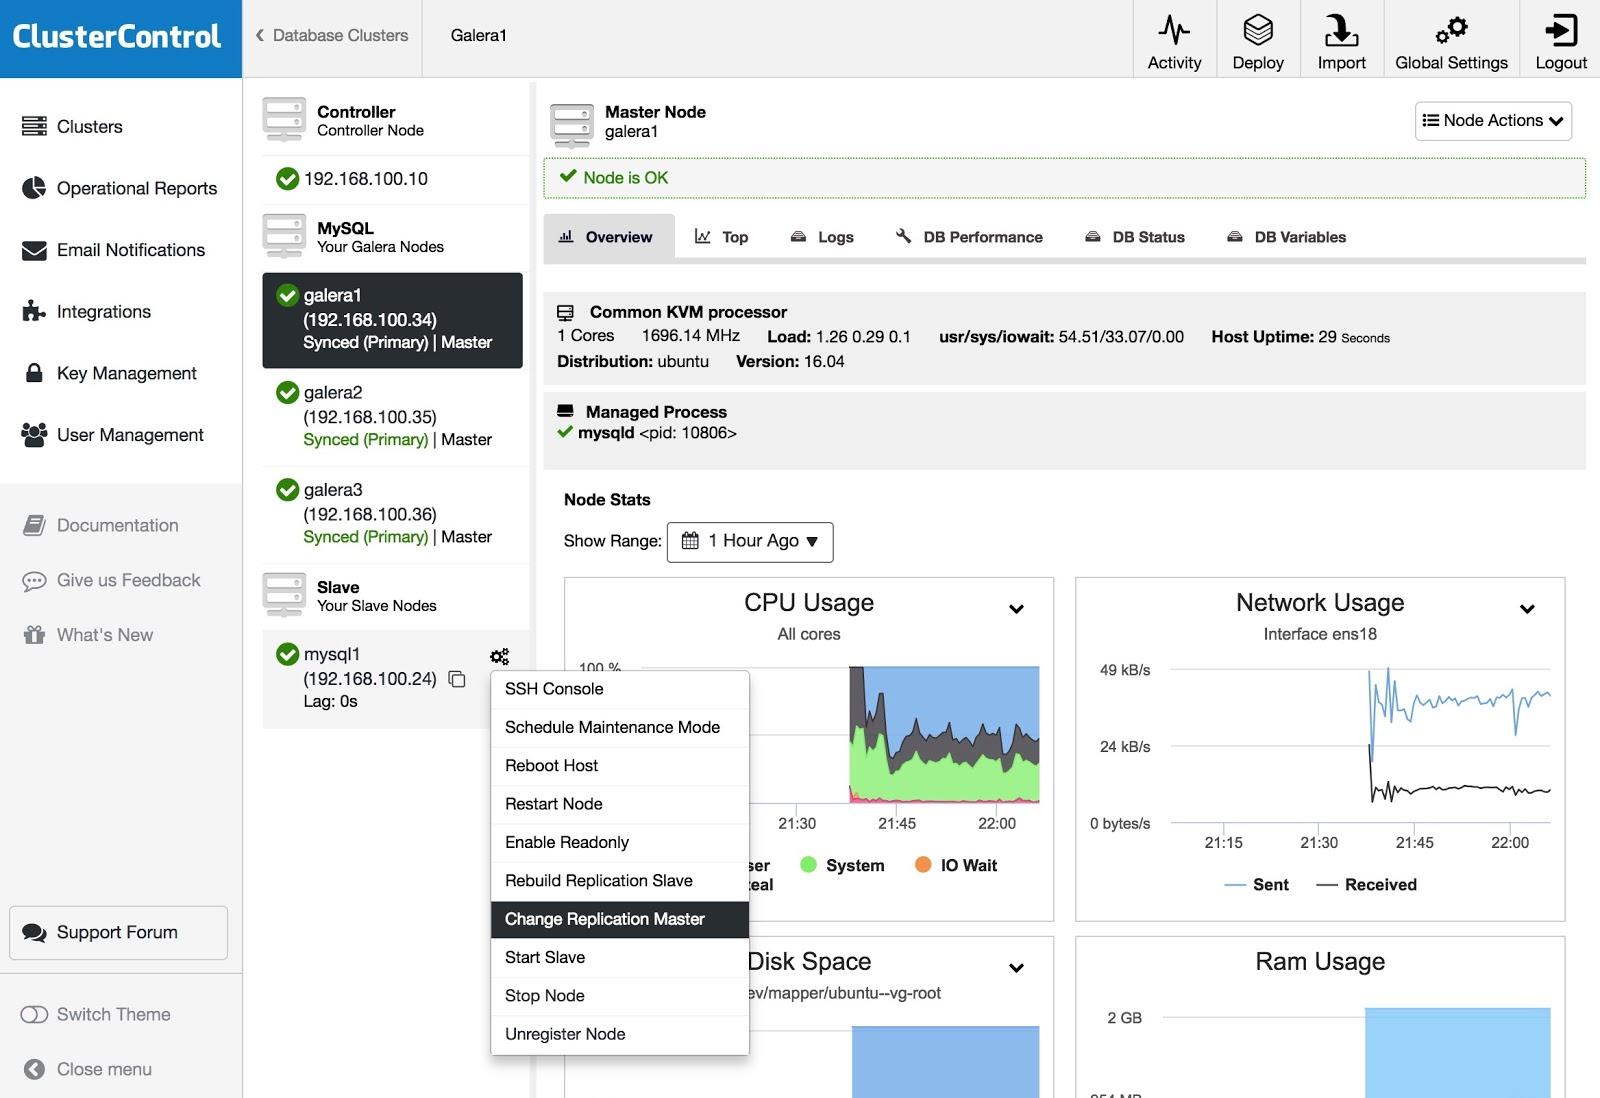
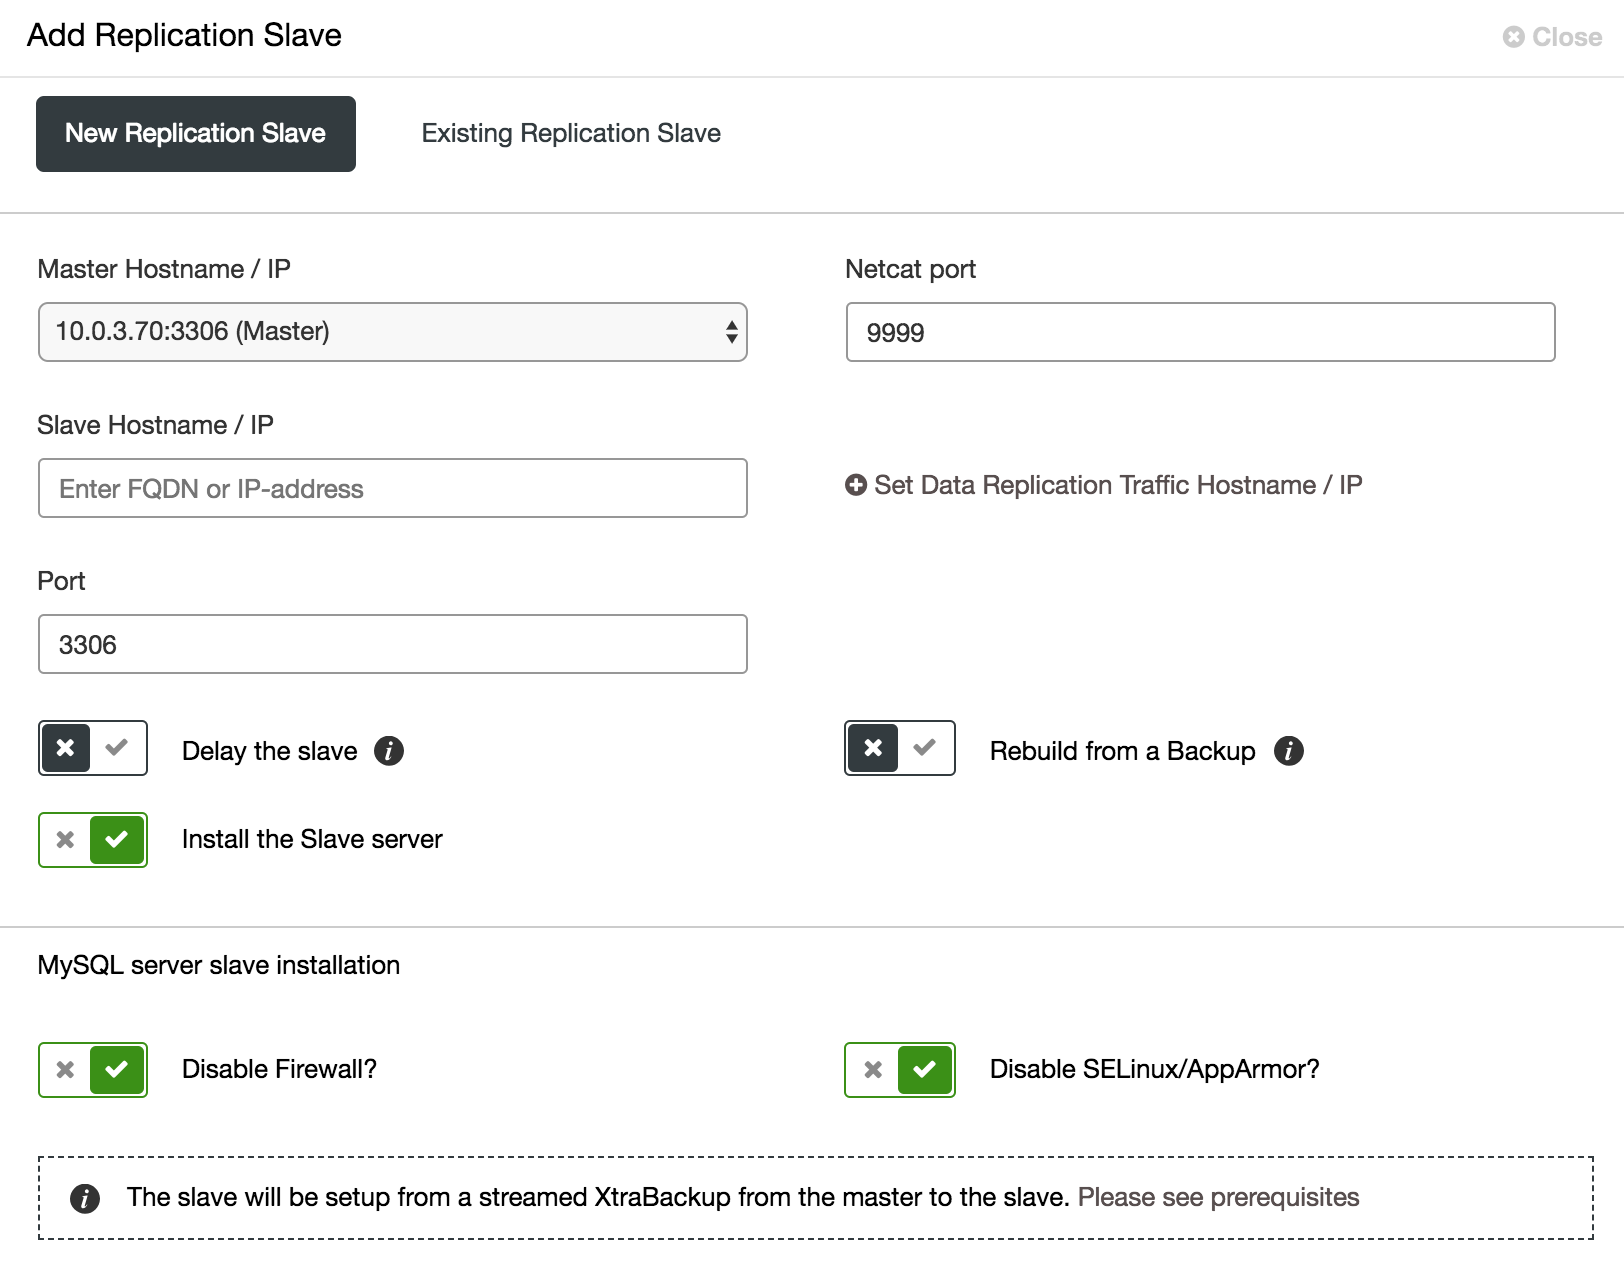
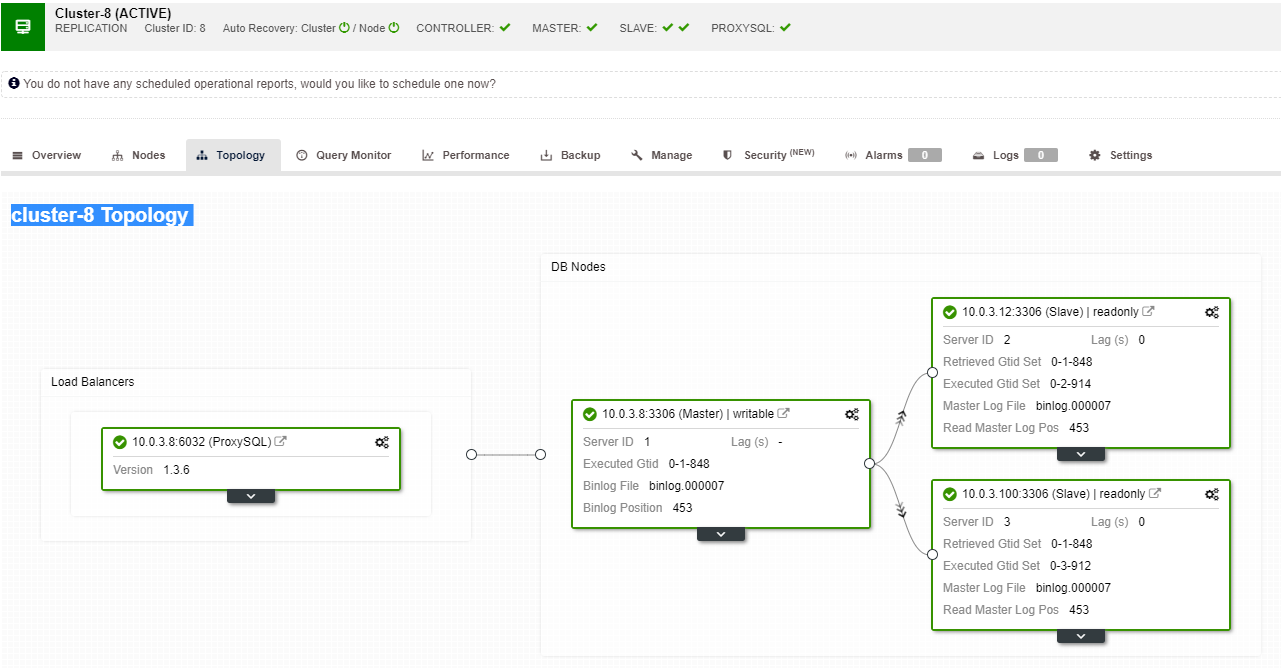
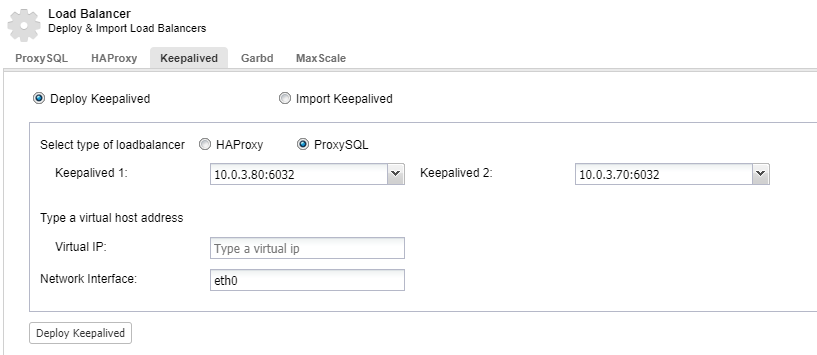
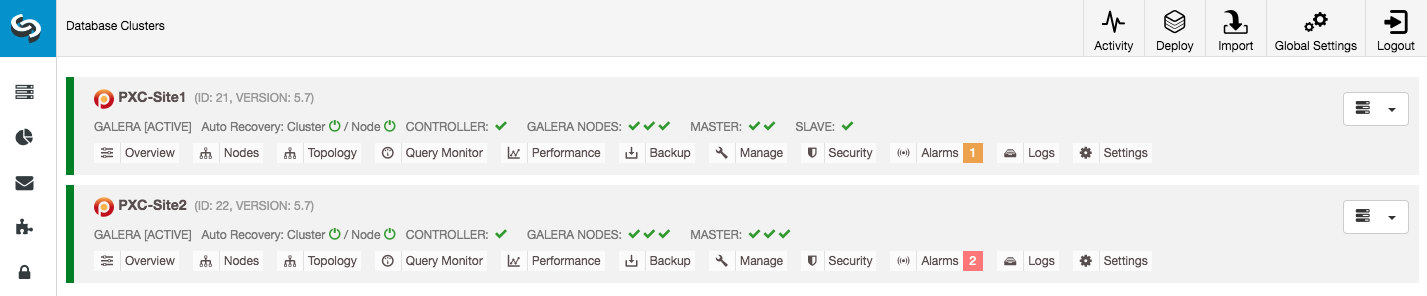
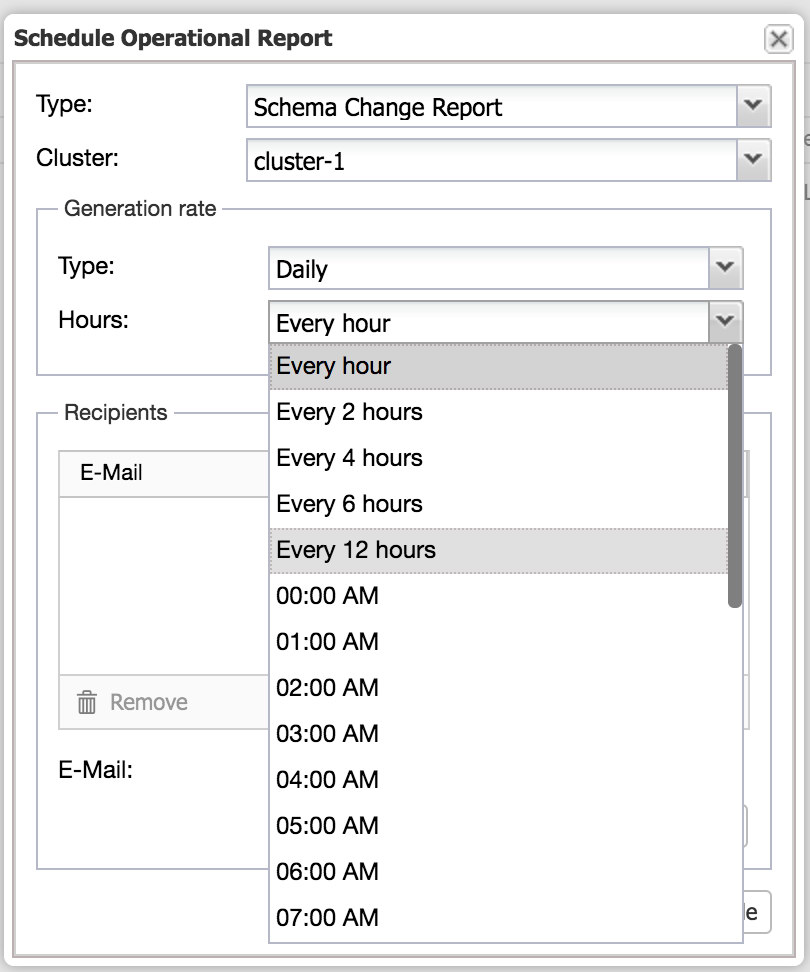
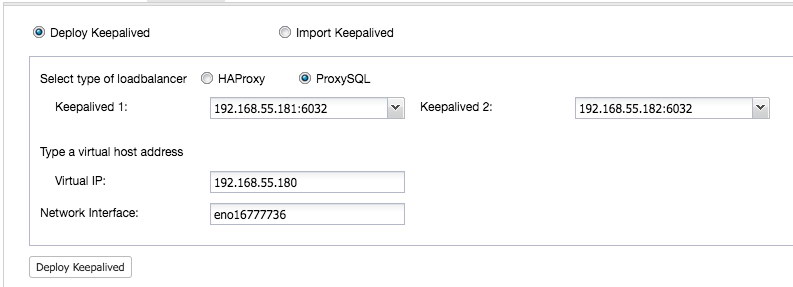
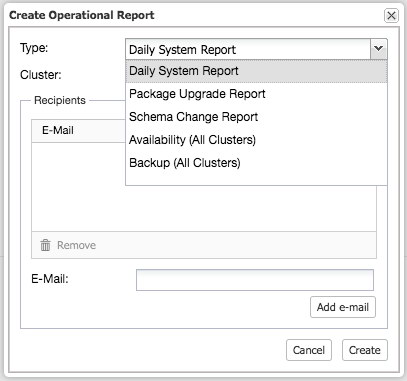
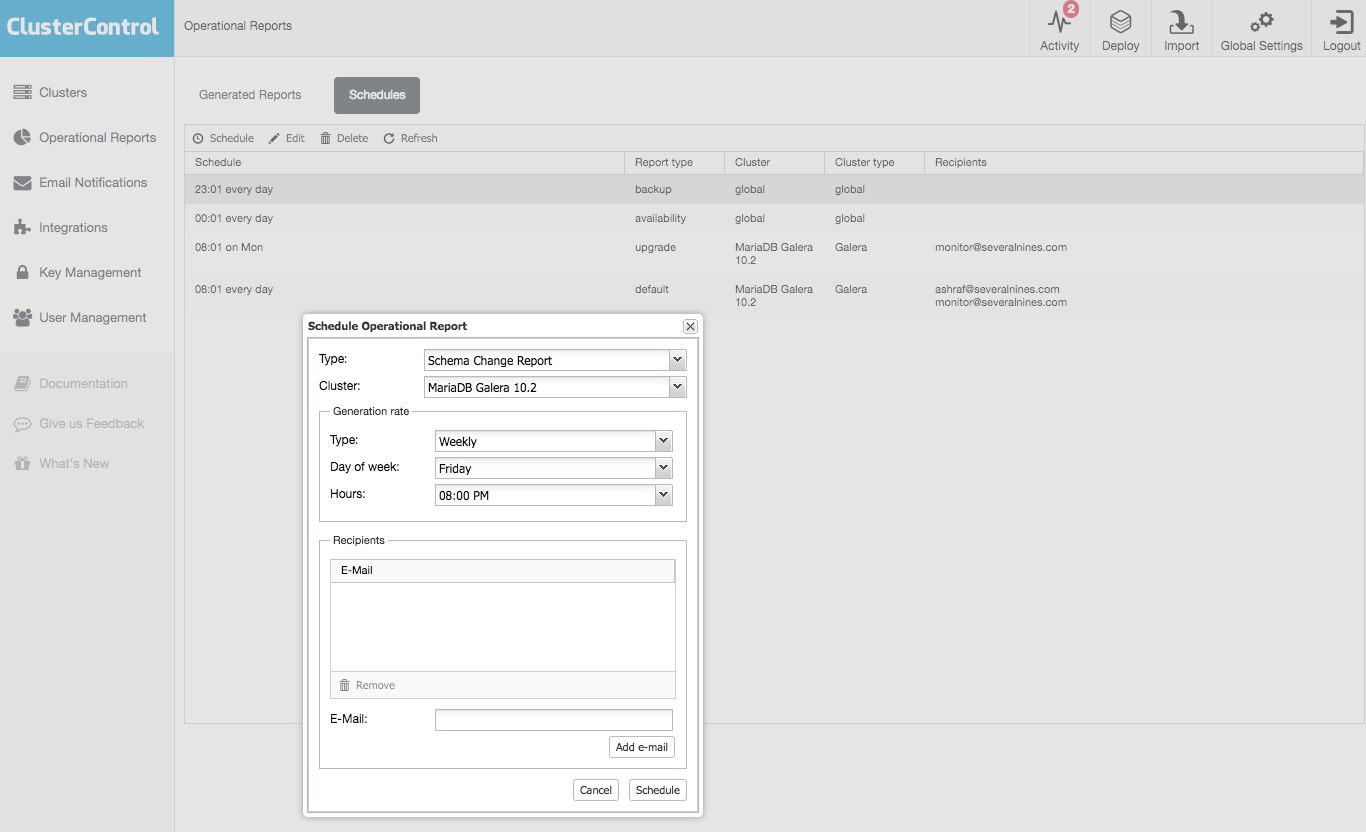
All of the methods we discussed above have one common pain point - it takes time to restore the data. It may take longer, when you restore all of the data and then try to dump only the interesting part. It may take less time if you have logical backup and you can quickly drill down to the data you want to restore, but it is by no means a quick task. You still have to find a couple of rows in a large text file. The larger it is, the more complicated the task gets - sometimes the sheer size of the file slows down all actions. One method to avoid those problems is to have a delayed slave. Slaves typically try to stay up to date with the master but it is also possible to configure them so that they will keep a distance from their master. In the below screenshot, you can see how to use ClusterControl to deploy such a slave:
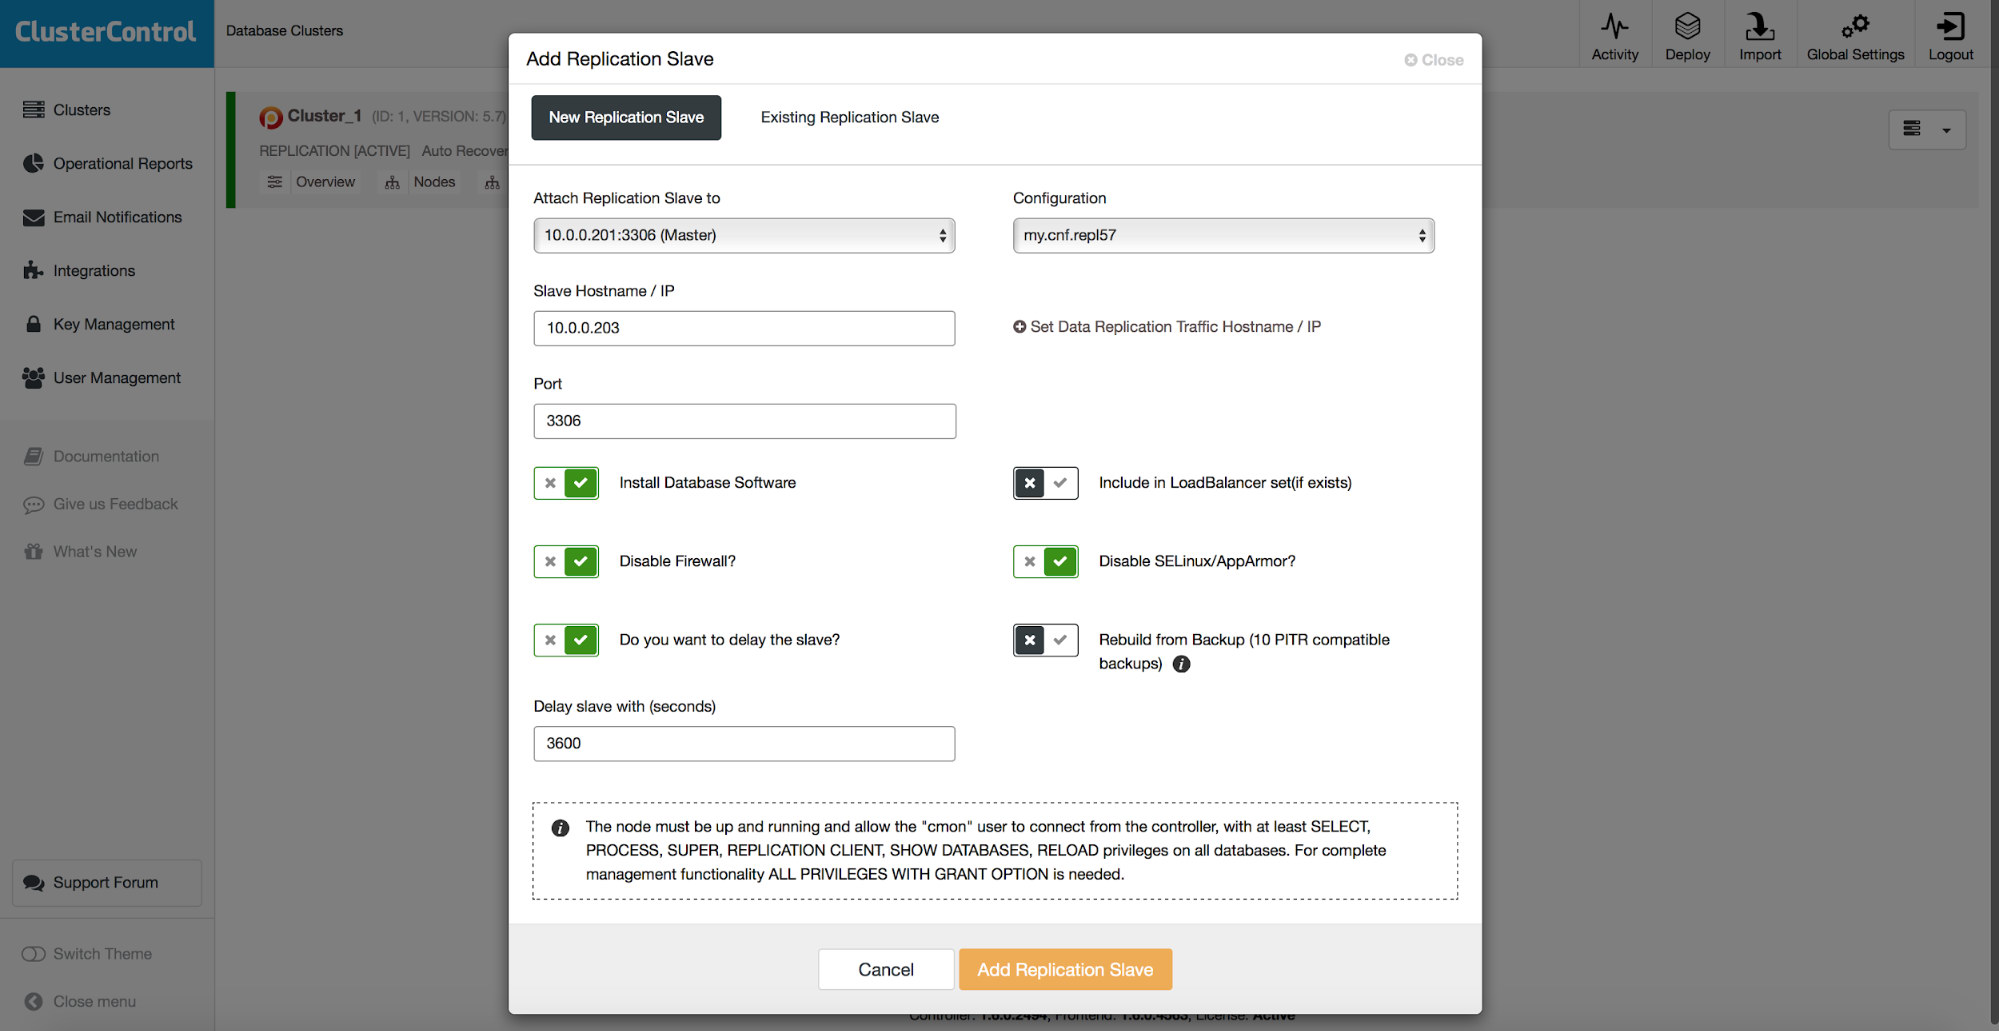
In short, we have here an option to add a replication slave to the database setup and configure it to be delayed. In the screenshot above, the slave will be delayed by 3600 seconds, which is one hour. This lets you to use that slave to recover the removed data up to one hour from the data deletion. You will not have to restore a backup, it will be enough to run mysqldump or SELECT ... INTO OUTFILE for the missing data and you will get the data to restore on your production cluster.
Restoring Data
In this section, we will go through a couple of examples of accidental data deletion and how you can recover from them. We will walk through recovery from a full data loss, we will also show how to recover from a partial data loss when using physical and logical backups. We will finally show you how to restore accidentally deleted rows if you have a delayed slave in your setup.
Full Data Loss
Accidental “rm -rf” or “DROP SCHEMA myonlyschema;” has been executed and you ended up with no data at all. If you happened to also remove files other than from the MySQL data directory, you may need to reprovision the host. To keep things simpler we will assume that only MySQL has been impacted. Let’s consider two cases, with a delayed slave and without one.
No Delayed Slave
In this case the only thing thing we can do is to restore the last physical backup. As all of our data has been removed, we don’t need to be worried about activity which happened after the data loss because with no data, there is no activity. We should be worried about the activity which happened after the backup took place. This means we have to do a Point-in-Time restore. Of course, it will take longer than to just restore data from the backup. If bringing your database up quickly is more crucial than to have all of the data restored, you can as well just restore a backup and be fine with it.
First of all, if you still have access to binary logs on the server you want to restore, you can use them for PITR. First, we want to convert the relevant part of the binary logs to a text file for further investigation. We know that data loss happened after 13:00:00. First, let’s check which binlog file we should investigate:
root@vagrant:~# ls -alh /var/lib/mysql/binlog.*
-rw-r----- 1 mysql mysql 1.1G Apr 23 10:32 /var/lib/mysql/binlog.000001
-rw-r----- 1 mysql mysql 1.1G Apr 23 10:33 /var/lib/mysql/binlog.000002
-rw-r----- 1 mysql mysql 1.1G Apr 23 10:35 /var/lib/mysql/binlog.000003
-rw-r----- 1 mysql mysql 1.1G Apr 23 10:38 /var/lib/mysql/binlog.000004
-rw-r----- 1 mysql mysql 1.1G Apr 23 10:39 /var/lib/mysql/binlog.000005
-rw-r----- 1 mysql mysql 1.1G Apr 23 10:41 /var/lib/mysql/binlog.000006
-rw-r----- 1 mysql mysql 1.1G Apr 23 10:43 /var/lib/mysql/binlog.000007
-rw-r----- 1 mysql mysql 1.1G Apr 23 10:45 /var/lib/mysql/binlog.000008
-rw-r----- 1 mysql mysql 1.1G Apr 23 10:47 /var/lib/mysql/binlog.000009
-rw-r----- 1 mysql mysql 1.1G Apr 23 10:49 /var/lib/mysql/binlog.000010
-rw-r----- 1 mysql mysql 1.1G Apr 23 10:51 /var/lib/mysql/binlog.000011
-rw-r----- 1 mysql mysql 1.1G Apr 23 10:53 /var/lib/mysql/binlog.000012
-rw-r----- 1 mysql mysql 1.1G Apr 23 10:55 /var/lib/mysql/binlog.000013
-rw-r----- 1 mysql mysql 1.1G Apr 23 10:57 /var/lib/mysql/binlog.000014
-rw-r----- 1 mysql mysql 1.1G Apr 23 10:59 /var/lib/mysql/binlog.000015
-rw-r----- 1 mysql mysql 306M Apr 23 13:18 /var/lib/mysql/binlog.000016
As can be seen, we are interested in the last binlog file.
root@vagrant:~# mysqlbinlog --start-datetime='2018-04-23 13:00:00' --verbose /var/lib/mysql/binlog.000016 > sql.outOnce done, let’s take a look at the contents of this file. We will search for ‘drop schema’ in vim. Here’s a relevant part of the file:
# at 320358785
#180423 13:18:58 server id 1 end_log_pos 320358850 CRC32 0x0893ac86 GTID last_committed=307804 sequence_number=307805 rbr_only=no
SET @@SESSION.GTID_NEXT= '52d08e9d-46d2-11e8-aa17-080027e8bf1b:443415'/*!*/;
# at 320358850
#180423 13:18:58 server id 1 end_log_pos 320358946 CRC32 0x487ab38e Query thread_id=55 exec_time=1 error_code=0
SET TIMESTAMP=1524489538/*!*/;
/*!\C utf8 *//*!*/;
SET @@session.character_set_client=33,@@session.collation_connection=33,@@session.collation_server=8/*!*/;
drop schema sbtest
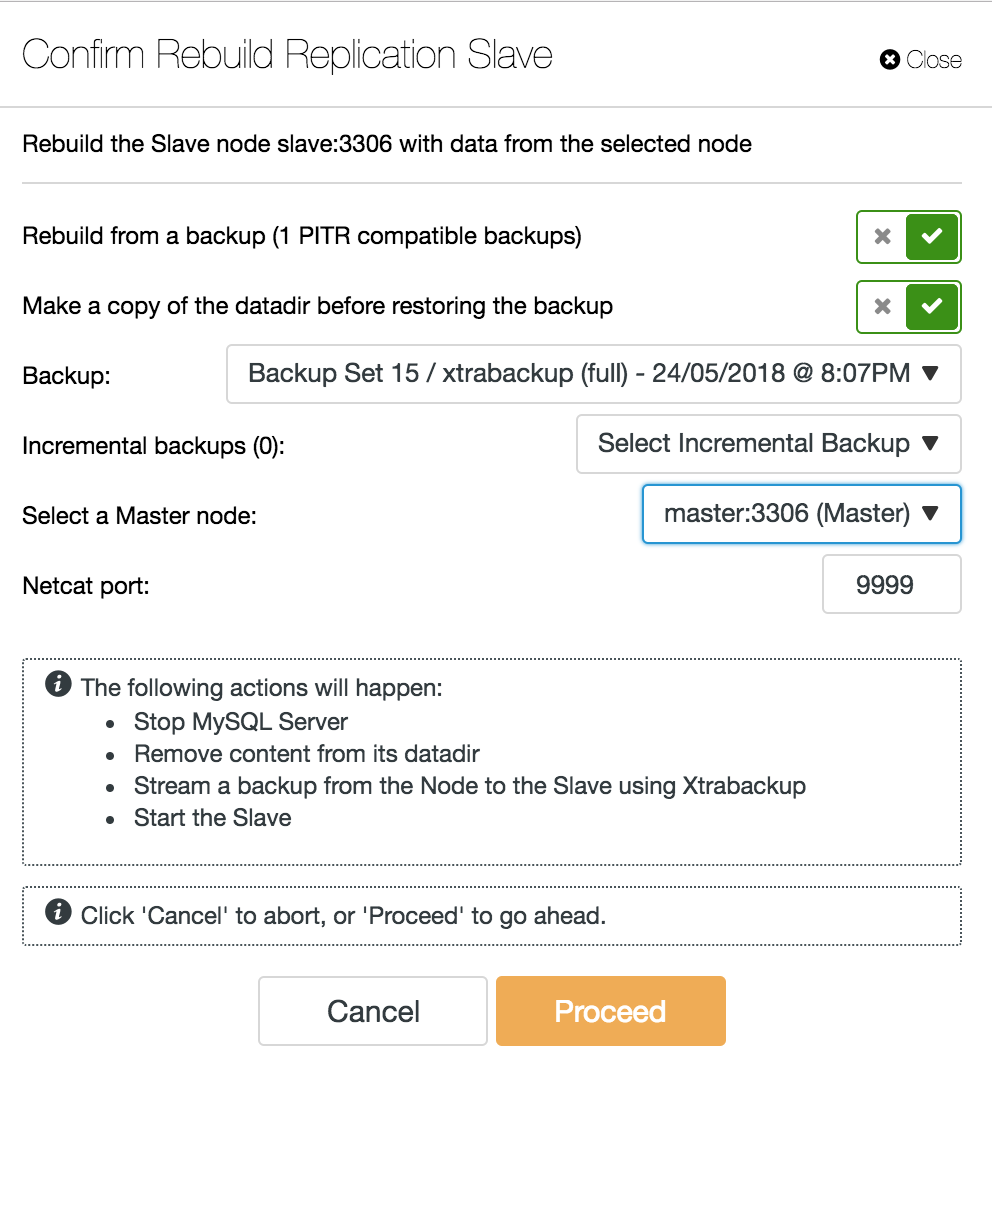
/*!*/;As we can see, we want to restore up to position 320358785. We can pass this data to the ClusterControl UI:
Delayed Slave
If we have a delayed slave and that host is enough to handle all of the traffic, we can use it and promote it to master. First though, we have to make sure it caught up with the old master up to the point of the data loss. We will use some CLI here to make it happen. First, we need to figure out on which position the data loss happened. Then we will stop the slave and let it run up to the data loss event. We showed how to get the correct position in the previous section - by examining binary logs. We can either use that position (binlog.000016, position 320358785) or, if we use a multithreaded slave, we should use GTID of the data loss event (52d08e9d-46d2-11e8-aa17-080027e8bf1b:443415) and replay queries up to that GTID.
First, let’s stop the slave and disable delay:
mysql> STOP SLAVE;
Query OK, 0 rows affected (0.01 sec)
mysql> CHANGE MASTER TO MASTER_DELAY = 0;
Query OK, 0 rows affected (0.02 sec)
Then we can start it up to a given binary log position.
mysql> START SLAVE UNTIL MASTER_LOG_FILE='binlog.000016', MASTER_LOG_POS=320358785;
Query OK, 0 rows affected (0.01 sec)
If we’d like to use GTID, the command will look different:
mysql> START SLAVE UNTIL SQL_BEFORE_GTIDS = ‘52d08e9d-46d2-11e8-aa17-080027e8bf1b:443415’;
Query OK, 0 rows affected (0.01 sec)
Once the replication stopped (meaning all of the events we asked for have been executed), we should verify that the host contains the missing data. If so, you can promote it to master and then rebuild other hosts using new master as the source of data.
This is not always the best option. All depends on how delayed your slave is - if it is delayed by a couple of hours, it may not make sense to wait for it to catch up, especially if write traffic is heavy in your environment. In such case, it’s most likely faster to rebuild hosts using physical backup. On the other hand, if you have a rather small volume of traffic, this could be a nice way to actually quickly fix the issue, promote new master and get on with serving traffic, while the rest of the nodes are being rebuilt in the background.
Partial Data Loss - Physical Backup
In case of the partial data loss, physical backups can be inefficient but, as those are the most common type of a backup, it’s very important to know how to use them for partial restore. First step will always be to restore a backup up to a point in time before the data loss event. It’s also very important to restore it on a separate host. ClusterControl uses xtrabackup for physical backups so we will show how to use it. Let’s assume we ran the following incorrect query:
DELETE FROM sbtest1 WHERE id < 23146;We wanted to delete just a single row (‘=’ in WHERE clause), instead we deleted a bunch of them (< in WHERE clause). Let’s take a look at the binary logs to find at which position the issue happened. We will use that position to restore the backup to.
mysqlbinlog --verbose /var/lib/mysql/binlog.000003 > bin.outNow, let’s look at the output file and see what we can find there. We are using row-based replication therefore we will not see the exact SQL that was executed. Instead (as long as we will use --verbose flag to mysqlbinlog) we will see events like below:
### DELETE FROM `sbtest`.`sbtest1`
### WHERE
###   @1=999296
###   @2=1009782
###   @3='96260841950-70557543083-97211136584-70982238821-52320653831-03705501677-77169427072-31113899105-45148058587-70555151875'
###   @4='84527471555-75554439500-82168020167-12926542460-82869925404'
As can be seen, MySQL identifies rows to delete using very precise WHERE condition. Mysterious signs in the human-readable comment, “@1”, “@2”, mean “first column”, “second column”. We know that the first column is ‘id’, which is something we are interested in. We need to find a large DELETE event on a ‘sbtest1’ table. Comments which will follow should mention id of 1, then id of ‘2’, then ‘3’ and so on - all up to id of ‘23145’. All should be executed in a single transaction (single event in a binary log). After analysing the output using ‘less’, we found:
### DELETE FROM `sbtest`.`sbtest1`
### WHERE
###   @1=1
###   @2=1006036
###   @3='123'
###   @4='43683718329-48150560094-43449649167-51455516141-06448225399'
### DELETE FROM `sbtest`.`sbtest1`
### WHERE
###   @1=2
###   @2=1008980
###   @3='123'
###   @4='05603373460-16140454933-50476449060-04937808333-32421752305'
The event, to which those comments are attached started at:
#180427 8:09:21 server id 1 end_log_pos 29600687 CRC32 0x8cfdd6ae Xid = 307686
COMMIT/*!*/;
# at 29600687
#180427 8:09:21 server id 1 end_log_pos 29600752 CRC32 0xb5aa18ba GTID last_committed=42844 sequence_number=42845 rbr_only=yes
/*!50718 SET TRANSACTION ISOLATION LEVEL READ COMMITTED*//*!*/;
SET @@SESSION.GTID_NEXT= '0c695e13-4931-11e8-9f2f-080027e8bf1b:55893'/*!*/;
# at 29600752
#180427 8:09:21 server id 1 end_log_pos 29600826 CRC32 0xc7b71da5 Query thread_id=44 exec_time=0 error_code=0
SET TIMESTAMP=1524816561/*!*/;
/*!\C utf8 *//*!*/;
SET @@session.character_set_client=33,@@session.collation_connection=33,@@session.collation_server=8/*!*/;
BEGIN
/*!*/;
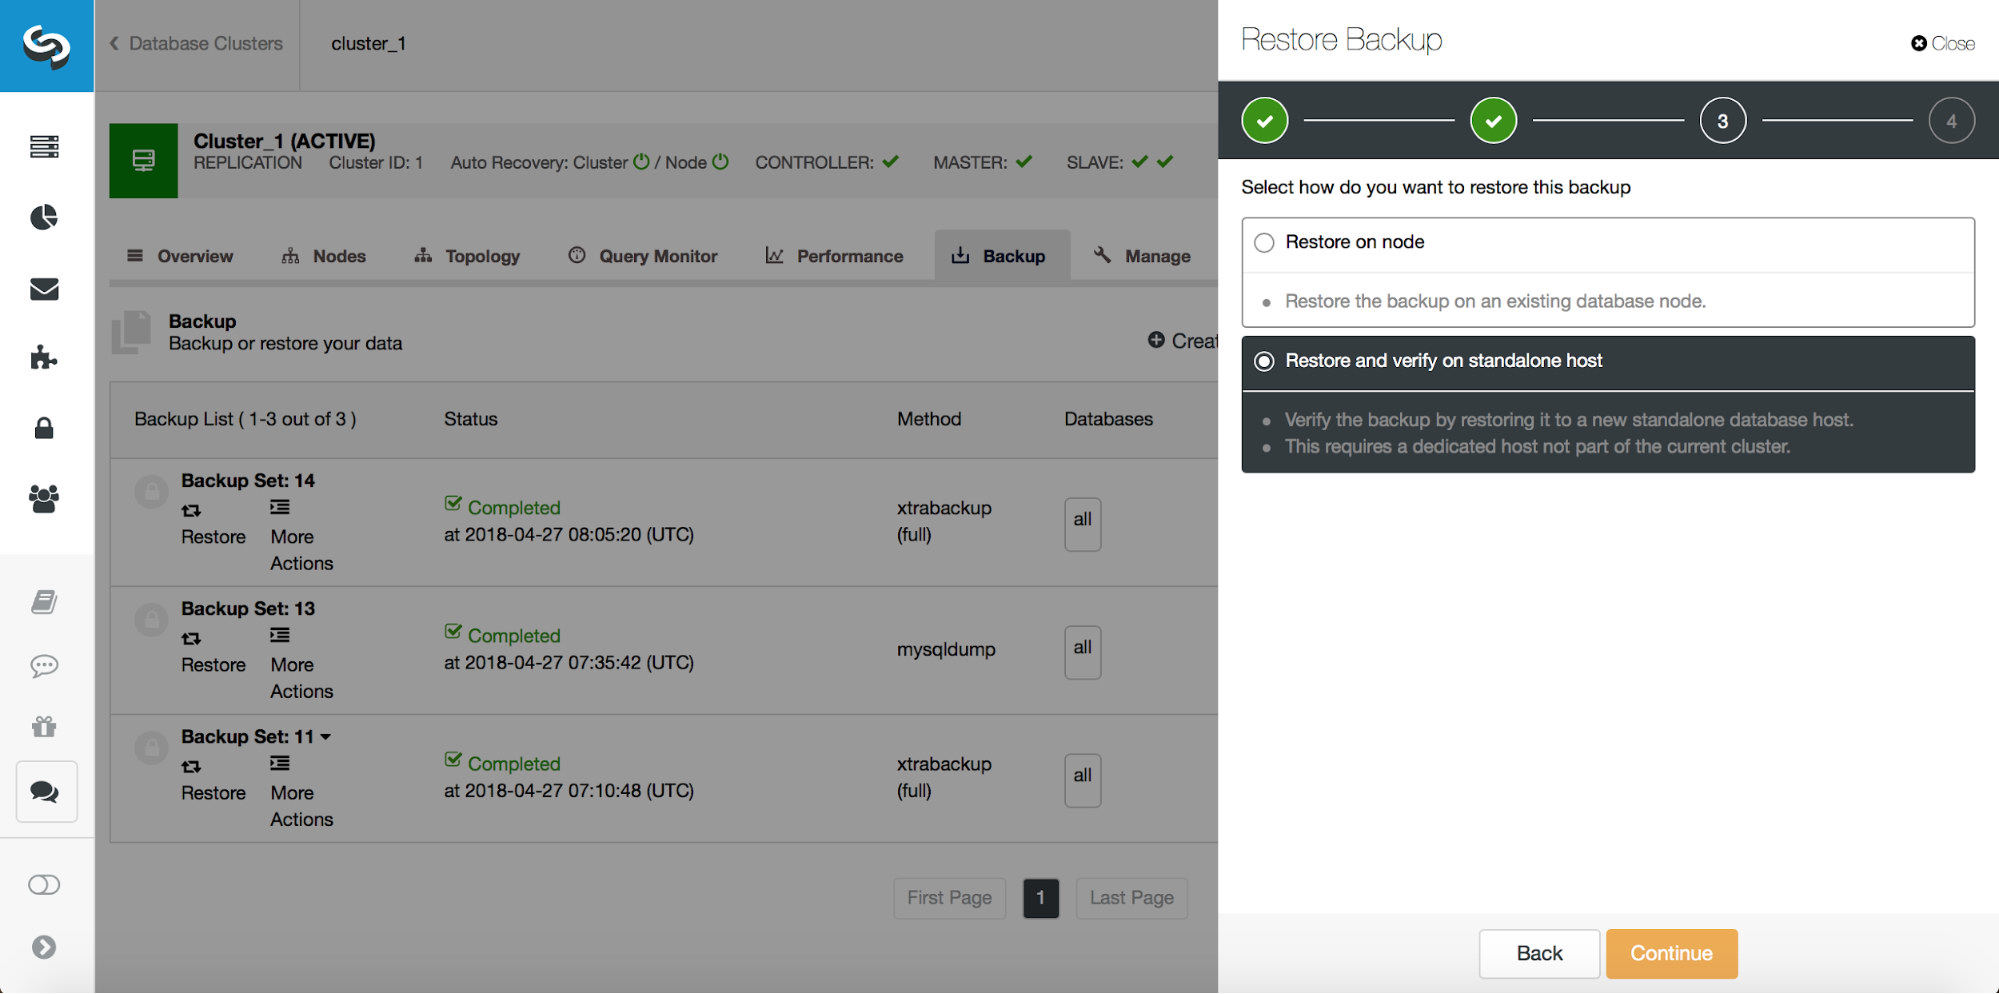
# at 29600826So, we want to restore the backup up to the previous commit at position 29600687. Let’s do that now. We’ll use external server for that. We will restore backup up to that position and we will keep the restore server up and running so we can then later extract the missing data.
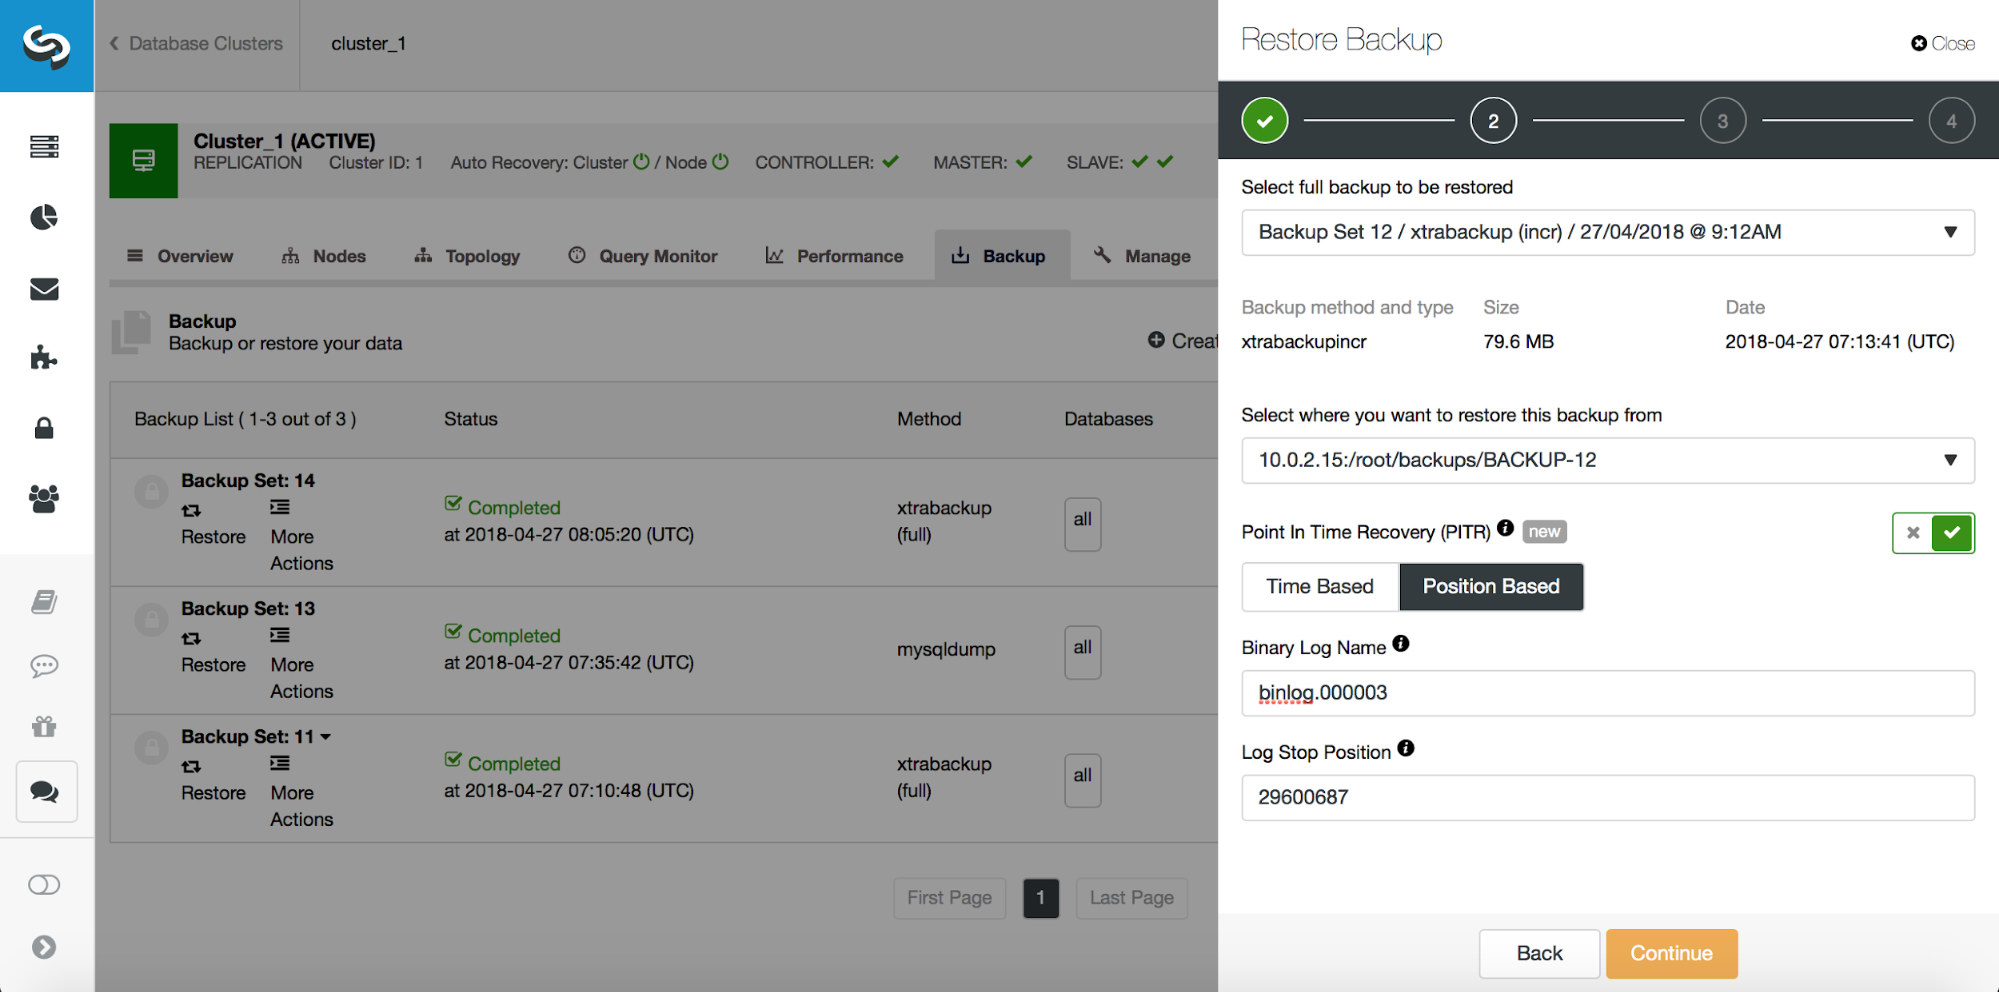
Once restore is completed, let’s make sure our data has been recovered:
mysql> SELECT COUNT(*) FROM sbtest.sbtest1 WHERE id < 23146;
+----------+
| COUNT(*) |
+----------+
|    23145 |
+----------+
1 row in set (0.03 sec)
Looks good. Now we can extract this data into a file which we will load back on the master.
mysql> SELECT * FROM sbtest.sbtest1 WHERE id < 23146 INTO OUTFILE 'missing.sql';
ERROR 1290 (HY000): The MySQL server is running with the --secure-file-priv option so it cannot execute this statement
Something is not right - this is because the server is configured to be able to write files only in a particular location - it’s all about security, we don’t want to let users save contents anywhere they like. Let’s check where we can save our file:
mysql> SHOW VARIABLES LIKE "secure_file_priv";
+------------------+-----------------------+
| Variable_name    | Value                 |
+------------------+-----------------------+
| secure_file_priv | /var/lib/mysql-files/ |
+------------------+-----------------------+
1 row in set (0.13 sec)
Ok, let’s try one more time:
mysql> SELECT * FROM sbtest.sbtest1 WHERE id < 23146 INTO OUTFILE '/var/lib/mysql-files/missing.sql';
Query OK, 23145 rows affected (0.05 sec)
Now it looks much better. Let’s copy the data to the master:
root@vagrant:~# scp /var/lib/mysql-files/missing.sql 10.0.0.101:/var/lib/mysql-files/
missing.sql                                                                                                                                                                      100% 1744KB   1.7MB/s   00:00
Now it’s time to load the missing rows on the master and test if it succeeded:
mysql> LOAD DATA INFILE '/var/lib/mysql-files/missing.sql' INTO TABLE sbtest.sbtest1;
Query OK, 23145 rows affected (2.22 sec)
Records: 23145  Deleted: 0  Skipped: 0  Warnings: 0

mysql> SELECT COUNT(*) FROM sbtest.sbtest1 WHERE id < 23146;
+----------+
| COUNT(*) |
+----------+
|    23145 |
+----------+
1 row in set (0.00 sec)
That’s all, we restored our missing data.
Partial Data Loss - Logical Backup
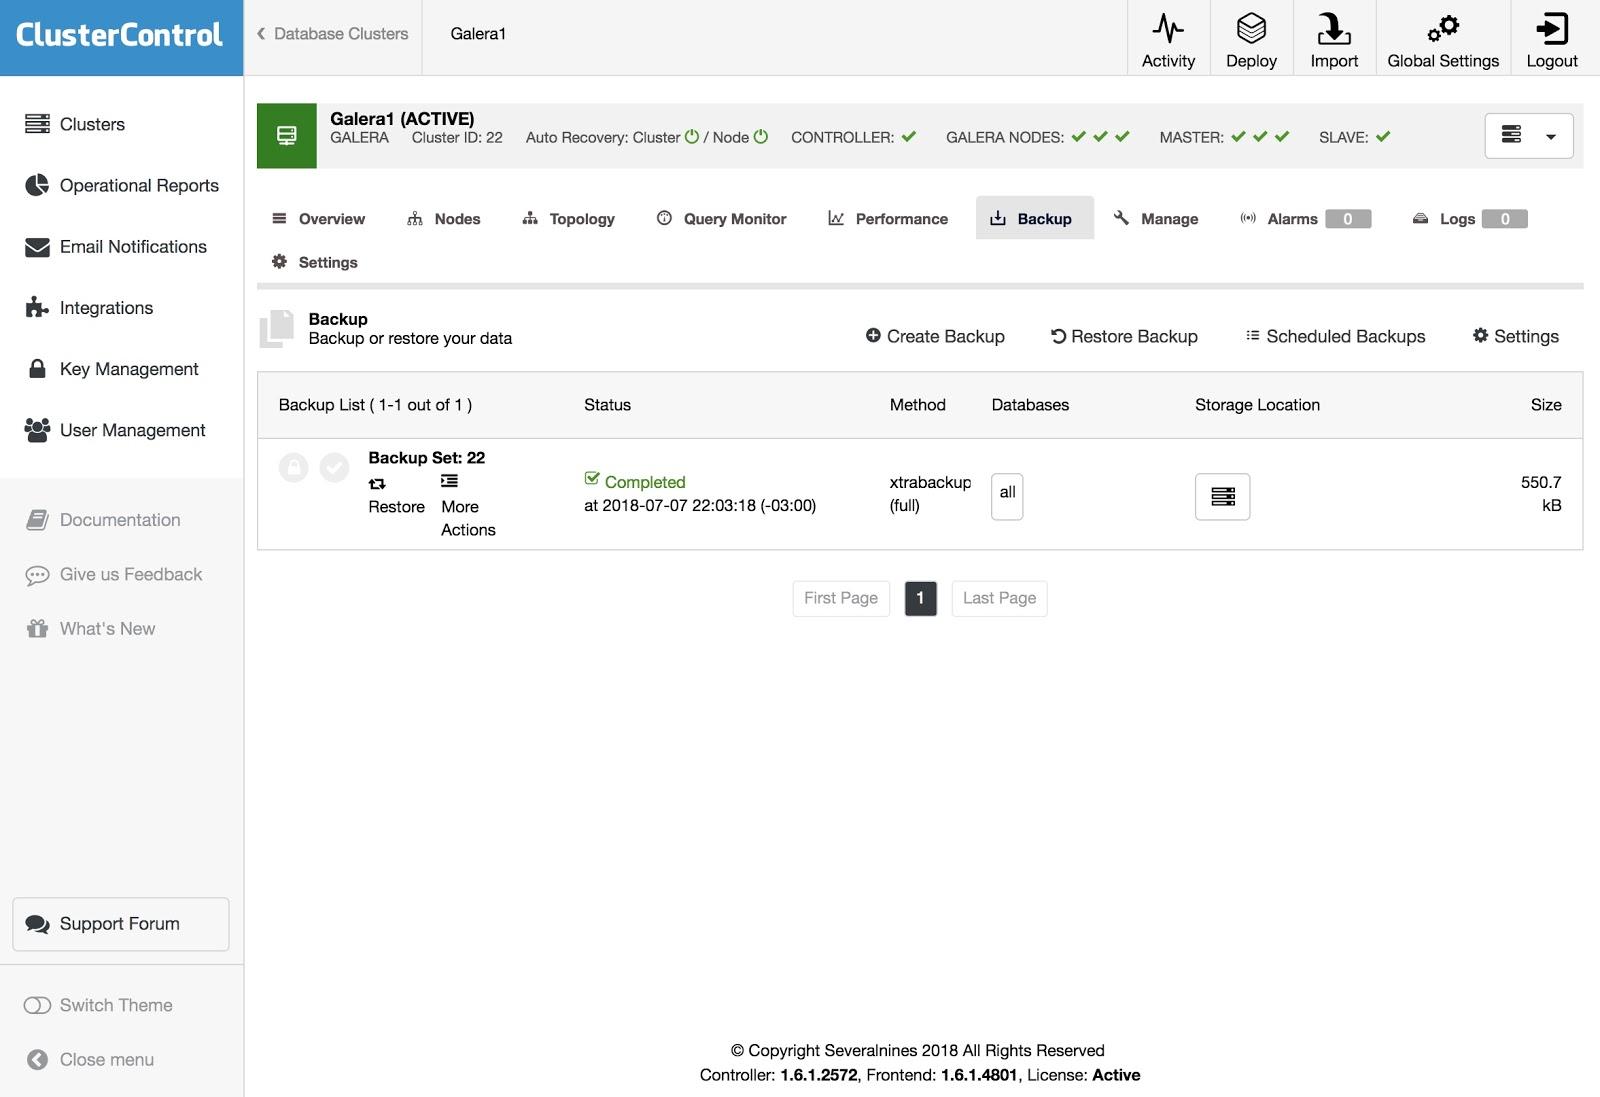
In the previous section, we restored lost data using physical backup and an external server. What if we had logical backup created? Let’s take a look. First, let’s verify that we do have a logical backup:
root@vagrant:~# ls -alh /root/backups/BACKUP-13/
total 5.8G
drwx------ 2 root root 4.0K Apr 27 07:35 .
drwxr-x--- 5 root root 4.0K Apr 27 07:14 ..
-rw-r--r-- 1 root root 2.4K Apr 27 07:35 cmon_backup.metadata
-rw------- 1 root root 5.8G Apr 27 07:35 mysqldump_2018-04-27_071434_complete.sql.gz
Yes, it’s there. Now, it’s time to decompress it.
root@vagrant:~# mkdir /root/restore
root@vagrant:~# zcat /root/backups/BACKUP-13/mysqldump_2018-04-27_071434_complete.sql.gz > /root/restore/backup.sql
When you look into it, you will see that the data is stored in multi-value INSERT format. For example:
INSERT INTO `sbtest1` VALUES (1,1006036,'18034632456-32298647298-82351096178-60420120042-90070228681-93395382793-96740777141-18710455882-88896678134-41810932745','43683718329-48150560094-43449649167-51455516141-06448225399'),(2,1008980,'69708345057-48265944193-91002879830-11554672482-35576538285-03657113365-90301319612-18462263634-56608104414-27254248188','05603373460-16140454933-50476449060-04937808333-32421752305')All we need to do now is to pinpoint where our table is located and then where the rows, which are of interest to us, are stored. First, knowing mysqldump patterns (drop table, create new one, disable indexes, insert data) let’s figure out which line contains CREATE TABLE statement for ‘sbtest1’ table:
root@vagrant:~/restore# grep -n "CREATE TABLE \`sbtest1\`" backup.sql > out
root@vagrant:~/restore# cat out
971:CREATE TABLE `sbtest1` (
Now, using a method of trial and error, we need to figure out where to look for our rows. We’ll show you the final command we came up with. The whole trick is to try and print different range of lines using sed and then check if the latest line contains rows close to, but later than what we are searching for. In the command below we look for lines between 971 (CREATE TABLE) and 993. We also ask sed to quit once it reaches line 994 as the rest of the file is of no interest to us:
root@vagrant:~/restore# sed -n '971,993p; 994q' backup.sql > 1.sql
root@vagrant:~/restore# tail -n 1 1.sql  | less
The output looks like below:
INSERT INTO `sbtest1` VALUES (31351,1007187,'23938390896-69688180281-37975364313-05234865797-89299459691-74476188805-03642252162-40036598389-45190639324-97494758464','60596247401-06173974673-08009930825-94560626453-54686757363'),This means that our row range (up to row with id of 23145) is close. Next, it’s all about manual cleaning of the file. We want it to start with the first row we need to restore:
INSERT INTO `sbtest1` VALUES (1,1006036,'18034632456-32298647298-82351096178-60420120042-90070228681-93395382793-96740777141-18710455882-88896678134-41810932745','43683718329-48150560094-43449649167-51455516141-06448225399')And end up with the last row to restore:
(23145,1001595,'37250617862-83193638873-99290491872-89366212365-12327992016-32030298805-08821519929-92162259650-88126148247-75122945670','60801103752-29862888956-47063830789-71811451101-27773551230');We had to trim some of the unneeded data (it is multiline insert) but after all of this we have a file which we can load back on the master.
root@vagrant:~/restore# cat 1.sql | mysql -usbtest -psbtest -h10.0.0.101 sbtest
mysql: [Warning] Using a password on the command line interface can be insecure.
Finally, last check:
mysql> SELECT COUNT(*) FROM sbtest.sbtest1 WHERE id < 23146;
+----------+
| COUNT(*) |
+----------+
|    23145 |
+----------+
1 row in set (0.00 sec)
All is good, data has been restored.
Partial Data Loss, Delayed Slave
In this case, we will not go through the whole process. We already described how to identify the position of a data loss event in the binary logs. We also described how to stop a delayed slave and start the replication again, up to a point before the data loss event. We also explained how to use SELECT INTO OUTFILE and LOAD DATA INFILE to export data from external server and load it on the master. That’s all you need. As long as the data is still on the delayed slave, you have to stop it. Then you need to locate the position before the data loss event, start the slave up to that point and, once this is done, use the delayed slave to extract data which was deleted, copy the file to master and load it to restore the data.
Conclusion
Restoring lost data is not fun, but if you follow the steps we went through in this blog, you will have a good chance of recovering what you lost.