Quantcast
Channel: Severalnines - Galera Cluster
Viewing all 210 articles
Browse latest View live

MySQL on Docker: Swarm Mode Limitations for Galera Cluster in Production Setups

$
0
0

In the last couple of blog posts on Docker, we have looked into understanding and running Galera Cluster on Docker Swarm. It scales and fails over pretty well, but there are still some limitations that prevent it from running smoothly in a production environment. We will be discussing about these limitations, and see how we can overcome them. Hopefully, this will clear some of the questions that might be circling around in your head.

Docker Swarm Mode Limitations

Docker Swarm Mode is tremendous at orchestrating and handling stateless applications. However, since our focus is on trying to make Galera Cluster (a stateful service) to run smoothly on Docker Swarm, we have to make some adaptations to bring the two together. Running Galera Cluster in containers in production requires at least:

  • Health check - Each of the stateful containers must pass the Docker health checks, to ensure it achieves the correct state before being included into the active load balancing set.
  • Data persistency - Whenever a container is replaced, it has to be started from the last known good configuration. Else you might lose data.
  • Load balancing algorithm - Since Galera Cluster can handle read/write simultaneously, each node can be treated equally. A recommended balancing algorithm for Galera Cluster is least connection. This algorithm takes into consideration the number of current connections each server has. When a client attempts to connect, the load balancer will try to determine which server has the least number of connections and then assign the new connection to that server.

We are going to discuss all the points mentioned above with a great detail, plus possible workarounds on how to tackle those problems.

Health Check

HEALTHCHECK is a command to tell Docker how to test a container, to check that it is still working. In Galera, the fact that mysqld is running does not mean it is healthy and ready to serve. Without a proper health check, Galera could be wrongly diagnosed when something goes wrong, and by default, Docker Swarm’s ingress network will include the “STARTED” container into the load balancing set regardless of the Galera state. On the other hand, you have to manually attach to a MySQL container to check for various MySQL statuses to determine if the container is healthy.

With HEALTHCHECK configured, container healthiness can be retrieved directly from the standard “docker ps” command:

$ docker ps
CONTAINER ID        IMAGE                       COMMAND             CREATED             STATUS                    PORTS
42f98c8e0934        severalnines/mariadb:10.1   "/entrypoint.sh "   13 minutes ago      Up 13 minutes (healthy)   3306/tcp, 4567-4568/tcp

Plus, Docker Swarm’s ingress network will include only the healthy container right after the health check output starts to return 0 after startup. The following table shows the comparison of these two behaviours:

OptionsSample outputDescription
Without HEALTHCHECKHostname: db_mariadb_galera.2
Hostname: db_mariadb_galera.3
Hostname: ERROR 2003 (HY000): Can't connect to MySQL server on '192.168.1.100' (111)
Hostname: db_mariadb_galera.1
Hostname: db_mariadb_galera.2
Hostname: db_mariadb_galera.3
Hostname: ERROR 2003 (HY000): Can't connect to MySQL server on '192.168.1.100' (111)
Hostname: db_mariadb_galera.1
Hostname: db_mariadb_galera.2
Hostname: db_mariadb_galera.3
Hostname: db_mariadb_galera.4
Hostname: db_mariadb_galera.1
Applications will see an error because container db_mariadb_galera.4 is introduced incorrectly into the load balancing set. Without HEALTHCHECK, the STARTED container will be part of the “active” tasks in the service.
With HEALTHCHECKHostname: db_mariadb_galera.1
Hostname: db_mariadb_galera.2
Hostname: db_mariadb_galera.3
Hostname: db_mariadb_galera.1
Hostname: db_mariadb_galera.2
Hostname: db_mariadb_galera.3
Hostname: db_mariadb_galera.4
Hostname: db_mariadb_galera.1
Hostname: db_mariadb_galera.2
Container db_mariadb_galera.4 is introduced correctly into the load balancing set. With proper HEALTHCHECK, the new container will be part of the “active” tasks in the service if it’s marked as healthy.

The only problem with Docker health check is it only supports two exit codes - either 1 (unhealthy) or 0 (healthy). This is enough for a stateless application, where containers can come and go without caring much about the state itself and other containers. With a stateful service like Galera Cluster or MySQL Replication, another exit code is required to represent a staging phase. For example, when a joiner node comes into the picture, syncing is required from a donor node (by SST or IST). This process is automatically started by Galera and probably requires minutes or hours to complete, and the current workaround for this is to configure [--update-delay] and [--health-interval * --health-retires] to higher than the SST/IST time.

For a clearer perspective, consider the following “service create” command example:

$ docker service create \
--replicas=3 \
--health-interval=30s \
--health-retries=20 \
--update-delay=600s \
--name=galera \
--network=galera_net \
severalnines/mariadb:10.1

The container will be destroyed if the SST process has taken more than 600 seconds. While in this state, the health check script will return “exit 1 (unhealthy)” in both joiner and donor containers because both are not supposed to be included by Docker Swarm’s load balancer since they are in syncing stage. After failures for 20 consecutive times at every 30 seconds (equal to 600 seconds), the joiner and donor containers will be removed by Docker Swarm and will be replaced by new containers.

It would be perfect if Docker’s HEALTHCHECK could accept more than exit "0" or "1" to signal Swarm’s load balancer. For example:

  • exit 0 => healthy => load balanced and running
  • exit 1 => unhealthy => no balancing and failed
  • exit 2 => unhealthy but ignore => no balancing but running

Thus, we don’t have to determine SST time for containers to survive the Galera Cluster startup operation, because:

  • Joiner/Joined/Donor/Desynced == exit 2
  • Synced == exit 0
  • Others == exit 1

Another workaround apart setting up [--update-delay] and [--health-interval * --health-retires] to be higher than SST time is you could use HAProxy as the load balancer endpoints, instead of relying on Docker Swarm’s load balancer. More discussion further on.

Data Persistency

Stateless doesn’t really care about persistency. It shows up, serves and get destroyed if the job is done or it is unhealthy. The problem with this behaviour is there is a chance of a total data loss in Galera Cluster, which is something that cannot be afforded by a database service. Take a look at the following example:

$ docker service create \
--replicas=3 \
--health-interval=30s \
--health-retries=20 \
--update-delay=600s \
--name=galera \
--network=galera_net \
severalnines/mariadb:10.1

So, what happens if the switch connecting the three Docker Swarm nodes goes down? A network partition, which will split a three-node Galera Cluster into 'single-node' components. The cluster state will get demoted into Non-Primary and the Galera node state will turn to Initialized. This situation turns the containers into an unhealthy state according to the health check. After a period 600 seconds if the network is still down, those database containers will be destroyed and replaced with new containers by Docker Swarm according to the "docker service create" command. You will end up having a new cluster starting from scratch, and the existing data is removed.

There is a workaround to protect from this, by using mode global with placement constraints. This is the preferred way when you are running your database containers on Docker Swarm with persistent storage in mind. Consider the following example:

$ docker service create \
--mode=global \
--constraints='node.labels.type == galera' \
--health-interval=30s \
--health-retries=20 \
--update-delay=600s \
--name=galera \
--network=galera_net \
severalnines/mariadb:10.1

The cluster size is limited to the number of available Docker Swarm node labelled with "type=galera". Dynamic scaling is not an option here. Scaling up or down is only possible if you introduce or remove a Swarm node with the correct label. The following diagram shows a 3-node Galera Cluster container with persistent volumes, constrained by custom node label "type=galera":

It would also be great if Docker Swarm supported more options to handle container failures:

  • Don’t delete the last X failed containers, for troubleshooting purposes.
  • Don’t delete the last X volumes, for recovery purposes.
  • Notify users if a container is recreated, deleted, rescheduled.

Load Balancing Algorithm

Docker Swarm comes with a load balancer, based on IPVS module in Linux kernel, to distribute traffic to all containers in round-robin fashion. It lacks several useful configurable options to handle routing of stateful applications, for example persistent connection (so source will always reach the same destination) and support for other balancing algorithm, like least connection, weighted round-robin or random. Despite IPVS being capable of handling persistent connections via option "-p", it doesn’t seem to be configurable in Docker Swarm.

In MySQL, some connections might take a bit longer time to process before it returns the output back to the clients. Thus, Galera Cluster load distribution should use "least connection" algorithm, so the load is equally distributed to all database containers. The load balancer would ideally monitor the number of open connections for each server, and sends to the least busy server. Kubernetes defaults to least connection when distributing traffic to the backend containers.

As a workaround, relying on other load balancers in front of the service is still the recommended way. HAProxy, ProxySQL and MaxScale excel in this area. However, you have to make sure these load balancers are aware of the dynamic changes of the backend database containers especially during scaling and failover.

Summary

Galera Cluster on Docker Swarm fits well in development, test and staging environments, but it needs some more work when running in production. The technology still needs some time to mature, but as we saw in this blog, there are ways to work around the current limitations.


Using the Galera Replication Window advisor to avoid SST

$
0
0

Galera clustering replicates data between nodes synchronously. This way, all nodes in the cluster ensure data is consistent between each other. But what happens if one of those nodes leaves the cluster for a short period of time? This could happen for instance if you are taking a node down for maintenance, have a power outage in one rack or if network partitioning happens.

Galera provides a mechanism for this: once the node joins the cluster it will request an Incremental State Transfer (IST) from the cluster. This IST contains all transactions that were executed during the time the node wasn’t part of the cluster. If the node was away for too long, the IST will not contain all necessary transactions and the node will request a State Snapshot Transfer (SST). A SST is basically a full synchronization of the dataset of one of the nodes in the cluster. In ClusterControl, we configure the SST to be provided by Xtrabackup, but you could also use mysqldump or rsync as method.

During the SST the joining node will be unavailable for queries. Naturally the larger your dataset, the longer it takes to send the SST from one node to another. This means your cluster will not be in sync for a longer period of time, so avoiding the SST is one of the most important things in a Galera cluster!

Galera gcache and the Replication Window

The IST is provided by entries in the Galera gcache. The gcache is a circular buffer file (ringbuffer) acting as a temporary storage for all transactions executed on the Galera node. Once the ringbuffer is full, Galera will evict the oldest transactions from this file. The time between the first and last entry in the gcache can be referred to as the replication window. Also transactions that are too large to store in the file will be stored in a separate file on disk.

You can configure the size of the gcache using the gcache.size directive inside the wsrep_provider_options, and this is set to 128MB by default. You can read our Galera gcache blog post if you wish to know more about it and how to configure it. You can also read our blog post about determining the optimal size for the gcache setting.

If you are familiar with the MongoDB, you may have noticed a similarity between the Galera gcache and the MongoDB oplog. Similar to the gcache, the oplog is a circular buffer that contains all transactions executed on the master. There is a major difference though: in contrary to the persistence of the oplog, the gcache file will be removed and recreated everytime MySQL starts. Also the oplog facilitates a method of determining the replication window, while gcache does not.

ClusterControl advisor for Galera replication window

With this blog post we want to bring to your attention our new Galera replication window advisor. This advisor, which we created in the developer studio, will constantly analyze your write workload and determine if the Galera gcache is still sufficient to sustain a desired replication window. We can only make an estimation of the replication window, as the gcache file does not give us information of the actual contents of the gcache file.

Instead of this we calculate the write rate per second of Galera in short and long term:

write_rate = (received_bytes + replicated_bytes) / time;

With the write rate per second, we can calculate how much storage we would need to satisfy a certain replication window. If the current write rate does not sustain the desired replication window, we can now preemptively warn the user.

Conclusion

In the past, someone determined the gcache size of their Galera cluster. Even though this gcache size might have been valid when the cluster was initially deployed, this may not be valid anymore for their current write workload. With this new advisor, we can give our users the benefit of continuously reviewing their gcache size.

You can download our new advisor directly from our advisors repository on Github, or wait for it to be included in the next version of ClusterControl. Let us know if you would like any assistance on how to write these advisors using our developer studio, we’d be happy to help!

MySQL on Docker: Running Galera Cluster on Kubernetes

$
0
0

In the last couple of blogs, we covered how to run a Galera Cluster on Docker, whether on standalone Docker or on multi-host Docker Swarm with overlay network. In this blog post, we’ll look into running Galera Cluster on Kubernetes, an orchestration tool to run containers at scale. Some parts are different, such as how the application should connect to the cluster, how Kubernetes handles failover and how the load balancing works in Kubernetes.

Kubernetes vs Docker Swarm

Our ultimate target is to ensure Galera Cluster runs reliably in a container environment. We previously covered Docker Swarm, and it turned out that running Galera Cluster on it has a number of blockers, which prevent it from being production ready. Our journey now continues with Kubernetes, a production-grade container orchestration tool. Let’s see which level of “production-readiness” it can support when running a stateful service like Galera Cluster.

Before we move further, let us highlight some of key differences between Kubernetes (1.6) and Docker Swarm (17.03) when running Galera Cluster on containers:

  • Kubernetes supports two health check probes - liveness and readiness. This is important when running a Galera Cluster on containers, because a live Galera container does not mean it is ready to serve and should be included in the load balancing set (think of a joiner/donor state). Docker Swarm only supports one health check probe similar to Kubernetes’ liveness, a container is either healthy and keeps running or unhealthy and gets rescheduled. Read here for details.
  • Kubernetes has a UI dashboard accessible via “kubectl proxy”.
  • Docker Swarm only supports round-robin load balancing (ingress), while Kubernetes uses least connection.
  • Docker Swarm supports routing mesh to publish a service to the external network, while Kubernetes supports something similar called NodePort, as well as external load balancers (GCE GLB/AWS ELB) and external DNS names (as for v1.7)

Installing Kubernetes using kubeadm

We are going to use kubeadm to install a 3-node Kubernetes cluster on CentOS 7. It consists of 1 master and 2 nodes (minions). Our physical architecture looks like this:

1. Install kubelet and Docker on all nodes:

$ ARCH=x86_64
cat <<EOF > /etc/yum.repos.d/kubernetes.repo
[kubernetes]
name=Kubernetes
baseurl=https://packages.cloud.google.com/yum/repos/kubernetes-el7-${ARCH}
enabled=1
gpgcheck=1
repo_gpgcheck=1
gpgkey=https://packages.cloud.google.com/yum/doc/yum-key.gpg
        https://packages.cloud.google.com/yum/doc/rpm-package-key.gpg
EOF
$ setenforce 0
$ yum install -y docker kubelet kubeadm kubectl kubernetes-cni
$ systemctl enable docker && systemctl start docker
$ systemctl enable kubelet && systemctl start kubelet

2. On the master, initialize the master, copy the configuration file, setup the Pod network using Weave and install Kubernetes Dashboard:

$ kubeadm init
$ cp /etc/kubernetes/admin.conf $HOME/
$ export KUBECONFIG=$HOME/admin.conf
$ kubectl apply -f https://git.io/weave-kube-1.6
$ kubectl create -f https://git.io/kube-dashboard

3. Then on the other remaining nodes:

$ kubeadm join --token 091d2a.e4862a6224454fd6 192.168.55.140:6443

4. Verify the nodes are ready:

$ kubectl get nodes
NAME          STATUS    AGE       VERSION
kube1.local   Ready     1h        v1.6.3
kube2.local   Ready     1h        v1.6.3
kube3.local   Ready     1h        v1.6.3

We now have a Kubernetes cluster for Galera Cluster deployment.

Galera Cluster on Kubernetes

In this example, we are going to deploy a MariaDB Galera Cluster 10.1 using Docker image pulled from our DockerHub repository. The YAML definition files used in this deployment can be found under example-kubernetes directory in the Github repository.

Kubernetes supports a number of deployment controllers. To deploy a Galera Cluster, one can use:

  • ReplicaSet
  • StatefulSet

Each of them has their own pro and cons. We are going to look into each one of them and see what’s the difference.

Prerequisites

The image that we built requires an etcd (standalone or cluster) for service discovery. To run an etcd cluster requires each etcd instance to be running with different commands so we are going to use Pods controller instead of Deployment and create a service called “etcd-client” as endpoint to etcd Pods. The etcd-cluster.yaml definition file tells it all.

To deploy a 3-pod etcd cluster, simply run:

$ kubectl create -f etcd-cluster.yaml

Verify if the etcd cluster is ready:

$ kubectl get po,svc
NAME                        READY     STATUS    RESTARTS   AGE
po/etcd0                    1/1       Running   0          1d
po/etcd1                    1/1       Running   0          1d
po/etcd2                    1/1       Running   0          1d

NAME              CLUSTER-IP       EXTERNAL-IP   PORT(S)             AGE
svc/etcd-client   10.104.244.200   <none>        2379/TCP            1d
svc/etcd0         10.100.24.171    <none>        2379/TCP,2380/TCP   1d
svc/etcd1         10.108.207.7     <none>        2379/TCP,2380/TCP   1d
svc/etcd2         10.101.9.115     <none>        2379/TCP,2380/TCP   1d

Our architecture is now looking something like this:

Using ReplicaSet

A ReplicaSet ensures that a specified number of pod “replicas” are running at any given time. However, a Deployment is a higher-level concept that manages ReplicaSets and provides declarative updates to pods along with a lot of other useful features. Therefore, it’s recommended to use Deployments instead of directly using ReplicaSets, unless you require custom update orchestration or don’t require updates at all. When you use Deployments, you don’t have to worry about managing the ReplicaSets that they create. Deployments own and manage their ReplicaSets.

In our case, we are going to use Deployment as the workload controller, as shown in this YAML definition. We can directly create the Galera Cluster ReplicaSet and Service by running the following command:

$ kubectl create -f mariadb-rs.yml

Verify if the cluster is ready by looking at the ReplicaSet (rs), pods (po) and services (svc):

$ kubectl get rs,po,svc
NAME                  DESIRED   CURRENT   READY     AGE
rs/galera-251551564   3         3         3         5h

NAME                        READY     STATUS    RESTARTS   AGE
po/etcd0                    1/1       Running   0          1d
po/etcd1                    1/1       Running   0          1d
po/etcd2                    1/1       Running   0          1d
po/galera-251551564-8c238   1/1       Running   0          5h
po/galera-251551564-swjjl   1/1       Running   1          5h
po/galera-251551564-z4sgx   1/1       Running   1          5h

NAME              CLUSTER-IP       EXTERNAL-IP   PORT(S)             AGE
svc/etcd-client   10.104.244.200   <none>        2379/TCP            1d
svc/etcd0         10.100.24.171    <none>        2379/TCP,2380/TCP   1d
svc/etcd1         10.108.207.7     <none>        2379/TCP,2380/TCP   1d
svc/etcd2         10.101.9.115     <none>        2379/TCP,2380/TCP   1d
svc/galera-rs     10.107.89.109    <nodes>       3306:30000/TCP      5h
svc/kubernetes    10.96.0.1        <none>        443/TCP             1d

From the output above, we can illustrate our Pods and Service as below:

Running Galera Cluster on ReplicaSet is similar to treating it as a stateless application. It orchestrates pod creation, deletion and updates and can be targeted for Horizontal Pod Autoscales (HPA), i.e. a ReplicaSet can be auto-scaled if it meets certain thresholds or targets (CPU usage, packets-per-second, request-per-second etc).

If one of the Kubernetes nodes goes down, new Pods will be scheduled on an available node to meet the desired replicas. Volumes associated with the Pod will be deleted, if the Pod is deleted or rescheduled. The Pod hostname will be randomly generated, making it harder to track where the container belongs by simply looking at the hostname.

All this works pretty well in test and staging environments, where you can perform a full container lifecycle like deploy, scale, update and destroy without any dependencies. Scaling up and down is straightforward, by updating the YAML file and posting it to Kubernetes cluster or by using the scale command:

$ kubectl scale replicaset galera-rs --replicas=5

Using StatefulSet

Known as PetSet on pre 1.6 version, StatefulSet is the best way to deploy Galera Cluster in production, because:

  • Deleting and/or scaling down a StatefulSet will not delete the volumes associated with the StatefulSet. This is done to ensure data safety, which is generally more valuable than an automatic purge of all related StatefulSet resources.
  • For a StatefulSet with N replicas, when Pods are being deployed, they are created sequentially, in order from {0 .. N-1}.
  • When Pods are being deleted, they are terminated in reverse order, from {N-1 .. 0}.
  • Before a scaling operation is applied to a Pod, all of its predecessors must be Running and Ready.
  • Before a Pod is terminated, all of its successors must be completely shut down.

StatefulSet provides first-class support for stateful containers. It provides a deployment and scaling guarantee. When a three-node Galera Cluster is created, three Pods will be deployed in the order db-0, db-1, db-2. db-1 will not be deployed before db-0 is “Running and Ready”, and db-2 will not be deployed until db-1 is “Running and Ready”. If db-0 should fail, after db-1 is “Running and Ready”, but before db-2 is launched, db-2 will not be launched until db-0 is successfully relaunched and becomes “Running and Ready”.

We are going to use Kubernetes implementation of persistent storage called PersistentVolume and PersistentVolumeClaim. This to ensure data persistency if the pod got rescheduled to the other node. Even though Galera Cluster provides the exact copy of data on each replica, having the data persistent in every pod is good for troubleshooting and recovery purposes.

To create a persistent storage, first we have to create PersistentVolume for every pod. PVs are volume plugins like Volumes in Docker, but have a lifecycle independent of any individual pod that uses the PV. Since we are going to deploy a 3-node Galera Cluster, we need to create 3 PVs:

apiVersion: v1
kind: PersistentVolume
metadata:
  name: datadir-galera-0
  labels:
    app: galera-ss
    podindex: "0"
spec:
  accessModes:
  - ReadWriteOnce
  capacity:
    storage: 10Gi
  hostPath:
    path: /data/pods/galera-0/datadir
---
apiVersion: v1
kind: PersistentVolume
metadata:
  name: datadir-galera-1
  labels:
    app: galera-ss
    podindex: "1"
spec:
  accessModes:
  - ReadWriteOnce
  capacity:
    storage: 10Gi
  hostPath:
    path: /data/pods/galera-1/datadir
---
apiVersion: v1
kind: PersistentVolume
metadata:
  name: datadir-galera-2
  labels:
    app: galera-ss
    podindex: "2"
spec:
  accessModes:
  - ReadWriteOnce
  capacity:
    storage: 10Gi
  hostPath:
    path: /data/pods/galera-2/datadir

The above definition shows we are going to create 3 PV, mapped to the Kubernetes nodes’ physical path with 10GB of storage space. We defined ReadWriteOnce, which means the volume can be mounted as read-write by only a single node. Save the above lines into mariadb-pv.yml and post it to Kubernetes:

$ kubectl create -f mariadb-pv.yml
persistentvolume "datadir-galera-0" created
persistentvolume "datadir-galera-1" created
persistentvolume "datadir-galera-2" created

Next, create define the PersistentVolumeClaim:

kind: PersistentVolumeClaim
apiVersion: v1
metadata:
  name: mysql-datadir-galera-ss-0
spec:
  accessModes:
    - ReadWriteOnce
  resources:
    requests:
      storage: 10Gi
  selector:
    matchLabels:
      app: galera-ss
      podindex: "0"
---
kind: PersistentVolumeClaim
apiVersion: v1
metadata:
  name: mysql-datadir-galera-ss-1
spec:
  accessModes:
    - ReadWriteOnce
  resources:
    requests:
      storage: 10Gi
  selector:
    matchLabels:
      app: galera-ss
      podindex: "1"
---
kind: PersistentVolumeClaim
apiVersion: v1
metadata:
  name: mysql-datadir-galera-ss-2
spec:
  accessModes:
    - ReadWriteOnce
  resources:
    requests:
      storage: 10Gi
  selector:
    matchLabels:
      app: galera-ss
      podindex: "2"

The above definition shows that we would like to claim the PV resources and use the spec.selector.matchLabels to look for our PV (metadata.labels.app: galera-ss) based on the respective pod index (metadata.labels.podindex) assigned by Kubernetes. The metadata.name resource must use the format “{volumeMounts.name}-{pod}-{ordinal index}” defined under the spec.templates.containers so Kubernetes knows which mount point to map the claim into the pod.

Save the above lines into mariadb-pvc.yml and post it to Kubernetes:

$ kubectl create -f mariadb-pvc.yml
persistentvolumeclaim "mysql-datadir-galera-ss-0" created
persistentvolumeclaim "mysql-datadir-galera-ss-1" created
persistentvolumeclaim "mysql-datadir-galera-ss-2" created

Our persistent storage is now ready. We can then start the Galera Cluster deployment by creating a StatefulSet resource together with Headless service resource as shown in mariadb-ss.yml:

$ kubectl create -f mariadb-ss.yml
service "galera-ss" created
statefulset "galera-ss" created

Now, retrieve the summary of our StatefulSet deployment:

$ kubectl get statefulsets,po,pv,pvc -o wide
NAME                     DESIRED   CURRENT   AGE
statefulsets/galera-ss   3         3         1d        galera    severalnines/mariadb:10.1   app=galera-ss

NAME                        READY     STATUS    RESTARTS   AGE       IP          NODE
po/etcd0                    1/1       Running   0          7d        10.36.0.1   kube3.local
po/etcd1                    1/1       Running   0          7d        10.44.0.2   kube2.local
po/etcd2                    1/1       Running   0          7d        10.36.0.2   kube3.local
po/galera-ss-0              1/1       Running   0          1d        10.44.0.4   kube2.local
po/galera-ss-1              1/1       Running   1          1d        10.36.0.5   kube3.local
po/galera-ss-2              1/1       Running   0          1d        10.44.0.5   kube2.local

NAME                  CAPACITY   ACCESSMODES   RECLAIMPOLICY   STATUS    CLAIM                               STORAGECLASS   REASON    AGE
pv/datadir-galera-0   10Gi       RWO           Retain          Bound     default/mysql-datadir-galera-ss-0                            4d
pv/datadir-galera-1   10Gi       RWO           Retain          Bound     default/mysql-datadir-galera-ss-1                            4d
pv/datadir-galera-2   10Gi       RWO           Retain          Bound     default/mysql-datadir-galera-ss-2                            4d

NAME                            STATUS    VOLUME             CAPACITY   ACCESSMODES   STORAGECLASS   AGE
pvc/mysql-datadir-galera-ss-0   Bound     datadir-galera-0   10Gi       RWO                          4d
pvc/mysql-datadir-galera-ss-1   Bound     datadir-galera-1   10Gi       RWO                          4d
pvc/mysql-datadir-galera-ss-2   Bound     datadir-galera-2   10Gi       RWO                          4d

At this point, our Galera Cluster running on StatefulSet can be illustrated as in the following diagram:

Running on StatefuleSet guarantees consistent identifiers like hostname, IP address, network ID, cluster domain, Pod DNS and storage. This allows the Pod to easily distinguish itself from others in a group of Pods. The volume will be retained on the host and will not get deleted if the Pod is deleted or rescheduled onto another node. This allows for data recovery and reduces the risk of total data loss.

On the negative side, the deployment time will be N-1 times (N = replicas) longer because Kubernetes will obey the ordinal sequence when deploying, rescheduling or deleting the resources. It would be a bit of a hassle to prepare the PV and claims before thinking about scaling your cluster. Take note that updating an existing StatefulSet is currently a manual process, where you can only update spec.replicas at the moment.

Connecting to Galera Cluster Service and Pods

There are a couple of ways you can connect to the database cluster. You can connect directly to the port. In the “galera-rs” service example, we use NodePort, exposing the service on each Node’s IP at a static port (the NodePort). A ClusterIP service, to which the NodePort service will route, is automatically created. You’ll be able to contact the NodePort service, from outside the cluster, by requesting {NodeIP}:{NodePort}.

Example to connect to the Galera Cluster externally:

(external)$ mysql -udb_user -ppassword -h192.168.55.141 -P30000
(external)$ mysql -udb_user -ppassword -h192.168.55.142 -P30000
(external)$ mysql -udb_user -ppassword -h192.168.55.143 -P30000

Within the Kubernetes network space, Pods can connect via cluster IP or service name internally which is retrievable by using the following command:

$ kubectl get services -o wide
NAME          CLUSTER-IP       EXTERNAL-IP   PORT(S)             AGE       SELECTOR
etcd-client   10.104.244.200   <none>        2379/TCP            1d        app=etcd
etcd0         10.100.24.171    <none>        2379/TCP,2380/TCP   1d        etcd_node=etcd0
etcd1         10.108.207.7     <none>        2379/TCP,2380/TCP   1d        etcd_node=etcd1
etcd2         10.101.9.115     <none>        2379/TCP,2380/TCP   1d        etcd_node=etcd2
galera-rs     10.107.89.109    <nodes>       3306:30000/TCP      4h        app=galera-rs
galera-ss     None             <none>        3306/TCP            3m        app=galera-ss
kubernetes    10.96.0.1        <none>        443/TCP             1d        <none>

From the service list, we can see that the Galera Cluster ReplicaSet Cluster-IP is 10.107.89.109. Internally, another pod can access the database through this IP address or service name using the exposed port, 3306:

(etcd0 pod)$ mysql -udb_user -ppassword -hgalera-rs -P3306 -e 'select @@hostname'
+------------------------+
| @@hostname             |
+------------------------+
| galera-251551564-z4sgx |
+------------------------+

Internally, you can also connect to the external NodePort from inside the pod on port 30000:

(etcd0 pod)$ mysql -udb_user -ppassword -h192.168.55.143 -P30000 -e 'select @@hostname'
+------------------------+
| @@hostname             |
+------------------------+
| galera-251551564-z4sgx |
+------------------------+

Connection to the backend Pods will be load balanced accordingly using least connection.

Summary

At this point, running Galera Cluster on Kubernetes in production seems much more promising as compared to Docker Swarm. As discussed in the last blog post, the concerns raised are tackled differently with the way Kubernetes orchestrates containers in StatefulSet, (although it’s still a beta feature in v1.6). We do hope that the suggested approach is going to help run Galera Cluster on containers at scale in production.

Docker: All the Severalnines Resources

$
0
0

While the idea of containers have been around since the early days of Unix, Docker made waves in 2013 when it hit the market with its innovative solution. What began as an open source project, Docker allows you to add your stacks and applications to containers where they share a common operating system kernel. This lets you have a lightweight virtualized system with almost zero overhead. Docker also lets you bring up or down containers in seconds, making for rapid deployment of your stack.

Severalnines, like many other companies, got excited early on about Docker and began experimenting and developing ways to deploy advanced open source database configurations using Docker containers. We also released, early on, a docker image of ClusterControl that lets you utilize the management and monitoring functionalities of ClusterControl with your existing database deployments.

Here are just some of the great resources we’ve developed for Docker over the last few years...

Severalnines on Docker Hub

In addition to the ClusterControl Docker Image, we have also provided a series of images to help you get started on Docker with other open source database technologies like Percona XtraDB Cluster and MariaDB.

Check Out the Docker Images

ClusterControl on Docker Documentation

For detailed instructions on how to install ClusterControl utilizing the Docker Image click on the link below.

Read More

Top Blogs

MySQL on Docker: Running Galera Cluster on Kubernetes

In our previous posts, we showed how one can run Galera Cluster on Docker Swarm, and discussed some of the limitations with regards to production environments. Kubernetes is widely used as orchestration tool, and we’ll see whether we can leverage it to achieve production-grade Galera Cluster on Docker.

Read More

MySQL on Docker: Swarm Mode Limitations for Galera Cluster in Production Setups

This blog post explains some of the Docker Swarm Mode limitations in handling Galera Cluster natively in production environments.

Read More

MySQL on Docker: Composing the Stack

Docker 1.13 introduces a long-awaited feature called Compose-file support. Compose-file defines everything about an application - services, databases, volumes, networks, and dependencies can all be defined in one place. In this blog, we’ll show you how to use Compose-file to simplify the Docker deployment of MySQL containers.

Read More

MySQL on Docker: Deploy a Homogeneous Galera Cluster with etcd

Our journey to make Galera Cluster run smoothly on Docker containers continues. Deploying Galera Cluster on Docker is tricky when using orchestration tools. With this blog, find out how to deploy a homogeneous Galera Cluster with etcd.

Read More

MySQL on Docker: Introduction to Docker Swarm Mode and Multi-Host Networking

This blog post covers the basics of managing MySQL containers on top of Docker swarm mode and overlay network.

Read More

MySQL on Docker: Single Host Networking for MySQL Containers

This blog covers the basics of how Docker handles single-host networking, and how MySQL containers can leverage that.

Read More

MySQL on Docker: Building the Container Image

In this post, we will show you two ways how to build a MySQL Docker image - changing a base image and committing, or using Dockerfile. We’ll show you how to extend the Docker team’s MySQL image, and add Percona XtraBackup to it.

Read More

MySQL Docker Containers: Understanding the basics

In this post, we will cover some basics around running MySQL in a Docker container. It walks you through how to properly fire up a MySQL container, change configuration parameters, how to connect to the container, and how the data is stored.

Read More

ClusterControl
Single Console for Your Entire Database Infrastructure
Find out what else is new in ClusterControl

ClusterControl on Docker

ClusterControl provides advanced management and monitoring functionality to get your MySQL replication and clustered instances up-and-running using proven methodologies that you can depend on to work. Used in conjunction with other orchestration tools for deployment to the containers, ClusterControl makes managing your open source databases easy with point-and-click interfaces and no need to have specialized knowledge about the technology.

ClusterControl delivers on an array of features to help manage and monitor your open source database environments:

  • Management & Monitoring: ClusterControl provides management features to repair and recover broken nodes, as well as test and automate MySQL upgrades.
  • Advanced Monitoring: ClusterControl provides a unified view of all MySQL nodes and clusters across all your data centers and lets you drill down into individual nodes for more detailed statistics.
  • Automatic Failure Detection and Handling: ClusterControl takes care of your replication cluster’s health. If a master failure is detected, ClusterControl automatically promotes one of the available slaves to ensure your cluster is always up.

Learn more about how ClusterControl can enhance performance here or pull the Docker Image here.

We hope that these resources prove useful!

Happy Clustering!

MySQL on Docker: Running Galera Cluster in Production with ClusterControl on Kubernetes

$
0
0

In our “MySQL on Docker” blog series, we continue our quest to make Galera Cluster run smoothly in different container environments. One of the most important things when running a database service, whether in containers or bare-metal, is to eliminate the risk of data loss. We will see how we can leverage a promising feature in Kubernetes called StatefulSet, which orchestrates container deployment in a more predictable and controllable fashion.

In our previous blog post, we showed how one can deploy a Galera Cluster within Docker with the help of Kubernetes as orchestration tool. However, it is only about deployment. Running a database in production requires more than just deployment - we need to think about monitoring, backups, upgrades, recovery from failures, topology changes and so on. This is where ClusterControl comes into the picture, as it completes the stack and makes it production ready. In simple words, Kubernetes takes care of database deployment and scaling while ClusterControl fills in the missing components including configuration, monitoring and ongoing management.

ClusterControl on Docker

This blog post describes how ClusterControl runs in a Docker environment. The Docker image has been updated, and now comes with the standard ClusterControl packages in the latest stable branch with additional support for container orchestration platforms like Docker Swarm and Kubernetes, we’ll describe this further below. You can also use the image to deploy a database cluster on a standalone Docker host.

Details at the Github repository or Docker Hub page.

ClusterControl on Kubernetes

The updated Docker image now supports automatic deployment of database containers scheduled by Kubernetes. The steps are similar to the Docker Swarm implementation, where the user decides the specs of the database cluster and ClusterControl automates the actual deployment.

ClusterControl can be deployed as ReplicaSet or StatefulSet. Since it’s a single instance, either way works. The only significant difference is the container identification would be easier with StatefulSet, since it provides consistent identifiers like the container hostname, IP address, DNS and storage. ClusterControl also provides service discovery for the new cluster deployment.

To deploy ClusterControl on Kubernetes, the following setup is recommended:

  • Use centralized persistent volumes supported by Kubernetes plugins (e.g. NFS, iSCSI) for the following paths:
    • /etc/cmon.d - ClusterControl configuration directory
    • /var/lib/mysql - ClusterControl cmon and dcps databases
  • Create 2 services for this pod:
    • One for internal communication between pods (expose port 80 and 3306)
    • One for external communication to outside world (expose port 80, 443 using NodePort or LoadBalancer)

In this example, we are going to use simple NFS. Make sure you have an NFS server ready. For the sake of simplicity, we are going to demonstrate this deployment on a 3-host Kubernetes cluster (1 master + 2 Kubernetes nodes). For production use, please use at least 3 Kubernetes nodes to minimize the risk of losing quorum.

With that in place, we can deploy the ClusterControl as something like this:

On the NFS server (kube1.local), install NFS server and client packages and export the following paths:

  • /storage/pods/cc/cmon.d - to be mapped with /etc/cmon.d
  • /storage/pods/cc/datadir - to be mapped with /var/lib/mysql

Ensure to restart NFS service to apply the changes. Then create PVs and PVCs, as shown in cc-pv-pvc.yml:

$ kubectl create -f cc-pv-pvc.yml

We are now ready to start a replica of the ClusterControl pod. Send cc-rs.yml to Kubernetes master:

$ kubectl create -f cc-rs.yml

ClusterControl is now accessible on port 30080 on any of the Kubernetes nodes, for example, http://kube1.local:30080/clustercontrol. With this approach (ReplicaSet + PV + PVC), the ClusterControl pod would survive if the physical host goes down. Kubernetes will automatically schedule the pod to the other available hosts and ClusterControl will be bootstrapped from the last existing dataset which is available through NFS.

Galera Cluster on Kubernetes

If you would like to use the ClusterControl automatic deployment feature, simply send the following YAML files to the Kubernetes master:

$ kubectl create -f cc-galera-pv-pvc.yml
$ kubectl create -f cc-galera-ss.yml

Details on the definition files can be found here - cc-galera-pv-pvc.yml and cc-galera-ss.yml.

The above commands tell Kubernetes to create 3 PVs, 3 PVCs and 3 pods running as StatefulSet using a generic base image called “centos-ssh”. In this example, the database cluster that we are going to deploy is MariaDB 10.1. Once the containers are started, they will register themselves to ClusterControl CMON database. ClusterControl will then pick up the containers’ hostname and start the deployment based on the variables that have been passed.

You can check the progress directly from the ClusterControl UI. Once the deployment has finished, our architecture will look something like this:

HAProxy as Load Balancer

Kubernetes comes with an internal load balancing capability via the Service component when distributing traffic to the backend pods. This is good enough if the balancing (least connections) fits your workload. In some cases, where your application needs to send queries to a single master due to deadlock or strict read-after-write semantics, you have to create another Kubernetes service with a proper selector to redirect the incoming connection to one and only one pod. If this single pod goes down, there is a chance of service interruption when Kubernetes schedules it again to another available node. What we are trying to highlight here is that if you’d want better control on what’s being sent to the backend Galera Cluster, something like HAProxy (or even ProxySQL) is pretty good at that.

You can deploy HAProxy as a two-pod ReplicaSet and use ClusterControl to deploy, configure and manage it. Simply post this YAML definition to Kubernetes:

$ kubectl create -f cc-haproxy-rs.yml

The above definition instructs Kubernetes to create a service called cc-haproxy and run two replicas of “severalnines/centos-ssh” image without automatic deployment (AUTO_DEPLOYMENT=0). These pods will then connect to the ClusterControl pod and perform automatic passwordless SSH setup. What you need to do now is to log into ClusterControl UI and start the deployment of HAProxy.

Firstly, retrieve the IP address of HAProxy pods:

$ kubectl describe pods -l app=cc-haproxy | grep IP
IP:        10.44.0.6
IP:        10.36.0.5

Then use the address as the HAProxy Address under ClusterControl -> choose the DB cluster -> Manage -> Load Balancer -> HAProxy -> Deploy HAProxy, as shown below:

**Repeat the above step for the second HAProxy instance.

Once done, our Galera Cluster can be accessible through the “cc-haproxy” service on port 3307 internally (within Kubernetes network space) or port 30016 externally (outside world). The connection will be load balanced between these HAProxy instances. At this point, our architecture can be illustrated as the following:

With this setup, you have maximum control of your load-balanced Galera Cluster running on Docker. Kubernetes brings something good to the table by supporting stateful service orchestration.

Do give it a try. We would love to hear how you get along.

Galera Cluster: All the Severalnines Resources

$
0
0

Galera Cluster is a true multi-master cluster solution for MySQL and MariaDB, based on synchronous replication. Galera Cluster is easy-to-use, provides high-availability, as well as scalability for certain workloads.

ClusterControl provides advanced deployment, management, monitoring, and scaling functionality to get your Galera clusters up-and-running using proven methodologies.

Here are just some of the great resources we’ve developed for Galera Cluster over the last few years...

Tutorials

Galera Cluster for MySQL

Galera allows applications to read and write from any MySQL Server. Galera enables synchronous replication for InnoDB, creating a true multi-master cluster of MySQL servers. Allows for synchronous replication between data centers. Our tutorial covers MySQL Galera concepts and explains how to deploy and manage a Galera cluster.

Read the Tutorial

Deploying a Galera Cluster for MySQL on Amazon VPC

This tutorial shows you how to deploy a multi-master synchronous Galera Cluster for MySQL with Amazon's Virtual Private Cloud (Amazon VPC) service.

Read the Tutorial

Training: Galera Cluster For System Administrators, DBAs And DevOps

The course is designed for system administrators & database administrators looking to gain more in depth expertise in the automation and management of Galera Clusters.

Book Your Seat

On-Demand Webinars

MySQL Tutorial - Backup Tips for MySQL, MariaDB & Galera Cluster

In this webinar, Krzysztof Książek, Senior Support Engineer at Severalnines, discusses backup strategies and best practices for MySQL, MariaDB and Galera clusters; including a live demo on how to do this with ClusterControl.

Watch the replay

9 DevOps Tips for Going in Production with Galera Cluster for MySQL / MariaDB

In this webinar replay, we guide you through 9 key tips to consider before taking Galera Cluster for MySQL / MariaDB into production.

Watch the replay

Deep Dive Into How To Monitor MySQL or MariaDB Galera Cluster / Percona XtraDB Cluster

Our colleague Krzysztof Książek provided a deep-dive session on what to monitor in Galera Cluster for MySQL & MariaDB. Krzysztof is a MySQL DBA with experience in managing complex database environments for companies like Zendesk, Chegg, Pinterest and Flipboard.

Watch the replay

Become a MySQL DBA - webinar series: Schema Changes for MySQL Replication & Galera Cluster

In this webinar, we discuss how to implement schema changes in the least impacting way to your operations and ensure availability of your database. We also cover some real-life examples and discuss how to handle them.

Watch the replay

Migrating to MySQL, MariaDB Galera and/or Percona XtraDB Cluster

In this webinar, we walk you through what you need to know in order to migrate from standalone or a master-slave MySQL / MariaDB setup to Galera Cluster.

Watch the replay

Introducing Galera 3.0

In this webinar you'll learn all about the new Galera Cluster capabilities in version 3.0.

Watch the replay

Top Blogs

MySQL on Docker: Running Galera Cluster on Kubernetes

In our previous posts, we showed how one can run Galera Cluster on Docker Swarm, and discussed some of the limitations with regards to production environments. Kubernetes is widely used as orchestration tool, and we’ll see whether we can leverage it to achieve production-grade Galera Cluster on Docker.

Read More

ClusterControl for Galera Cluster for MySQL

Galera Cluster is widely supported by ClusterControl. With over four thousand deployments and more than sixteen thousand configurations, you can be assured that ClusterControl is more than capable of helping you manage your Galera setup.

Read More

How Galera Cluster Enables High Availability for High Traffic Websites

This post gives an insight into how Galera can help to build HA websites.

Read More

How to Set Up Asynchronous Replication from Galera Cluster to Standalone MySQL server with GTID

Hybrid replication, i.e. combining Galera and asynchronous MySQL replication in the same setup, became much easier since GTID got introduced in MySQL 5.6. In this blog post, we will show you how to replicate a Galera Cluster to a MySQL server with GTID, and how to failover the replication in case the master node fails.

Read More

Full Restore of a MySQL or MariaDB Galera Cluster from Backup

Performing regular backups of your database cluster is imperative for high availability and disaster recovery. This blog post provides a series of best practices on how to fully restore a MySQL or MariaDB Galera Cluster from backup.

Read More

How to Bootstrap MySQL or MariaDB Galera Cluster

Unlike standard MySQL server and MySQL Cluster, the way to start a MySQL or MariaDB Galera Cluster is a bit different. Galera requires you to start a node in a cluster as a reference point, before the remaining nodes are able to join and form the cluster. This process is known as cluster bootstrap. Bootstrapping is an initial step to introduce a database node as primary component, before others see it as a reference point to sync up data.

Read More

Schema changes in Galera cluster for MySQL and MariaDB - how to avoid RSU locks

This post shows you how to avoid locking existing queries when performing rolling schema upgrades in Galera Cluster for MySQL and MariaDB.

Read More

Deploy an asynchronous slave to Galera Cluster for MySQL - The Easy Way

Due to its synchronous nature, Galera performance can be limited by the slowest node in the cluster. So running heavy reporting queries or making frequent backups on one node, or putting a node across a slow WAN link to a remote data center might indirectly affect cluster performance. Combining Galera and asynchronous MySQL replication in the same setup, aka Hybrid Replication, can help

Read More

Top Videos

ClusterControl for Galera Cluster - All Inclusive Database Management System

Watch the Video

Galera Cluster - ClusterControl Product Demonstration

Watch the Video

ClusterControl
Single Console for Your Entire Database Infrastructure
Find out what else is new in ClusterControl

ClusterControl for Galera

ClusterControl makes it easy for those new to Galera to use the technology and deploy their first clusters. It centralizes the database management into a single interface. ClusterControl automation ensures DBAs and SysAdmins make critical changes to the cluster efficiently with minimal risks.

ClusterControl delivers on an array of features to help manage and monitor your open source database environments:

  • Deploy Database Clusters
  • Add Node, Load Balancer (HAProxy, ProxySQL) or Replication Slave
  • Backup Management
  • Configuration Management
  • Full stack monitoring (DB/LB/Host)
  • Query Monitoring
  • Enable SSL Encryption Galera Replication
  • Node Management
  • Developer Studio with Advisors

Learn more about how ClusterControl can help you drive high availability with Galera Cluster here.

We hope that these resources prove useful!

Happy Clustering!

Galera Cluster Comparison - Codership vs Percona vs MariaDB

$
0
0

Galera Cluster is a synchronous multi-master replication plugin for InnoDB or XtraDB storage engine. It offers a number of outstanding features that standard MySQL replication doesn’t - read-write to any cluster node, automatic membership control, automatic node joining, parallel replication on row-level, and still keeping the native look and feel of a MySQL server. This plug-in is open-source and developed by Codership as a patch for standard MySQL. Percona and MariaDB leverage the Galera library in Percona XtraDB Cluster (PXC) and MariaDB Server (MariaDB Galera Cluster for pre 10.1) respectively.

We often get the question - which version of Galera should I use? Percona? MariaDB? Codership? This is not an easy one, since they all use the same Galera plugin that is developed by Codership. Nevertheless, let’s give it a try.

In this blog post, we’ll compare the three vendors and their Galera Cluster releases. We will be using the latest stable version of each vendor available at the time of writing - Galera Cluster for MySQL 5.7.18, Percona XtraDB Cluster 5.7.18 and MariaDB 10.2.7 where all are shipped with InnoDB storage engine 5.7.18.

Database Release

A database vendor who wish to leverage Galera Cluster technology would need to incorporate the WriteSet Replication (wsrep) API patch into its server codebase. This will allow the Galera plugin to work as a wsrep provider, to communicate and replicate transactions (writesets in Galera terms) via a group communication protocol.

The following diagram illustrates the difference between the standalone MySQL server, MySQL Replication and Galera Cluster:

Codership releases the wsrep-patched version of Oracle’s MySQL. MySQL has already released MySQL 5.7 as General Availability (GA) since October 2015. However the first beta wsrep-patched for MySQL was released a year later around October 2016, then became GA in January 2017. It took more than a year to incorporate Galera Cluster into Oracle’s MySQL 5.7 release line.

Percona releases the wsrep-patched version of its Percona Server for MySQL called Percona XtraDB Cluster (PXC). Percona Server for MySQL comes with XtraDB storage engine (a drop-in replacement of InnoDB) and follows the upstream Oracle MySQL releases very closely (including all the bug fixes in it) with some additional features like MyRocks storage engine, TokuDB as well as Percona’s own bug fixes. In a way, you can think of it as an improved version of Oracle’s MySQL, embedded with Galera technology.

MariaDB releases the wsrep-patched version of its MariaDB Server, and it’s already embedded since MariaDB 10.1, where you don’t have to install separate packages for Galera. In the previous versions (5.5 and 10.0 particularly), the Galera variant’s of MariaDB is called MariaDB Galera Cluster (MGC) with separate builds. MariaDB has its own path of releases and versioning and does not follow any upstream like Percona does. The MariaDB server functionality has started diverging from MySQL, so it might not be as straightforward a replacement for MySQL. It still comes with a bunch of great features and performance improvements though.

System Status

Monitoring Galera nodes and the cluster requires the wsrep API to report several statuses, which is exposed through SHOW STATUS statement:

mysql> SHOW STATUS LIKE 'wsrep%';

PXC does have a number of extra statuses, if compared to other variants. The following list shows wsrep related status that can only be found in PXC:

  • wsrep_flow_control_interval
  • wsrep_flow_control_interval_low
  • wsrep_flow_control_interval_high
  • wsrep_flow_control_status
  • wsrep_cert_bucket_count
  • wsrep_gcache_pool_size
  • wsrep_ist_receive_status
  • wsrep_ist_receive_seqno_start
  • wsrep_ist_receive_seqno_current
  • wsrep_ist_receive_seqno_end

While MariaDB only has one extra wsrep status, if compared to the Galera version provided by Codership:

  • wsrep_thread_count

The above does not necessarily tell us that PXC is superior to the others. It means that you can get better insights with more statuses.

Configuration Options

Since Galera is part of MariaDB 10.1 and later, you have to explicitly enable the following option in the configuration file:

wsrep_ready=ON

Note that if you do not enable this option, the server will act as a standard MariaDB installation. For Codership and Percona, this option is enabled by default.

Some Galera-related variables are NOT available across all Galera variants:

Database ServerVariable name
Codership’s MySQL Galera Cluster 5.7.18, wsrep 25.12
  • wsrep_mysql_replication_bundle
  • wsrep_preordered
  • wsrep_reject_queries
Percona XtraDB Cluster 5.7.18, wsrep 29.20
  • wsrep_preordered
  • wsrep_reject_queries
  • pxc_encrypt_cluster_traffic
  • pxc_maint_mode
  • pxc_maint_transition_period
  • pxc_strict_mode
MariaDB 10.2.7, wsrep 25.19
  • wsrep_gtid_domain_id
  • wsrep_gtid_mode
  • wsrep_mysql_replication_bundle
  • wsrep_patch_version

The above list might change once the vendor releases a new version. The only point that we would like to highlight here is, do not expect that Galera nodes hold the same set of configuration parameters across all variants. Some configuration variables were introduced by a vendor to specifically complement and improve the database server.

Contributions and Improvements

Database performance is not easily comparable, as it can vary a lot depending on the workloads. For general workloads, the replication performance are fairly similar across all variants. Under some specific workloads, it could be different.

Looking at the latest claims, Percona did an amazing job improving IST performance up to 4x as well as the commit operation. MariaDB also contributes a number of useful features for example WSREP_INFO plugin. On the other hand, Codership is focusing more on core Galera issues issues, including bug fixing and new features. Galera 4.0 has features like intelligent donor selection, huge transaction support, and non-blocking DDL.

The introduction of Percona Xtrabackup (a.k.a xtrabackup) as part of Galera’s SST has improved the SST performance significantly. The syncing process becomes faster and non-blocking to the donor. MariaDB then came up with its own xtrabackup fork called MariaDB Backup (mariabackup) which supported by Galera’s SST method through variable wsrep_sst_method=mariabackup. It also supports installation on Microsoft Windows.

Support

All Galera Cluster variants software are open-source and available for free. This includes the syncing software supported by Galera like mysqldump, rsync, Percona Xtrabackup and MariaDB Backup. For community users, you can seek for support, ask for questions, file a bug report, feature request or even make a pull request to the vendor’s respective support channels:

 CodershipPerconaMariaDB
Database server public issue trackerMySQL wsrep on GithubPercona XtraDB Cluster on LaunchpadMariaDB Server on JIRA
Galera issue trackerGalera on Github
DocumentationGalera Cluster DocumentationPercona XtraDB Cluster DocumentationMariaDB Documentation
Support forumCodership Team GroupsPercona ForumMariaDB Open Questions

Each vendor provides commercial support services.

Summary

We hope that this comparison gives you a clearer picture and helps you determine which vendor that better suits your need. They all use pretty much the same wsrep libraries, the differences would be mainly on the server side - for instance, if you want to leverage some specific features in MariaDB or Percona Server. You might want to check out this blog that compares the different servers (Oracle MySQL, MariaDB and Percona Server). ClusterControl supports all of the three vendors, so you can easily deploy different clusters and compare them yourself with your own workload, on your own hardware. Do give it a try.

A How-To Guide for Galera Cluster - Updated Tutorial

$
0
0

Since it was originally published more than 63,000 people (to date) have leveraged the MySQL for Galera Cluster Tutorial to both learn about and get started using MySQL Galera Cluster.

Galera Cluster for MySQL is a true Multi-master Cluster which is based on synchronous replication. Galera Cluster is an easy-to-use, high-availability solution, which provides high system uptime, no data loss and scalability to allow for future growth.

Severalnines was a very early adopter of the Galera Cluster technology; which was created by Codership and has since expanded to include versions from Percona and MariaDB.  

Included in this newly updated tutorial are topics like…

  • An introduction to Galera Cluster
  • An explanation of the differences between MySQL Replication and Galera Replication
  • Deployment of Galera Cluster
  • Accessing the Galera Cluster
  • Failure Handling
  • Management and Operations
  • FAQs and Common Questions

Check out the updated tutorial MySQL for Galera Cluster here.

ClusterControl
Single Console for Your Entire Database Infrastructure
Find out what else is new in ClusterControl

ClusterControl for Galera

ClusterControl makes it easy for those new to Galera to use the technology and deploy their first clusters. It centralizes the database management into a single interface. ClusterControl automation ensures DBAs and SysAdmins make critical changes to the cluster efficiently with minimal risks.

ClusterControl delivers on an array of features to help manage and monitor your open source database environments:

  • Deploy Database Clusters
  • Add Node, Load Balancer (HAProxy, ProxySQL) or Replication Slave
  • Backup Management
  • Configuration Management
  • Full stack monitoring (DB/LB/Host)
  • Query Monitoring
  • Enable SSL Encryption Galera Replication
  • Node Management
  • Developer Studio with Advisors

Learn more about how ClusterControl can help you drive high availability with Galera Cluster here.


Multiple Data Center Setups Using Galera Cluster for MySQL or MariaDB

$
0
0

Building high availability, one step at a time

When it comes to database infrastructure, we all want it. We all strive to build a highly available setup. Redundancy is the key. We start to implement redundancy at the lowest level and continue up the stack. It starts with hardware - redundant power supplies, redundant cooling, hot-swap disks. Network layer - multiple NIC’s bonded together and connected to different switches which are using redundant routers. For storage we use disks set in RAID, which gives better performance but also redundancy. Then, on the software level, we use clustering technologies: multiple database nodes working together to implement redundancy: MySQL Cluster, Galera Cluster.

All of this is no good  if you have everything in a single datacenter: when a datacenter goes down, or part of the services (but important ones) go offline, or even if you lose connectivity to the datacenter, your service will go down -  no matter the amount of redundancy in the lower levels. And yes, those things happens.

  • S3 service disruption wreaked havoc in US-East-1 region in February, 2017
  • EC2 and RDS Service Disruption in US-East region in April, 2011
  • EC2, EBS and RDS were disrupted in EU-West region in August, 2011
  • Power outage brought down Rackspace Texas DC in June, 2009
  • UPS failure caused hundreds of servers to go offline in Rackspace London DC in January, 2010

This is by no means a complete list of failures, it’s just the result of a quick Google search. These serve as examples that things may and will go wrong if you put all your eggs into the same basket. One more example would be Hurricane Sandy, which caused enormous exodus of data from US-East to US-West DC’s - at that time you could hardly spin up instances in US-West as everyone rushed to move their infrastructure to the other coast in expectation that North Virginia DC will be seriously affected by the weather.

So, multi-datacenter setups are a must if you want to build a high availability environment. In this blog post, we will discuss how to build such infrastructure using Galera Cluster for MySQL/MariaDB.

Galera concepts

Before we look into particular solutions, let us spend some time explaining two concepts which are very important in highly available, multi-DC Galera setups.

Quorum

High availability requires resources - namely, you need a number of nodes in the cluster to make it highly available. A cluster can tolerate the loss of some of its members, but only to a certain extent. Beyond a certain failure rate, you might be looking at a split-brain scenario.

Let’s take an example with a 2 node setup.  If one of the nodes goes down, how can the other one know that its peer crashed and it’s not a network failure? In that case, the other node might as well be up and running, serving traffic. There is no good way to handle such case… This is why fault tolerance usually starts from three nodes. Galera uses a quorum calculation to determine if it is safe for the cluster to handle traffic, or if it should cease operations. After a failure, all remaining nodes attempt to connect to each other and determine how many of them are up. It’s then compared to the previous state of the cluster, and as long as more than 50% of the nodes are up, the cluster can continue to operate.

This results in following:
2 node cluster - no fault tolerance
3 node cluster - up to 1 crash
4 node cluster - up to 1 crash (if two nodes would crash, only 50% of the cluster would be available, you need more than 50% nodes to survive)
5 node cluster - up to 2 crashes
6 node cluster - up to 2 crashes

You probably see the pattern - you want your cluster to have an odd number of nodes - in terms of high availability there’s no point in moving from 5 to 6 nodes in the cluster. If you want better fault tolerance, you should go for 7 nodes.

Segments

Typically, in a Galera cluster, all communication follows the all to all pattern. Each node talks to all the other nodes in the cluster.

As you may know, each writeset in Galera has to be certified by all of the nodes in the cluster - therefore every write that happened on a node has to be transferred to all of the nodes in the cluster. This works ok in a low-latency environment. But if we are talking about multi-DC setups, we need to consider much higher latency than in a local network. To make it more bearable in clusters spanning over Wide Area Networks, Galera introduced segments.

They work by containing the Galera traffic within a group of nodes (segment). All nodes within a single segment act as if they were in a local network - they assume one to all communication. For cross-segment traffic, things are different - in each of the segments, one “relay” node is chosen, all of the cross-segment traffic goes through those nodes. When a relay node goes down, another node is elected. This does not reduce latency by much - after all, WAN latency will stay the same no matter if you make a connection to one remote host or to multiple remote hosts, but given that WAN links tend to be limited in bandwidth and there might be a charge for the amount of data transferred, such approach allows you to limit the amount of data exchanged between segments. Another time and cost-saving option is the fact that nodes in the same segment are prioritized when a donor is needed - again, this limits the amount of data transferred over the WAN and, most likely, speeds up SST as a local network almost always will be faster than a WAN link.

ClusterControl
Single Console for Your Entire Database Infrastructure
Find out what else is new in ClusterControl

Galera in multi-DC setups

Now that we’ve got some of these concepts out of the way, let’s look at some other important aspects of multi-DC setups for Galera cluster.

Issues you are about to face

When working in environments spanning across WAN, there are a couple of issues you need to take under consideration when designing your environment.

Quorum calculation

In the previous section, we described how a quorum calculation looks like in Galera cluster - in short, you want to have an odd number of nodes to maximize survivability. All of that is still true in multi-DC setups, but some more elements are added into the mix. First of all, you need to decide if you want Galera to automatically handle a datacenter failure. This will determine how many datacenters you are going to use. Let’s imagine two DC’s - if you’ll split your nodes 50% - 50%, if one datacenter goes down, the second one doesn’t have 50%+1 nodes to maintain its “primary” state. If you split your nodes in an uneven way, using the majority of them in the “main” datacenter, when that datacenter goes down, the “backup” DC won’t have 50% + 1 nodes to form a quorum. You can assign different weights to nodes but the result will be exactly the same - there’s no way to automatically failover between two DC’s without manual intervention. To implement automated failover, you need more than two DC’s. Again, ideally an odd number - three datacenters is a perfectly fine setup. Next, the question is - how many nodes you need to have? You want to have them evenly distributed across the datacenters. The rest is just a matter of how many failed nodes your setup has to handle.

Minimal setup will use one node per datacenter - it has serious drawbacks, though. Every state transfer will require moving data across the WAN and this results in either longer time needed to complete SST or higher costs.

Quite typical setup is to have six nodes, two per datacenter. This setup seems unexpected as it has an even number of nodes. But, when you think of it, it might not be that big of an issue: it’s quite unlikely that three nodes will go down at once, and such a setup will survive a crash of up to two nodes. A whole datacenter may go offline and two remaining DC’s will continue operations. It also has a huge advantage over the minimal setup - when a node goes offline, there’s always a second node in the datacenter which can serve as a donor. Most of the time, the WAN won’t be used for SST.

Of course, you can increase the number of nodes to three per cluster, nine in total. This gives you even better survivability: up to four nodes may crash and the cluster will still survive. On the other hand, you have to keep in mind that, even with the use of segments, more nodes means higher overhead of operations and you can scale out Galera cluster only to a certain extent.

It may happen that there’s no need for a third datacenter because, let’s say, your application is located in only two of them. Of course, the requirement of three datacenters is still valid so you won’t go around it, but it is perfectly fine to use a Galera Arbitrator (garbd) instead of fully loaded database servers.

Garbd can be installed on smaller nodes, even virtual servers. It does not require powerful hardware, it does not store any data nor apply any of the writesets. But it does see all the replication traffic, and takes part in the quorum calculation. Thanks to it, you can deploy setups like four nodes, two per DC + garbd in the third one - you have five nodes in total, and such cluster can accept up to two failures. So it means it can accept a full shutdown of one of the datacenters.

Which option is better for you? There is no best solution for all cases, it all depends on your infrastructure requirements. Luckily, there are different options to pick from: more or less nodes, full 3 DC or 2 DC and garbd in the third one - it’s quite likely you’ll find something suitable for you.

Network latency

When working with multi-DC setups, you have to keep in mind that network latency will be significantly higher than what you’d expect from a local network environment. This may seriously reduce performance of the Galera cluster when you compare it with standalone MySQL instance or a MySQL replication setup. The requirement that all of the nodes have to certify a writeset means that all of the nodes have to receive it, no matter how far away they are. With asynchronous replication, there’s no need to wait before a commit. Of course, replication has other issues and drawbacks, but latency is not the major one. The problem is especially visible when your database has hot spots - rows, which are frequently updated (counters, queues, etc). Those rows cannot be updated more often than once per network round trip. For clusters spanning across the globe, this can easily mean that you won’t be able to update a single row more often than 2 - 3 times per second. If this becomes a limitation for you, it may mean that Galera cluster is not a good fit for your particular workload.

Proxy layer in multi-DC Galera cluster

It’s not enough to have Galera cluster spanning across multiple datacenters, you still need your application to access them. One of the popular methods to hide complexity of the database layer from an application is to utilize a proxy. Proxies are used as an entry point to the databases, they track the state of the database nodes and should always direct traffic to only the nodes that are available. In this section, we’ll try to propose a proxy layer design which could be used for a multi-DC Galera cluster. We’ll use ProxySQL, which gives you quite a bit of flexibility in handling database nodes, but you can use another proxy, as long as it can track the state of Galera nodes.

Where to locate the proxies?

In short, there are two common patterns here: you can either deploy ProxySQL on a separate nodes or you can deploy them on the application hosts. Let’s take a look at pros and cons of each of these setups.

Proxy layer as a separate set of hosts

The first pattern is to build a proxy layer using separate, dedicated hosts. You can deploy ProxySQL on a couple of hosts, and use Virtual IP and keepalived to maintain high availability. An application will use the VIP to connect to the database, and the VIP will ensure that requests will always be routed to an available ProxySQL. The main issue with this setup is that you use at most one of the ProxySQL instances - all standby nodes are not used for routing the traffic. This may force you to use more powerful hardware than you’d typically use. On the other hand, it is easier to maintain the setup - you will have to apply configuration changes on all of the ProxySQL nodes, but there will be just a handful of them. You can also utilize ClusterControl’s option to sync the nodes. Such setup will have to be duplicated on every datacenter that you use.

Proxy installed on application instances

Instead of having a separate set of hosts, ProxySQL can also be installed on the application hosts. Application will connect directly to the ProxySQL on localhost, it could even use unix socket to minimize the overhead of the TCP connection. The main advantage of such a setup is that you have a large number of ProxySQL instances, and the load is evenly distributed across them. If one goes down, only that application host will be affected. The remaining nodes will continue to work. The most serious issue to face is configuration management. With a large number of ProxySQL nodes, it is crucial to come up with an automated method of keeping their configurations in sync. You could use ClusterControl, or a configuration management tool like Puppet.

Tuning of Galera in a WAN environment

Galera defaults are designed for local network and if you want to use it in a WAN environment, some tuning is required. Let’s discuss some of the basic tweaks you can make. Please keep in mind that the precise tuning requires production data and traffic - you can’t just make some changes and assume they are good, you should do proper benchmarking.

Operating system configuration

Let’s start with the operating system configuration. Not all of the modifications proposed here are WAN-related, but it’s always good to remind ourselves what is a good starting point for any MySQL installation.

vm.swappiness = 1

Swappiness controls how aggressive the operating system will use swap. It should not be set to zero because in more recent kernels, it prevents the OS from using swap at all and it may cause serious performance issues.

/sys/block/*/queue/scheduler = deadline/noop

The scheduler for the block device, which MySQL uses, should be set to either deadline or noop. The exact choice depends on the benchmarks but both settings should deliver similar performance, better than default scheduler, CFQ.

For MySQL, you should consider using EXT4 or XFS, depending on the kernel (performance of those filesystems changes from one kernel version to another). Perform some benchmarks to find the better option for you.

In addition to this, you may want to look into sysctl network settings. We will not discuss them in detail (you can find documentation here) but the general idea is to increase buffers, backlogs and timeouts, to make it easier to accommodate for stalls and unstable WAN link.

net.core.optmem_max = 40960
net.core.rmem_max = 16777216
net.core.wmem_max = 16777216
net.core.rmem_default = 16777216
net.core.wmem_default = 16777216
net.ipv4.tcp_rmem = 4096 87380 16777216
net.ipv4.tcp_wmem = 4096 87380 16777216
net.core.netdev_max_backlog = 50000
net.ipv4.tcp_max_syn_backlog = 30000
net.ipv4.tcp_congestion_control = htcp
net.ipv4.tcp_mtu_probing = 1
net.ipv4.tcp_max_tw_buckets = 2000000
net.ipv4.tcp_tw_reuse = 1
net.ipv4.tcp_fin_timeout = 30
net.ipv4.tcp_slow_start_after_idle = 0

In addition to OS tuning you should consider tweaking Galera network - related settings.

evs.suspect_timeout
evs.inactive_timeout

You may want to consider changing the default values of these variables. Both timeouts govern how the cluster evicts failed nodes. Suspect timeout takes place when all of the nodes cannot reach the inactive member. Inactive timeout defines a hard limit of how long a node can stay in the cluster if it’s not responding. Usually you’ll find that the default values work well. But in some cases, especially if you run your Galera cluster over WAN (for example, between AWS regions), increasing those variables may result in more stable performance. We’d suggest to set both of them to PT1M, to make it less likely that WAN link instability will throw a node out of the cluster.

evs.send_window
evs.user_send_window

These variables, evs.send_window and evs.user_send_window, define how many packets can be sent via replication at the same time (evs.send_window) and how many of them may contain data (evs.user_send_window). For high latency connections, it may be worth increasing those values significantly (512 or 1024 for example).

evs.inactive_check_period

The above variable may also be changed. evs.inactive_check_period, by default, is set to one second, which may be too often for a WAN setup. We’d suggest to set it to PT30S.

gcs.fc_factor
gcs.fc_limit

Here we want to minimize chances that flow control will kick in, therefore we’d suggest to set gcs.fc_factor to 1 and increase gcs.fc_limit to, for example, 260.

gcs.max_packet_size

As we are working with the WAN link, where latency is significantly higher, we want to increase size of the packets. A good starting point would be 2097152.

As we mentioned earlier, it is virtually impossible to give a simple recipe on how to set these parameters as it depends on too many factors - you will have to do your own benchmarks, using data as close to your production data as possible, before you can say your system is tuned. Having said that, those settings should give you a starting point for the more precise tuning.

That’s it for now. Galera works pretty well in WAN environments, so do give it a try and let us know how you get on.

Manage and Automate Galera Cluster - Why ClusterControl

$
0
0

Galera Cluster by Codership is a synchronous multi-master replication technology which can be utilized to build highly available MySQL or MariaDB clusters.

It has been downloaded over one million times since last year, establishing itself as one of the most popular high availability and scalability technologies for MySQL, MariaDB and Percona Server with database users worldwide.

And while Galera Cluster is easy enough to deploy, it is complex to operate. To properly automate and manage it does require a sound understanding of how it works and how it behaves in production. For instance, once it’s deployed, how does it behave under a real-life workload, scale, and during long term operations?

This is where monitoring performance and optimizing it, understanding anomalies, recovering from failures, managing schema and configuration changes and pushing them in production, version upgrades and performing backups come into play.

There are a number of things you’d want to have thought through and be in control of before going in production with Galera Cluster for MySQL or MariaDB:

  • Hardware and network requirements
  • OS tuning
  • Sane configuration settings for the database
  • Production-grade deployment
  • Security
  • Monitoring and alerting
  • Query performance
  • Anomaly detection and troubleshooting
  • Recovering from failures
  • Schema changes
  • Backup strategies and disaster recovery
  • Disaster recovery
  • Reporting and analytics
  • Capacity planning

And the list goes on ...

We saw great potential in Galera Cluster early on, and started building a deployment and management product for it even before the first 1.0 version was released. We are happy to see that the technology has delivered on its promises - high availability of MySQL with good write scalability. Over the years, we have been able to build out comprehensive management procedures in ClusterControl and battle-test these across thousands of installations.

Not everyone has the knowledge, skills, time or resources to manage a high availability database. It is hard enough to find a production DBA, or a DevOps person with strong database knowledge. So imagine that most of the relevant steps in that process could be automated and managed from one central system?

This is where ClusterControl comes in.

ClusterControl
Single Console for Your Entire Database Infrastructure
Find out what else is new in ClusterControl

ClusterControl is our all-inclusive database management system that lets you easily deploy, monitor, manage and scale highly available open source databases on-premise or in the cloud.

So Why Use ClusterControl for Galera Cluster?

Deploying a production ready Galera Cluster has become a matter of a few clicks for ClusterControl users worldwide. And with tens of thousands of deployments to date, it’s safe to say that ClusterControl is truly ‘Galera battle-tested’. We’ve included years of industry best practices into the product to help companies automate and manage their database operations as smoothly as possible.

Some of the key benefits of using ClusterControl with Galera Cluster include:

  • Maximum efficiency: automated failure detection, failover, and automatic recovery of individual nodes or even entire clusters to achieve
  • Pro-active intelligence: gain access to advanced monitoring features that give you insights into your database performance and alert you to any problems right away
  • Advanced security: ClusterControl provides an array of advanced security features that you can depend on to keep your data safe

One of our most trusted users put it this way:

“In Severalnines we found a partner that is much more than a perfect database management system provider with ClusterControl: we have a partner that helps us define the architectures of our LAMP projects and leverage the capabilities of Galera Cluster.”

- Olivier Lenormand, Technical Manager, CNRS/DSI.

Customers include Cisco, British Telecom, Orange, Ping Identity, Cisco, Liberty Global, AVG and many others.

The following are some of the key features to be found in ClusterControl for Galera Cluster:

  • Deploy Database Clusters
  • Configuration Management
  • Full stack monitoring (DB/LB/Host)
  • Query Monitoring
  • Anomaly detection
  • Failure detection and automatic recovery/repair
  • Add Node, Load Balancer (HAProxy, ProxySQL, MaxScale) or asynchronous replication slave
  • Backup Management
  • Encryption of data in transit
  • Online rolling upgrades
  • Developer Studio with Advisors

For a general introduction to ClusterControl, view the following video:

And for a demonstration of the ClusterControl features for Galera Cluster, view the following demo video:

To summarise, working seamlessly with your Galera setup, ClusterControl provides an integrated monitoring and troubleshooting approach, speeding up problem resolutions. A single interface saves you time by not having to cobble together configuration management tools, monitoring tools, scripts, etc. to operate your databases. And you can maximize efficiency and reduce database downtime with battle-tested automated recovery features.

Finally, ClusterControl fully supports all three Galera Cluster flavours, so you can easily deploy different clusters and compare them yourself with your own workload, on your own hardware. Do give it a try.

[Updated] Monitoring Galera Cluster for MySQL or MariaDB - Understanding metrics and their meaning

$
0
0

To operate any database efficiently, you need to have insight into database performance. This might not be obvious when everything is going well, but as soon as something goes wrong, access to information can be instrumental in quickly and correctly diagnosing the problem.

All databases make some of their internal status data available to users. In MySQL, you can get this data mostly by running 'SHOW STATUS' and 'SHOW GLOBAL STATUS', by executing 'SHOW ENGINE INNODB STATUS', checking information_schema tables and, in newer versions, by querying performance_schema tables.

These methods are far from convenient in day-to-day operations, hence the popularity of different monitoring and trending solutions. Tools like Nagios/Icinga are designed to watch hosts/services, and alert when a service falls outside an acceptable range. Other tools such as Cacti and Munin provide a graphical look at host/service information, and give historical context to performance and usage. ClusterControl combines these two types of monitoring, so we’ll have a look at the information it presents, and how we should interpret it.

If you’re using Galera Cluster (MySQL Galera Cluster by Codership or MariaDB Cluster or Percona XtraDB Cluster), you may have noticed the following section in ClusterControl’s "Overview" tab:

Let’s see, step by step, what kind of data we have here.

The first column contains the list of nodes with their IP addresses - there’s not much else to say about it.

Second column is more interesting - it describes node status (wsrep_local_state_comment status). A node can be in different states:

  • Initialized - The node is up and running, but it’s not a part of a cluster. It can be caused, for example, by network issues;
  • Joining - The node is in the process of joining the cluster and it’s either receiving or requesting a state transfer from one of other nodes;
  • Donor/Desynced - The node serves as a donor to some other node which is joining the cluster;
  • Joined - The node is joined the cluster but its busy catching up on committed write sets;
  • Synced - The node is working normally.

In the same column within the bracket is the cluster status (wsrep_cluster_status status). It can have three distinct states:

  • Primary - The communication between nodes is working and quorum is present (majority of nodes is available)
  • Non-Primary - The node was a part of the cluster but, for some reason, it lost contact with the rest of the cluster. As a result, this node is considered inactive and it won’t accept queries
  • Disconnected - The node could not establish group communication.

"WSREP Cluster Size / Ready" tells us about a cluster size as the node sees it, and whether the node is ready to accept queries. Non-Primary components create a cluster with size of 1 and wsrep readiness is OFF.

Let’s take a look at the screenshot above, and see what it is telling us about Galera. We can see three nodes. Two of them (192.168.55.171 and 192.168.55.173) are perfectly fine, they are both "Synced" and the cluster is in "Primary" state. The cluster currently consists of two nodes. Node 192.168.55.172 is "Initialized" and it forms "non-Primary" component. It means that this node lost connection with the cluster - most likely some kind of network issues (in fact, we used iptables to block a traffic to this node from both 192.168.55.171 and 192.168.55.173).

At this moment we have to stop a bit and describe how Galera Cluster works internally. We’ll not go into too much details as it is not within a scope of this blog post but some knowledge is required to understand the importance of the data presented in next columns.

Galera is a "virtually" synchronous, multi-master cluster. It means that you should expect data to be transferred across nodes "virtually" at the same time (no more annoying issues with lagging slaves) and that you can write to any node in a cluster (no more annoying issues with promoting a slave to master). To accomplish that, Galera uses writesets - atomic set of changes that are replicated across the cluster. A writeset can contain several row changes and additional needed information like data regarding locking.

Once a client issues COMMIT, but before MySQL actually commits anything, a writeset is created and sent to all nodes in the cluster for certification. All nodes check whether it’s possible to commit the changes or not (as changes may interfere with other writes executed, in the meantime, directly on another node). If yes, data is actually committed by MySQL, if not, rollback is executed.

What’s important to remember is the fact that nodes, similar to slaves in regular replication, may perform differently - some may have better hardware than others, some may be more loaded than others. Yet Galera requires them to process the writesets in a short and quick manner, in order to maintain "virtual" synchronization. There has to be a mechanism which can throttle the replication and allow slower nodes to keep up with the rest of the cluster.

Let's take a look at "Local Send Q [now/avg]" and "Local Receive Q [now/avg]" columns. Each node has a local queue for sending and receiving writesets. It allows to parallelize some of the writes and queue data which couldn’t be processed at once if node cannot keep up with traffic. In SHOW GLOBAL STATUS we can find eight counters describing both queues, four counters per queue:

  • wsrep_local_send_queue - current state of the send queue
  • wsrep_local_send_queue_min - minimum since FLUSH STATUS
  • wsrep_local_send_queue_max - maximum since FLUSH STATUS
  • wsrep_local_send_queue_avg - average since FLUSH STATUS
  • wsrep_local_recv_queue - current state of the receive queue
  • wsrep_local_recv_queue_min - minimum since FLUSH STATUS
  • wsrep_local_recv_queue_max - maximum since FLUSH STATUS
  • wsrep_local_recv_queue_avg - average since FLUSH STATUS

The above metrics are unified across nodes under ClusterControl -> Performance -> DB Status:

ClusterControl displays "now" and "average" counters, as they are the most meaningful as a single number (you can also create custom graphs based on variables describing the current state of the queues) . When we see that one of the queues is rising, this means that the node can’t keep up with the replication and other nodes will have to slow down to allow it to catch up. We’d recommend to investigate a workload of that given node - check the process list for some long running queries, check OS statistics like CPU utilization and I/O workload. Maybe it’s also possible to redistribute some of the traffic from that node to the rest of the cluster.

"Flow Control Paused" shows information about the percentage of time a given node had to pause its replication because of too heavy load. When a node can’t keep up with the workload it sends Flow Control packets to other nodes, informing them they should throttle down on sending writesets. In our screenshot, we have value of ‘0.30’ for node 192.168.55.172. This means that almost 30% of the time this node had to pause the replication because it wasn’t able to keep up with writeset certification rate required by other nodes (or simpler, too many writes hit it!). As we can see, it’s "Local Receive Q [avg]" points us also to this fact.

Next column, "Flow Control Sent" gives us information about how many Flow Control packets a given node sent to the cluster. Again, we see that it’s node 192.168.55.172 which is slowing down the cluster.

What can we do with this information? Mostly, we should investigate what’s going on in the slow node. Check CPU utilization, check I/O performance and network stats. This first step helps to assess what kind of problem we are facing.

In this case, once we switch to CPU Usage tab, it becomes clear that extensive CPU utilization is causing our issues. Next step would be to identify the culprit by looking into PROCESSLIST (Query Monitor -> Running Queries -> filter by 192.168.55.172) to check for offending queries:

Or, check processes on the node from operating system’s side (Nodes -> 192.168.55.172 -> Top) to see if the load is not caused by something outside of Galera/MySQL.

In this case, we have executed mysqld command through cpulimit, to simulate slow CPU usage specifically for mysqld process by limiting it to 30% out of 400% available CPU (the server has 4 cores).

"Cert Deps Distance" column gives us information about how many writesets, on average, can be applied in parallel. Writesets can, sometimes, be executed at the same time - Galera takes advantage of this by using multiple wsrep_slave_threads to apply writesets. This column gives you some idea how many slave threads you could use on your workload. It’s worth noting that there’s no point in setting up wsrep_slave_threads variable to values higher than you see in this column or in wsrep_cert_deps_distance status variable, on which "Cert Deps Distance" column is based. Another important note - there is no point either in setting wsrep_slave_threads variable to more than number of cores your CPU has.

"Segment ID" - this column will require some more explanation. Segments are a new feature added in Galera 3.0. Before this version, writesets were exchanged between all nodes. Let’s say we have two datacenters:

This kind of chatter works ok on local networks but WAN is a different story - certification slows down due to increased latency, additional costs are generated because of network bandwidth used for transferring writesets between every member of the cluster.

With the introduction of "Segments", things changed. You can assign a node to a segment by modifying wsrep_provider_options variable and adding "gmcast.segment=x" (0, 1, 2) to it. Nodes with the same segment number are treated as they are in the same datacenter, connected by local network. Our graph then becomes different:

The main difference is that it’s no more everyone to everyone communication. Within each segment, yes - it’s still the same mechanism but both segments communicate only through a single connection between two chosen nodes. In case of downtime, this connection will failover automatically. As a result, we get less network chatter and less bandwidth usage between remote datacenters. So, basically, "Segment ID" column tells us to which segment a node is assigned.

"Last Committed" column gives us information about the sequence number of the writeset that was last executed on a given node. It can be useful in determining which node is the most current one if there’s a need to bootstrap the cluster.

Rest of the columns are self-explanatory: Server version, uptime of a node and when the status was updated.

As you can see, the "Galera Nodes" section of the "Nodes/Hosts Stats" in the "Overview" tab gives you a pretty good understanding of the cluster’s health - whether it forms a "Primary" component, how many nodes are healthy, are there any performance issues with some nodes and if yes, which node is slowing down the cluster.

This set of data comes in very handy when you operate your Galera cluster, so hopefully, no more flying blind :-)

How to Automate Galera Cluster Using the ClusterControl CLI

$
0
0

As sysadmins and developers, we spend a lot our time in a terminal. So we brought ClusterControl to the terminal with our command line interface tool called s9s. s9s provides an easy interface to the ClusterControl RPC v2 API. You will find it very useful when working with large scale deployments, as the CLI allows will allow you to design more complex features and workflows.

This blog post showcases how to use s9s to automate the management of Galera Cluster for MySQL or MariaDB, as well as a simple master-slave replication setup.

Setup

You can find installation instructions for your particular OS in the documentation. What’s important to note is that if you happen to use the latest s9s-tools, from GitHub, there’s a slight change in the way you create a user. The following command will work fine:

s9s user --create --generate-key --controller="https://localhost:9501" dba

In general, there are two steps required if you want to configure CLI locally on the ClusterControl host. First, you need to create a user and then make some changes in the configuration file - all the steps are included in the documentation.

Deployment

Once the CLI has been configured correctly and has SSH access to your target database hosts, you can start the deployment process. At the time of writing, you can use the CLI to deploy MySQL, MariaDB and PostgreSQL clusters. Let’s start with an example of how to deploy Percona XtraDB Cluster 5.7. A single command is required to do that.

s9s cluster --create --cluster-type=galera --nodes="10.0.0.226;10.0.0.227;10.0.0.228"  --vendor=percona --provider-version=5.7 --db-admin-passwd="pass" --os-user=root --cluster-name="PXC_Cluster_57" --wait

Last option “--wait” means that the command will wait until the job completes, showing its progress. You can skip it if you want - in that case, the s9s command will return immediately to shell after it registers a new job in cmon. This is perfectly fine as cmon is the process which handles the job itself. You can always check the progress of a job separately, using:

root@vagrant:~# s9s job --list -l
--------------------------------------------------------------------------------------
Create Galera Cluster
Installing MySQL on 10.0.0.226                                           [██▊       ]
                                                                                                                                                                                                         26.09%
Created   : 2017-10-05 11:23:00    ID   : 1          Status : RUNNING
Started   : 2017-10-05 11:23:02    User : dba        Host   :
Ended     :                        Group: users
--------------------------------------------------------------------------------------
Total: 1

Let’s take a look at another example. This time we’ll create a new cluster, MySQL replication: simple master - slave pair. Again, a single command is enough:

root@vagrant:~# s9s cluster --create --nodes="10.0.0.229?master;10.0.0.230?slave" --vendor=percona --cluster-type=mysqlreplication --provider-version=5.7 --os-user=root --wait
Create MySQL Replication Cluster
/ Job  6 FINISHED   [██████████] 100% Cluster created

We can now verify that both clusters are up and running:

root@vagrant:~# s9s cluster --list --long
ID STATE   TYPE        OWNER GROUP NAME           COMMENT
 1 STARTED galera      dba   users PXC_Cluster_57 All nodes are operational.
 2 STARTED replication dba   users cluster_2      All nodes are operational.
Total: 2

Of course, all of this is also visible via the GUI:

Now, let’s add a ProxySQL loadbalancer:

root@vagrant:~# s9s cluster --add-node --nodes="proxysql://10.0.0.226" --cluster-id=1
WARNING: admin/admin
WARNING: proxy-monitor/proxy-monitor
Job with ID 7 registered.

This time we didn’t use ‘--wait’ option so, if we want to check the progress, we have to do it on our own. Please note that we are using a job ID which was returned by the previous command, so we’ll obtain information on this particular job only:

root@vagrant:~# s9s job --list --long --job-id=7
--------------------------------------------------------------------------------------
Add ProxySQL to Cluster
Waiting for ProxySQL                                                     [██████▋   ]
                                                                            65.00%
Created   : 2017-10-06 14:09:11    ID   : 7          Status : RUNNING
Started   : 2017-10-06 14:09:12    User : dba        Host   :
Ended     :                        Group: users
--------------------------------------------------------------------------------------
Total: 7

Scaling out

Nodes can be added to our Galera cluster via a single command:

s9s cluster --add-node --nodes 10.0.0.229 --cluster-id 1
Job with ID 8 registered.
root@vagrant:~# s9s job --list --job-id=8
ID CID STATE  OWNER GROUP CREATED  RDY  TITLE
 8   1 FAILED dba   users 14:15:52   0% Add Node to Cluster
Total: 8

Something went wrong. We can check what exactly happened:

root@vagrant:~# s9s job --log --job-id=8
addNode: Verifying job parameters.
10.0.0.229:3306: Adding host to cluster.
10.0.0.229:3306: Testing SSH to host.
10.0.0.229:3306: Installing node.
10.0.0.229:3306: Setup new node (installSoftware = true).
10.0.0.229:3306: Detected a running mysqld server. It must be uninstalled first, or you can also add it to ClusterControl.

Right, that IP is already used for our replication server. We should have used another, free IP. Let’s try that:

root@vagrant:~# s9s cluster --add-node --nodes 10.0.0.231 --cluster-id 1
Job with ID 9 registered.
root@vagrant:~# s9s job --list --job-id=9
ID CID STATE    OWNER GROUP CREATED  RDY  TITLE
 9   1 FINISHED dba   users 14:20:08 100% Add Node to Cluster
Total: 9

Managing

Let’s say we want to take a backup of our replication master. We can do that from the GUI but sometimes we may need to integrate it with external scripts. ClusterControl CLI would make a perfect fit for such case. Let’s check what clusters we have:

root@vagrant:~# s9s cluster --list --long
ID STATE   TYPE        OWNER GROUP NAME           COMMENT
 1 STARTED galera      dba   users PXC_Cluster_57 All nodes are operational.
 2 STARTED replication dba   users cluster_2      All nodes are operational.
Total: 2

Then, let’s check the hosts in our replication cluster, with cluster ID 2:

root@vagrant:~# s9s nodes --list --long --cluster-id=2
STAT VERSION       CID CLUSTER   HOST       PORT COMMENT
soM- 5.7.19-17-log   2 cluster_2 10.0.0.229 3306 Up and running
soS- 5.7.19-17-log   2 cluster_2 10.0.0.230 3306 Up and running
coC- 1.4.3.2145      2 cluster_2 10.0.2.15  9500 Up and running

As we can see, there are three hosts that ClusterControl knows about - two of them are MySQL hosts (10.0.0.229 and 10.0.0.230), the third one is the ClusterControl instance itself. Let’s print only the relevant MySQL hosts:

root@vagrant:~# s9s nodes --list --long --cluster-id=2 10.0.0.2*
STAT VERSION       CID CLUSTER   HOST       PORT COMMENT
soM- 5.7.19-17-log   2 cluster_2 10.0.0.229 3306 Up and running
soS- 5.7.19-17-log   2 cluster_2 10.0.0.230 3306 Up and running
Total: 3

In the “STAT” column you can see some characters there. For more information, we’d suggest to look into the manual page for s9s-nodes (man s9s-nodes). Here we’ll just summarize the most important bits. First character tells us about the type of the node: “s” means it’s regular MySQL node, “c” - ClusterControl controller. Second character describes the state of the node: “o” tells us it’s online. Third character - role of the node. Here “M” describes a master and “S” - a slave while “C” stands for controller. Final, fourth character tells us if the node is in maintenance mode. “-” means there’s no maintenance scheduled. Otherwise we’d see “M” here. So, from this data we can see that our master is a host with IP: 10.0.0.229. Let’s take a backup of it and store it on the controller.

root@vagrant:~# s9s backup --create --nodes=10.0.0.229 --cluster-id=2 --backup-method=xtrabackupfull --wait
Create Backup
| Job 12 FINISHED   [██████████] 100% Command ok

We can then verify if it indeed completed ok. Please note the “--backup-format” option which allows you to define which information should be printed:

root@vagrant:~# s9s backup --list --full --backup-format="Started: %B Completed: %E Method: %M Stored on: %S Size: %s %F\n" --cluster-id=2
Started: 15:29:11 Completed: 15:29:19 Method: xtrabackupfull Stored on: 10.0.0.229 Size: 543382 backup-full-2017-10-06_152911.xbstream.gz
Total 1
Severalnines
 
DevOps Guide to Database Management
Learn about what you need to know to automate and manage your open source databases

Monitoring

All databases have to be monitored. ClusterControl uses advisors to watch some of the metrics on both MySQL and the operating system. When a condition is met, a notification is sent. ClusterControl provides also an extensive set of graphs, both real-time as well as historical ones for post-mortem or capacity planning. Sometimes it would be great to have access to some of those metrics without having to go through the GUI. ClusterControl CLI makes it possible through the s9s-node command. Information on how to do that can be found in the manual page of s9s-node. We’ll show some examples of what you can do with CLI.

First of all, let’s take a look at the “--node-format” option to “s9s node” command. As you can see, there are plenty of options to print interesting content.

root@vagrant:~# s9s node --list --node-format "%N %T %R %c cores %u%% CPU utilization %fmG of free memory, %tMB/s of net TX+RX, %M\n""10.0.0.2*"
10.0.0.226 galera none 1 cores 13.823200% CPU utilization 0.503227G of free memory, 0.061036MB/s of net TX+RX, Up and running
10.0.0.227 galera none 1 cores 13.033900% CPU utilization 0.543209G of free memory, 0.053596MB/s of net TX+RX, Up and running
10.0.0.228 galera none 1 cores 12.929100% CPU utilization 0.541988G of free memory, 0.052066MB/s of net TX+RX, Up and running
10.0.0.226 proxysql  1 cores 13.823200% CPU utilization 0.503227G of free memory, 0.061036MB/s of net TX+RX, Process 'proxysql' is running.
10.0.0.231 galera none 1 cores 13.104700% CPU utilization 0.544048G of free memory, 0.045713MB/s of net TX+RX, Up and running
10.0.0.229 mysql master 1 cores 11.107300% CPU utilization 0.575871G of free memory, 0.035830MB/s of net TX+RX, Up and running
10.0.0.230 mysql slave 1 cores 9.861590% CPU utilization 0.580315G of free memory, 0.035451MB/s of net TX+RX, Up and running

With what we shown here, you probably can imagine some cases for automation. For example, you can watch the CPU utilization of the nodes and if it reaches some threshold, you can execute another s9s job to spin up a new node in the Galera cluster. You can also, for example, monitor memory utilization and send alerts if it passess some threshold.

The CLI can do more than that. First of all, it is possible to check the graphs from within the command line. Of course, those are not as feature-rich as graphs in the GUI, but sometimes it’s enough just to see a graph to find an unexpected pattern and decide if it is worth further investigation.

root@vagrant:~# s9s node --stat --cluster-id=1 --begin="00:00" --end="14:00" --graph=load 10.0.0.231
root@vagrant:~# s9s node --stat --cluster-id=1 --begin="00:00" --end="14:00" --graph=sqlqueries 10.0.0.231

During emergency situations, you may want to check resource utilization across the cluster. You can create a top-like output that combines data from all of the cluster nodes:

root@vagrant:~# s9s process --top --cluster-id=1
PXC_Cluster_57 - 14:38:01                                                                                                                                                               All nodes are operational.
4 hosts, 7 cores,  2.2 us,  3.1 sy, 94.7 id,  0.0 wa,  0.0 st,
GiB Mem : 2.9 total, 0.2 free, 0.9 used, 0.2 buffers, 1.6 cached
GiB Swap: 3 total, 0 used, 3 free,

PID   USER       HOST       PR  VIRT      RES    S   %CPU   %MEM COMMAND
 8331 root       10.0.2.15  20   743748    40948 S  10.28   5.40 cmon
26479 root       10.0.0.226 20   278532     6448 S   2.49   0.85 accounts-daemon
 5466 root       10.0.0.226 20    95372     7132 R   1.72   0.94 sshd
  651 root       10.0.0.227 20   278416     6184 S   1.37   0.82 accounts-daemon
  716 root       10.0.0.228 20   278304     6052 S   1.35   0.80 accounts-daemon
22447 n/a        10.0.0.226 20  2744444   148820 S   1.20  19.63 mysqld
  975 mysql      10.0.0.228 20  2733624   115212 S   1.18  15.20 mysqld
13691 n/a        10.0.0.227 20  2734104   130568 S   1.11  17.22 mysqld
22994 root       10.0.2.15  20    30400     9312 S   0.93   1.23 s9s
 9115 root       10.0.0.227 20    95368     7192 S   0.68   0.95 sshd
23768 root       10.0.0.228 20    95372     7160 S   0.67   0.94 sshd
15690 mysql      10.0.2.15  20  1102012   209056 S   0.67  27.58 mysqld
11471 root       10.0.0.226 20    95372     7392 S   0.17   0.98 sshd
22086 vagrant    10.0.2.15  20    95372     4960 S   0.17   0.65 sshd
 7282 root       10.0.0.226 20        0        0 S   0.09   0.00 kworker/u4:2
 9003 root       10.0.0.226 20        0        0 S   0.09   0.00 kworker/u4:1
 1195 root       10.0.0.227 20        0        0 S   0.09   0.00 kworker/u4:0
27240 root       10.0.0.227 20        0        0 S   0.09   0.00 kworker/1:1
 9933 root       10.0.0.227 20        0        0 S   0.09   0.00 kworker/u4:2
16181 root       10.0.0.228 20        0        0 S   0.08   0.00 kworker/u4:1
 1744 root       10.0.0.228 20        0        0 S   0.08   0.00 kworker/1:1
28506 root       10.0.0.228 20    95372     7348 S   0.08   0.97 sshd
  691 messagebus 10.0.0.228 20    42896     3872 S   0.08   0.51 dbus-daemon
11892 root       10.0.2.15  20        0        0 S   0.08   0.00 kworker/0:2
15609 root       10.0.2.15  20   403548    12908 S   0.08   1.70 apache2
  256 root       10.0.2.15  20        0        0 S   0.08   0.00 jbd2/dm-0-8
  840 root       10.0.2.15  20   316200     1308 S   0.08   0.17 VBoxService
14694 root       10.0.0.227 20    95368     7200 S   0.00   0.95 sshd
12724 n/a        10.0.0.227 20     4508     1780 S   0.00   0.23 mysqld_safe
10974 root       10.0.0.227 20    95368     7400 S   0.00   0.98 sshd
14712 root       10.0.0.227 20    95368     7384 S   0.00   0.97 sshd
16952 root       10.0.0.227 20    95368     7344 S   0.00   0.97 sshd
17025 root       10.0.0.227 20    95368     7100 S   0.00   0.94 sshd
27075 root       10.0.0.227 20        0        0 S   0.00   0.00 kworker/u4:1
27169 root       10.0.0.227 20        0        0 S   0.00   0.00 kworker/0:0
  881 root       10.0.0.227 20    37976      760 S   0.00   0.10 rpc.mountd
  100 root       10.0.0.227  0        0        0 S   0.00   0.00 deferwq
  102 root       10.0.0.227  0        0        0 S   0.00   0.00 bioset
11876 root       10.0.0.227 20     9588     2572 S   0.00   0.34 bash
11852 root       10.0.0.227 20    95368     7352 S   0.00   0.97 sshd
  104 root       10.0.0.227  0        0        0 S   0.00   0.00 kworker/1:1H

When you take a look at the top, you’ll see CPU and memory statistics aggregated across the whole cluster.

root@vagrant:~# s9s process --top --cluster-id=1
PXC_Cluster_57 - 14:38:01                                                                                                                                                               All nodes are operational.
4 hosts, 7 cores,  2.2 us,  3.1 sy, 94.7 id,  0.0 wa,  0.0 st,
GiB Mem : 2.9 total, 0.2 free, 0.9 used, 0.2 buffers, 1.6 cached
GiB Swap: 3 total, 0 used, 3 free,

Below you can find the list of processes from all of the nodes in the cluster.

PID   USER       HOST       PR  VIRT      RES    S   %CPU   %MEM COMMAND
 8331 root       10.0.2.15  20   743748    40948 S  10.28   5.40 cmon
26479 root       10.0.0.226 20   278532     6448 S   2.49   0.85 accounts-daemon
 5466 root       10.0.0.226 20    95372     7132 R   1.72   0.94 sshd
  651 root       10.0.0.227 20   278416     6184 S   1.37   0.82 accounts-daemon
  716 root       10.0.0.228 20   278304     6052 S   1.35   0.80 accounts-daemon
22447 n/a        10.0.0.226 20  2744444   148820 S   1.20  19.63 mysqld
  975 mysql      10.0.0.228 20  2733624   115212 S   1.18  15.20 mysqld
13691 n/a        10.0.0.227 20  2734104   130568 S   1.11  17.22 mysqld

This can be extremely useful if you need to figure out what’s causing the load and which node is the most affected one.

Hopefully, the CLI tool makes it easier for you to integrate ClusterControl with external scripts and infrastructure orchestration tools. We hope you’ll enjoy using this tool and if you have any feedback on how to improve it, feel free to let us know.

The Galera Cluster & Severalnines Teams Present: How to Manage Galera Cluster with ClusterControl

$
0
0

Join us on November 14th 2017 as we combine forces with the Codership Galera Cluster Team to talk about how to manage Galera Cluster using ClusterControl!

Galera Cluster has become one of the most popular high availability solution for MySQL and MariaDB; and ClusterControl is the de facto automation and management system for Galera Cluster.

We’ll be joined by Seppo Jaakola, CEO of Codership - Galera Cluster, and together, we’ll demonstrate what it is that makes Galera Cluster such a popular high availability solution for MySQL and MariaDB and how to best manage it with ClusterControl.

We’ll discuss the latest features of Galera Cluster with Seppo, one of the creators of Galera Cluster. We’ll also demo how to automate it all from deployment, monitoring, backups, failover, recovery, rolling upgrades and scaling using the new ClusterControl CLI.

Sign up below!

Date, Time & Registration

Europe/MEA/APAC

Tuesday, November 14th at 09:00 GMT / 10:00 CET (Germany, France, Sweden)

Register Now

North America/LatAm

Tuesday, November 14th at 09:00 PT (US) / 12:00 ET (US)

Register Now

Agenda

  • Introduction
    • About Codership, the makers of Galera Cluster
    • About Severalnines, the makers of ClusterControl
  • What’s new with Galera Cluster
    • Core feature set overview
    • The latest features
    • What’s coming up
  • ClusterControl for Galera Cluster
    • Deployment
    • Monitoring
    • Management
    • Scaling
  • Live Demo
  • Q&A

Speakers

Seppo Jaakola, Founder of Codership, has over 20 years experience in software engineering. He started his professional career in Digisoft and Novo Group Oy working as a software engineer in various technical projects. He then worked for 10 years in Stonesoft Oy as a Project Manager in projects dealing with DBMS development, data security and firewall clustering. In 2003, Seppo Jaakola joined Continuent Oy, where he worked as team leader for MySQL clustering product. This position linked together his earlier experience in DBMS research and distributed computing. Now he’s applying his years of experience and administrative skills to steer Codership to a right course. Seppo Jaakola has MSc degree in Software Engineering from Helsinki University of Technology.

Krzysztof Książek, Senior Support Engineer at Severalnines, is a MySQL DBA with experience managing complex database environments for companies like Zendesk, Chegg, Pinterest and Flipboard.

How to Stop or Throttle SST Operation on a Galera Cluster

$
0
0

State Snapshot Transfer (SST) is one of the two ways used by Galera to perform initial syncing when a node is joining a cluster, until the node is declared as synced and part of the “primary component”. Depending on the dataset size and workload, SST could be lightning fast, or an expensive operation which will bring your database service down on its knees.

SST can be performed using 3 different methods:

  • mysqldump
  • rsync (or rsync_wan)
  • xtrabackup (or xtrabackup-v2, mariabackup)

Most of the time, xtrabackup-v2 and mariabackup are the preferred options. We rarely see people running on rsync or mysqldump in production clusters.

The Problem

When SST is initiated, there are several processes triggered on the joiner node, which are executed by the "mysql" user:

$ ps -fu mysql
UID         PID   PPID  C STIME TTY          TIME CMD
mysql    117814 129515  0 13:06 ?        00:00:00 /bin/bash -ue /usr//bin/wsrep_sst_xtrabackup-v2 --role donor --address 192.168.55.173:4444/xtrabackup_sst//1 --socket /var/lib/mysql/mysql.sock --datadir
mysql    120036 117814 15 13:06 ?        00:00:06 innobackupex --no-version-check --tmpdir=/tmp/tmp.pMmzIlZJwa --user=backupuser --password=x xxxxxxxxxxxxxx --socket=/var/lib/mysql/mysql.sock --galera-inf
mysql    120037 117814 19 13:06 ?        00:00:07 socat -u stdio TCP:192.168.55.173:4444
mysql    129515      1  1 Oct27 ?        01:11:46 /usr/sbin/mysqld --wsrep_start_position=7ce0e31f-aa46-11e7-abda-56d6a5318485:4949331

While on the donor node:

mysql     43733      1 14 Oct16 ?        03:28:47 /usr/sbin/mysqld --wsrep-new-cluster --wsrep_start_position=7ce0e31f-aa46-11e7-abda-56d6a5318485:272891
mysql     87092  43733  0 14:53 ?        00:00:00 /bin/bash -ue /usr//bin/wsrep_sst_xtrabackup-v2 --role donor --address 192.168.55.172:4444/xtrabackup_sst//1 --socket /var/lib/mysql/mysql.sock --datadir /var/lib/mysql/  --gtid 7ce0e31f-aa46-11e7-abda-56d6a5318485:2883115 --gtid-domain-id 0
mysql     88826  87092 30 14:53 ?        00:00:05 innobackupex --no-version-check --tmpdir=/tmp/tmp.LDdWzbHkkW --user=backupuser --password=x xxxxxxxxxxxxxx --socket=/var/lib/mysql/mysql.sock --galera-info --stream=xbstream /tmp/tmp.oXDumYf392
mysql     88827  87092 30 14:53 ?        00:00:05 socat -u stdio TCP:192.168.55.172:4444

SST against a large dataset (hundreds of GBytes) is no fun. Depending on the hardware, network and workload, it may take hours to complete. Server resources may be saturated during the operation. Despite throttling is supported in SST (only for xtrabackup and mariabackup) using --rlimit and --use-memory options, we are still exposed to a degraded cluster when you are running out of majority active nodes. For example, if you are unlucky enough to find yourself with only one out of three nodes running. Therefore, you are advised to perform SST during quiet hours. You can, however, avoid SST by taking some manual steps, as described in this blog post.

Stopping an SST

Stopping an SST needs to be done on both the donor and the joiner nodes. The joiner triggers SST after determining how big the gap is when comparing the local Galera seqno with cluster's seqno. It executes the wsrep_sst_{wsrep_sst_method} command. This will be picked by the chosen donor, which will start streaming out data to the joiner. A donor node has no capabilities of refusing to serve snapshot transfer, once selected by Galera group communication, or by the value defined in wsrep_sst_donor variable. Once the syncing has started and you want to revert the decision, there is no single command to stop the operation.

The basic principle when stopping an SST is to:

  • Make the joiner look dead from a Galera group communication point-of-view (shutdown, fence, block, reset, unplug cable, blacklist, etc)
  • Kill the SST processes on the donor

One would think that killing the innobackupex process (kill -9 {innobackupex PID}) on the donor would be enough, but that is not the case. If you kill the SST processes on donor (or joiner) without fencing off the joiner, Galera still can see the joiner as active and will mark the SST process as incomplete, thus respawning a new set of processes to continue or start over again. You will be back to square one. This is the expected behaviour of /usr/bin/wsrep_sst_{method} script to safeguard SST operation which is vulnerable to timeouts (e.g., if it is long-running and resource intensive).

Let's look at an example. We have a crashed joiner node that we would like to rejoin the cluster. We would start by running the following command on the joiner:

$ systemctl start mysql # or service mysql start

A minute later, we found out that the operation is too heavy at that particular moment, and decided to postpone it later during low traffic hours. The most straightforward way to stop an xtrabackup-based SST method is by simply shutting down the joiner node, and kill the SST-related processes on the donor node. Alternatively, you can also block the incoming ports on the joiner by running the following iptables command on the joiner:

$ iptables -A INPUT -p tcp --dport 4444 -j DROP
$ iptables -A INPUT -p tcp --dport 4567:4568 -j DROP

Then on the donor, retrieve the PID of SST processes (list out the processes owned by "mysql" user):

$ ps -u mysql
   PID TTY          TIME CMD
117814 ?        00:00:00 wsrep_sst_xtrab
120036 ?        00:00:06 innobackupex
120037 ?        00:00:07 socat
129515 ?        01:11:47 mysqld

Finally, kill them all except the mysqld process (you must be extremely careful to NOT kill the mysqld process on the donor!):

$ kill -9 117814 120036 120037

Then, on the donor MySQL error log, you should notice the following line appearing after ~100 seconds:

2017-10-30 13:24:08 139722424837888 [Warning] WSREP: Could not find peer: 42b85e82-bd32-11e7-87ae-eff2b8dd2ea0
2017-10-30 13:24:08 139722424837888 [Warning] WSREP: 1.0 (192.168.55.172): State transfer to -1.-1 (left the group) failed: -32 (Broken pipe)

At this point, the donor should return to the "synced" state as reported by wsrep_local_state_comment and the SST process is completely stopped. The donor is back to its operational state and is able to serve clients in full capacity.

For the cleanup process on the joiner, you can simply flush the iptables chain:

$ iptables -F

Or simply remove the rules with -D flag:

$ iptables -D INPUT -p tcp --dport 4444 -j DROP
$ iptables -D INPUT -p tcp --dport 4567:4568 -j DROP

The similar approach can be used with other SST methods like rsync, mariabackup and mysqldump.

Throttling an SST (xtrabackup method only)

Depending on how busy the donor is, it's a good approach to throttle the SST process so it won't impact the donor significantly. We've seen a number of cases where, during catastrophic failures, users were desperate to bring back a failed cluster as a single bootstrapped node, and let the rest of the members catch up later. This attempt reduces the downtime from the application side, however, it creates additional burden on this “one-node cluster”, while the remaining members are still down or recovering.

Xtrabackup can be throttled with --throttle=<rate of IO/sec> to simply limit the number of IO operation if you are afraid that it will saturate your disks, but this option is only applicable when running xtrabackup as a backup process, not as an SST operator. Similar options are available with rlimit (rate limit) and can be combined with --use-memory to limit the RAM usage. By setting up values under [sst] directive inside the MySQL configuration file, we can ensure that the SST operation won't put too much load on the donor, even though it can take longer to complete. On the donor node, set the following:

[sst]
rlimit=128k
inno-apply-opts="--use-memory=200M"

More details on the Percona Xtrabackup SST documentation page.

However, there is a catch. The process could be so slow that it will never catch up with the transaction logs that InnoDB is writing, so SST might never complete. Generally, this situation is very uncommon, unless if you really have a very write-intensive workload or you allocate very limited resources to SST.

Conclusions

SST is critical but heavy, and could potentially be a long-running operation depending on the dataset size and network throughput between the nodes. Regardless of the consequences, there are still possibilities to stop the operation so we can have a better recovery plan at a better time.

HAProxy Connections vs MySQL Connections - What You Should Know

$
0
0

Having a load balancer or reverse proxy in front of your MySQL or MariaDB server does add a little bit of complexity to your database setup, which might lead to some, things behaving differently. Theoretically, a load balancer which sits in front of MySQL servers (for example an HAProxy in front of a Galera Cluster) should just act like a connection manager and distribute the connections to the backend servers according to some balancing algorithm. MySQL, on the other hand, has its own way of managing client connections. Ideally, we would need to configure these two components together so as to avoid unexpected behaviours, and narrow down the troubleshooting surface when debugging issues.

If you have such setup, it is important to understand these components as they can impact the overall performance of your database service. In this blog post, we will dive into MySQL's max_connections and HAProxy maxconn options respectively. Note that timeout is another important parameter that we should know, but we are going to cover that in a separate post.

MySQL's Max Connections

The number of connections permitted to a MySQL server is controlled by the max_connections system variable. The default value is 151 (MySQL 5.7).

To determine a good number for max_connections, the basic formulas are:

Where,

And,

By using the above formulas, we can calculate a suitable max_connections value for this particular MySQL server. To start the process, stop all connections from clients and restart the MySQL server. Ensure you only have the minimum number of processes running at that particular moment. You can use 'mysqladmin' or 'SHOW PROCESSLIST' for this purpose:

$ mysqladmin -uroot -p processlist
+--------+------+-----------+------+---------+------+-------+------------------+----------+
| Id     | User | Host      | db   | Command | Time | State | Info             | Progress |
+--------+------+-----------+------+---------+------+-------+------------------+----------+
| 232172 | root | localhost | NULL | Query   |    0 | NULL  | show processlist |    0.000 |
+--------+------+-----------+------+---------+------+-------+------------------+----------+
1 row in set (0.00 sec)

From the above output, we can tell that only one user is connected to the MySQL server which is root. Then, retrieve the available RAM (in MB) of the host (look under 'available' column):

$ free -m
              total        used        free      shared  buff/cache   available
Mem:           3778        1427         508         148        1842        1928
Swap:          2047           4        2043

Just for the info, the 'available' column gives an estimate of how much memory is available for starting new applications, without swapping (only available in kernel 3.14+).

Then, specify the available memory, 1928 MB in the following statement:

mysql> SELECT ROUND((1928 - (ROUND((@@innodb_buffer_pool_size + @@innodb_additional_mem_pool_size + @@innodb_log_buffer_size + @@query_cache_size + @@tmp_table_size + @@key_buffer_size) / 1024 / 1024))) / (ROUND(@@read_buffer_size + @@read_rnd_buffer_size + @@sort_buffer_size + @@thread_stack + @@join_buffer_size + @@binlog_cache_size) / 1024 / 1024)) AS 'Possible Max Connections';
+--------------------------+
| Possible Max Connections |
+--------------------------+
|                      265 |
+--------------------------+

From this example, we can have up to 265 MySQL connections simultaneously according to the available RAM the host has. It doesn't make sense to configure a higher value than that. Then, append the following line inside MySQL configuration file, under the [mysqld] directive:

max_connections = 265

Restart the MySQL service to apply the change. When the total simultaneous connections reaches 265, you would get a "Too many connections" error when trying to connect to the mysqld server. This means that all available connections are in use by other clients. MySQL actually permits max_connections+1 clients to connect. The extra connection is reserved for use by accounts that have the SUPER privilege. So if you face this error, you should try to access the server as a root user (or any other SUPER user) and look at the processlist to start the troubleshooting.

HAProxy's Max Connections

HAProxy has 3 types of max connections (maxconn) - global, defaults/listen and default-server. Assume an HAProxy instance configured with two listeners, one for multi-writer listening on port 3307 (connections are distributed to all backend MySQL servers) and another one is single-writer on port 3308 (connections are forwarded to a single MySQL server):

global
    ...
    maxconn 2000 #[a]
    ...
defaults
    ...
    maxconn 3 #[b]
    ...
listen mysql_3307
    ...
    maxconn 8 #[c]
    balance leastconn
    default-server port 9200 maxqueue 10 weight 10 maxconn 4 #[d]
    server db1 192.168.55.171 check
    server db2 192.168.55.172 check
    server db3 192.168.55.173 check
listen mysql_3308
    ...
    default-server port 9200 maxqueue 10 weight 10 maxconn 5 #[e]
    server db1 192.168.55.171 check
    server db2 192.168.55.172 check backup #[f]

Let’s look at the meaning of some of the configuration lines:

global.maxconn [a]

The total number of concurrent connections that are allowed to connect to this HAProxy instance. Usually, this value is the highest value of all. In this case, HAProxy will accept a maximum of 2000 connections at a time and distribute them to all listeners defined in the HAProxy process, or worker (you can run multiple HAProxy processes using nbproc option).

HAProxy will stop accepting connections when this limit is reached. The "ulimit-n" parameter is automatically adjusted to this value. Since sockets are considered equivalent to files from the system perspective, the default file descriptors limit is rather small. You will probably want to raise the default limit by tuning the kernel for file descriptors.

defaults.maxconn [b]

Defaults maximum connections value for all listeners. It doesn't make sense if this value is higher than global.maxconn.

If "maxconn" line is missing under the "listen" stanza (listen.maxconn), the listener will obey this value. In this case, mysql_3308 listener will get maximum of 3 connections at a time. To be safe, set this value equal to global.maxconn, divided by the number of listeners. However, if you would like to prioritize other listeners to have more connections, use listen.maxconn instead.

listen.maxconn [c]

The maximum connections allowed for the corresponding listener. The listener takes precedence over defaults.maxconn if specified. It doesn't make sense if this value is higher than global.maxconn.

For a fair distribution of connections to backend servers like in the case of a multi-writer listener (mysql_3307), set this value as listen.default-server.maxconn multiply by the number of backend servers. In this example, a better value should be 12 instead of 8 [c]. If we chose to stick with this configuration, db1 and db2 are expected to receive a maximum of 3 connections each, while db3 will receive a maximum of 2 connections (due to leastconn balancing), which amounts to 8 connections in total. It won't hit the limit as specified in [d].

For single-writer listener (mysql_3308) where connections should be allocated to one and only one backend server at a time, set this value to be the same or higher than listen.default-server.maxconn.

listen.default-server.maxconn [d][e]

This is the maximum number of connections that every backend server can receive at a time. It doesn't make sense if this value is higher than listen.maxconn or defaults.maxconn. This value should be lower or equal to MySQL's max_connections variable. Otherwise, you risk exhausting the connections to the backend MySQL server, especially when MySQL's timeout variables are configured lower than HAProxy's timeouts.

In this example, we've set each MySQL server to only get a maximum of 4 connections at a time for multi-writer Galera nodes [d]. While the single-writer Galera node will get a maximum of 3 connections at a time, due to the limit that applies from [b]. Since we specified "backup" [f] to the other node, the active node will at once get all 3 connections allocated to this listener.

The above explanation can be illustrated in the following diagram:

To sum up the connections distribution, db1 is expected to get a maximum number of 6 connections (3 from 3307 + 3 from 3308). The db2 will get 3 connections (unless if db1 goes down, where it will get additional 3) and db3 will stick to 2 connections regardless of topology changes in the cluster.

Connection Monitoring with ClusterControl

With ClusterControl, you can monitor MySQL and HAProxy connection usage from the UI. The following screenshot provides a summary of the MySQL connection advisor (ClusterControl -> Performance -> Advisors) where it monitors the current and ever used MySQL connections for every server in the cluster:

For HAProxy, ClusterControl integrates with HAProxy stats page to collect metrics. These are presented under the Nodes tab:

From the above screenshot, we can tell that each backend server on multi-writer listener gets a maximum of 8 connections. 4 concurrent sessions are running. These are highlighted in the top red square, while the single-writer listener is serving 2 connections and forwarding them to a single node respectively.

Conclusion

Configuring the maximum connections for HAProxy and MySQL server is important to ensure good load distribution to our database servers, and protect the MySQL servers from overloading or exhausting its connections.


Zero Downtime Network Migration with MySQL Galera Cluster using Relay Node

$
0
0

Galera Cluster’s automatic node provisioning simplifies the complexity of scaling out a database cluster with guaranteed data consistency. SST and IST improve the usability of initial data synchronization without the need to manually backup the database and copy it to the new node. Combine this with Galera's ability to tolerate different network setups (e.g, WAN replication), we can now migrate the database between different isolated networks with zero service disruption.

In this blog post, we are going to look into how to migrate our MySQL Galera Cluster without downtime. We will move the database from Amazon Web Service (AWS) EC2 to Google Cloud Platform (GCP) Compute Engine, with the help of a relay node. Note that we had a similar blog post in the past, but this one uses a different approach.

The following diagram simplifies our migration plan:

Old Site Preparation

Since both sites cannot communicate with each other due to security group or VPC isolation, we need to have a relay node to bridge these two sites together. This node can be located on either site, but must able to connect to one or more nodes on the other side on port 3306 (MySQL), 4444 (SST), 4567 (gcomm) and 4568 (IST). Here is what we already have, and how we will scale the old site:

You can also use an existing Galera node (e.g, the third node) as the relay node, as long as it has connectivity to the other side. The downside is that the cluster capacity will be reduced to two, because one node will be used for SST and relaying the Galera replication stream between sites. Depending on the dataset size and connection between sites, this can introduce database reliability issues on the current cluster.

So, we are going to use a fourth node, to reduce the risk on the current production cluster when syncing to the other side. First, create a new instance in the AWS Dashboard with a public IP address (so it can talk to the outside world) and allow the required Galera communication ports (TCP 3306, 4444, 4567-4568).

Deploy the fourth node (relay node) on the old site. If you are using ClusterControl, you can simply use "Add Node" feature to scale the cluster out (don't forget to setup passwordless SSH from ClusterControl node to this fourth host beforehand):

Ensure the relay node is in sync with the current cluster and is able to communicate to the other side.

From the new site, we are going to connect to the relay node since this is the only node that has connectivity to the outside world.

New Site Deployment

On the new site, we will deploy a similar setup with one ClusterControl node and three-node Galera Cluster. Both sites must use the same MySQL version. Here is our architecture on the new site:

With ClusterControl, the new cluster deployment is just a couple of clicks away and a free feature in the community edition. Go to ClusterControl -> Deploy Database Cluster -> MySQL Galera and follow the deployment wizard:

Click Deploy and monitor the progress under Activity -> Jobs -> Create Cluster. Once done, you should have the following on the dashboard:

At this point, you are having two separate Galera Clusters - 4 nodes at the old site and 3 nodes at the new site.

Connecting Both Sites

On the new site (GCP), pick one node to communicate with the relay node on the old site. We are going to pick galera-gcp1 as the connector to the relay node (galera-aws4). The following diagram illustrates our bridging plan:

The important things to configure are the following parameters:

  • wsrep_sst_donor: The wsrep_node_name of the donor node. On galera-gcp1, set the donor to galera-aws4.
  • wsrep_sst_auth: SST user credentials in username:password format must follow the old site (AWS).
  • wsrep_sst_receive_address: The IP address that will receive SST on the joiner node. On galera-gcp1, set this to the public IP address of this node.
  • wsrep_cluster_address: Galera connection string. On galera-gcp1, add the public IP address of galera-aws4.
  • wsrep_provider_options:
    • gmcast.segment: Default is 0. Set a different integer on all nodes in GCP.
  1. On the relay node (galera-aws4), retrieve the wsrep_node_name:

    $ mysql -uroot -p -e 'SELECT @@wsrep_node_name'
    Enter password:
    +-------------------+
    | @@wsrep_node_name |
    +-------------------+
    | 10.0.0.13         |
    +-------------------+
  2. On galera-gcp1's my.cnf, set wsrep_sst_donor value to the relay node's wsrep_node_name and wsrep_sst_receive_address to the public IP address of galera-gcp1:

    wsrep_sst_donor=10.0.0.13
    wsrep_sst_receive_address=35.197.136.232
  3. On all nodes on GCP, ensure the wsrep_sst_auth value is identical following the old site (AWS) and change the Galera segment to 1 (so Galera knows both sites are in different networks):

    wsrep_sst_auth=backupuser:mysecretP4ssW0rd
    wsrep_provider_options="base_port=4567; gcache.size=512M; gmcast.segment=1"
  4. On galera-gcp1, set the wsrep_cluster_address to include the relay node's public IP address:

    wsrep_cluster_address=gcomm://10.148.0.2,10.148.0.3,10.148.0.4,13.229.247.149

    **Only modify wsrep_cluster_address on galera-gcp1. Don't modify this parameter on galera-gcp2 and galera-gcp3.

  5. Stop all nodes on GCP. If you are using ClusterControl, go to Cluster Actions dropdown -> Stop Cluster. You are also required to turn off automatic recovery at both cluster and node levels, so ClusterControl won't try to recover the failed nodes.

  6. Now the syncing part. Start galera-gcp1. You can see from the MySQL error log on the donor node that SST is initiated between the the relay node (10.0.0.13) using a public address on galera-gcp1 (35.197.136.232):

    2017-12-19T13:58:04.765238Z 0 [Note] WSREP: Initiating SST/IST transfer on DONOR side (wsrep_sst_xtrabackup-v2 --role 'donor' --address '35.197.136.232:4444/xtrabackup_sst//1' --socket '/var/lib/mysql/m
    ysql.sock' --datadir '/var/lib/mysql/' --defaults-file '/etc/my.cnf' --defaults-group-suffix '''' --gtid 'df23adb8-b567-11e7-8c50-a386c8cc7711:151181')
    2017-12-19T13:58:04.765468Z 5 [Note] WSREP: DONOR thread signaled with 0
            2017-12-19T13:58:15.158757Z WSREP_SST: [INFO] Streaming the backup to joiner at 35.197.136.232 4444
    2017-12-19T13:58:52.512143Z 0 [Note] WSREP: 1.0 (10.0.0.13): State transfer to 0.0 (10.148.0.2) complete.

    Take note that, at this point of time, galera-gcp1 will be flooded with following lines:

    2017-12-19T13:32:47.111002Z 0 [Note] WSREP: (ed66842b, 'tcp://0.0.0.0:4567') connection to peer 00000000 with addr tcp://10.0.0.118:4567 timed out, no messages seen in PT3S
    2017-12-19T13:32:48.111123Z 0 [Note] WSREP: (ed66842b, 'tcp://0.0.0.0:4567') connection to peer 00000000 with addr tcp://10.0.0.90:4567 timed out, no messages seen in PT3S
    2017-12-19T13:32:50.611462Z 0 [Note] WSREP: (ed66842b, 'tcp://0.0.0.0:4567') connection to peer 00000000 with addr tcp://10.0.0.25:4567 timed out, no messages seen in PT3S

    You can safely ignore this warning since galera-gcp1 keeps trying to see the remaining nodes beyond the relay node on AWS.

  7. Once SST on galera-gcp1 completes, ClusterControl on GCE won't be able to connect the database nodes, due to missing GRANTs (existing GRANTs have been overridden after syncing from AWS). So here is what we need to do after SST completes on galera-gcp1:

    mysql> GRANT ALL PRIVILEGES ON *.* TO cmon@'10.148.0.5' IDENTIFIED BY 'cmon' WITH GRANT OPTION;

    Once this is done, ClusterControl will correctly report the state of galera-gcp1 as highlighted below:

  8. The last part is to start the remaining galera-gcp2 and galera-gcp3, one node at a time. Go to ClusterControl -> Nodes -> pick the node -> Start Node. Once all nodes are synced, you should get 7 as the cluster size:

The cluster is now operating on both sites and scaling out is complete.

Decommissioning

Once the migration completes and all nodes are in synced, you can start to switch your application to the new cluster on GCP:

At this point MySQL data is replicated to all nodes until decommissioning. The replication performance will be as good as the farthest node in the cluster permits. The relay node is critical, as it broadcasts writesets to the other side. From the application standpoint, it's recommended to write to only one site at a time, which means you will have to start redirecting reads/writes from AWS and serve them from GCP cluster instead.

To decommission the old database nodes and move to the cluster on GCP, we have to perform a graceful shutdown (one node at a time) on AWS. It is important to shut down the nodes gracefully, since the AWS site holds the majority number of nodes (4/7) for this cluster. Shutting them down all at once will cause the cluster on GCP to go into non-primary state, forcing the cluster to refuse operation. Make sure the last node to shutdown on the AWS side is the relay node.

Don't forget to update the following parameters on galera-gcp1 accordingly:

  • wsrep_cluster_address - Remove the relay node public IP address.
  • wsrep_sst_donor - Comment this line. Let Galera auto pick the donor.
  • wsrep_sst_receive_address - Comment this line. Let Galera auto pick the receiving interface.

Your Galera Cluster is now running on a completely new platform, hosts and network without a second of downtime to your database service during migration. How cool is that?

Ten Tips on How to Achieve MySQL and MariaDB Security

$
0
0

Security of data is a top priority these days. Sometimes it’s enforced by external regulations like PCI-DSS or HIPAA, sometimes it’s because you care about your customers’ data and your reputation. There are numerous aspects of security that you need to keep in mind - network access, operating system security, grants, encryption and so on. In this blog post, we’ll give you 10 tips on what to look at when securing your MySQL or MariaDB setup.

1. Remove users without password

MySQL used to come with a set of pre-created users, some of which can connect to the database without a password or, even worse, anonymous users. This has changed in MySQL 5.7 which, by default, comes only with a root account that uses the password you choose at installation time. Still, there are MySQL installations which were upgraded from previous versions and these installations keep the legacy users. Also, MariaDB 10.2 on Centos 7 comes with anonymous users:

MariaDB [(none)]> select user, host, password from mysql.user where user like '';
+------+-----------------------+----------+
| user | host                  | password |
+------+-----------------------+----------+
|      | localhost             |          |
|      | localhost.localdomain |          |
+------+-----------------------+----------+
2 rows in set (0.00 sec)

As you can see, those are limited only to access from localhost but regardless, you do not want to have users like that. While their privileges are limited, they still can run some commands which may show more information about the database - for example, the version may help identify further vectors of attack.

[root@localhost ~]# mysql -uanonymous_user
Welcome to the MariaDB monitor.  Commands end with ; or \g.
Your MariaDB connection id is 19
Server version: 10.2.11-MariaDB MariaDB Server
Copyright (c) 2000, 2017, Oracle, MariaDB Corporation Ab and others.
Type 'help;' or '\h' for help. Type '\c' to clear the current input statement.
MariaDB [(none)]> SHOW GRANTS\G
*************************** 1. row ***************************
Grants for @localhost: GRANT USAGE ON *.* TO ''@'localhost'
1 row in set (0.00 sec)
MariaDB [(none)]> \s
--------------
mysql  Ver 15.1 Distrib 10.2.11-MariaDB, for Linux (x86_64) using readline 5.1
Connection id:        19
Current database:
Current user:        anonymous_user@localhost
SSL:            Not in use
Current pager:        stdout
Using outfile:        ''
Using delimiter:    ;
Server:            MariaDB
Server version:        10.2.11-MariaDB MariaDB Server
Protocol version:    10
Connection:        Localhost via UNIX socket
Server characterset:    latin1
Db     characterset:    latin1
Client characterset:    utf8
Conn.  characterset:    utf8
UNIX socket:        /var/lib/mysql/mysql.sock
Uptime:            12 min 14 sec
Threads: 7  Questions: 36  Slow queries: 0  Opens: 17  Flush tables: 1  Open tables: 11  Queries per second avg: 0.049
--------------

Please note that users with very simple passwords are almost as insecure as users without any password. Passwords like “password” or “qwerty” are not really helpful.

2. Tight remote access

First of all, remote access for superusers - this is taken care of by default when installing the latest MySQL (5.7) or MariaDB (10.2) - only local access is available. Still, it’s pretty common to see superusers being available for various reasons. The most common one, probably because the database is managed by humans who want to make their job easier, so they’d add remote access to their databases. This is not a good approach as remote access makes it easier to exploit potential (or verified) security vulnerabilities in MySQL - you don’t need to get a connection to the host first.

Another step - make sure that every user can connect to MySQL only from specific hosts. You can always define several entries for the same user (myuser@host1, myuser@host2), this should help to reduce a need for wildcards (myuser@’%’).

3. Remove test database

The test database, by default, is available to every user, especially to the anonymous users. Such users can create tables and write to them. This can potentially become a problem on its own - any writes would add some overhead and reduce database performance. Currently, after the default instalation, only MariaDB 10.2 on Centos 7 is affected by this - Oracle MySQL 5.7 and Percona Server 5.7 do not have the ‘test’ schema available.

[root@localhost ~]# mysql -uanonymous_user
Welcome to the MariaDB monitor.  Commands end with ; or \g.
Your MariaDB connection id is 13
Server version: 10.2.11-MariaDB MariaDB Server
Copyright (c) 2000, 2017, Oracle, MariaDB Corporation Ab and others.
Type 'help;' or '\h' for help. Type '\c' to clear the current input statement.
MariaDB [(none)]> SHOW GRANTS\G
*************************** 1. row ***************************
Grants for @localhost: GRANT USAGE ON *.* TO ''@'localhost'
1 row in set (0.00 sec)
MariaDB [(none)]> USE test;
Database changed
MariaDB [test]> CREATE TABLE testtable (a INT);
Query OK, 0 rows affected (0.01 sec)
MariaDB [test]> INSERT INTO testtable VALUES (1), (2), (3);
Query OK, 3 rows affected (0.01 sec)
Records: 3  Duplicates: 0  Warnings: 0
MariaDB [test]> SELECT * FROM testtable;
+------+
| a    |
+------+
|    1 |
|    2 |
|    3 |
+------+
3 rows in set (0.00 sec)

Of course, it may still happen that your MySQL 5.7 has been upgraded from previous versions in which the ‘test’ schema was not removed - you should take care of this and check if you have it created.

4. Obfuscate access to MySQL

It is well known that MySQL runs on port 3306, and its superuser is called ‘root’. To make things harder, it is quite simple to change this. To some extent, this is an example of security through obscurity but it may at least stop automated attempts to get access to the ‘root’ user. To change port, you need to edit my.cnf and set ‘port’ variable to some other value. As for users - after MySQL is installed, you should create a new superuser (GRANT ALL … WITH GRANT OPTION) and then remove existing ‘root@’ accounts.

5. Network security

Ideally, MySQL would be not available through the network and all connections would be handled locally, through the Unix socket. In some setups, this is possible - in that case you can add the ‘skip-networking’ variable in my.cnf. This will prevent MySQL from using any TCP/IP communication, only Unix socket would be available on Linux (Named pipes and shared memory on Windows hosts).

Most of the time though, such tight security is not feasible. In that case you need to find another solution. First, you can use your firewall to allow traffic only from specific hosts to the MySQL server. For instance, application hosts (although they should be ok with reaching MySQL through proxies), the proxy layer, and maybe a management server. Other hosts in your network probably do not need direct access to the MySQL server. This will limit possibilities of attack on your database, in case some hosts in your network would be compromised.

If you happen to use proxies which allow regular expression matching for queries, you can use them to analyze the SQL traffic and block suspicious queries. Most likely your application hosts shouldn’t run “DELETE * FROM your_table;” on a regular basis. If it is needed to remove some data, it can be executed by hand, locally, on the MySQL instance. You can create such rules using something like ProxySQL: block, rewrite, redirect such queries. MaxScale also gives you an option to block queries based on regular expressions.

6. Audit plugins

If you are interested in collecting data on who executed what and when, there are several audit plugins available for MySQL. If you use MySQL Enterprise, you can use MySQL Enterprise Audit which is an extension to MySQL Enterprise. Percona and MariaDB also have their own version of audit plugins. Lastly, McAfee plugin for MySQL can also be used with different versions of MySQL. Generally speaking, those plugins collect more or less the same data - connect and disconnect events, queries executed, tables accessed. All of this contains information about which user participated in such event, from what host it logged from, when did it happen and so on. The output can be XML or JSON, so it’s much easier to parse it than parsing general log contents (even though the data is rather similar). Such output can also be sent to syslog and, further, some sort of log server for processing and analysis.

7. Disable LOAD DATA LOCAL INFILE

If both server and client has the ability to run LOAD DATA LOCAL INFILE, a client will be able to load data from a local file to a remote MySQL server. This, potentially, can help to read files the client has access to - for example, on an application server, one could access any file that the HTTP server has access to. To avoid it, you need to set local-infile=0 in the my.cnf

8. File privileges

You have to keep in mind that MySQL security also depends on the operating system setup. MySQL stores data in the form of files. The MySQL server writes plenty of information to logs. Sometimes this information contains data - slow query log, general log or binary log, for example. You need to make sure that this information is safe and accesible only to users who have to access it. Typically it means that only the root and the user under whose rights MySQL is running, should have access to all MySQL-related files. Most of the time it’s a dedicated user called ‘mysql’. You should check MySQL configuration files and all the logs generated by MySQL and verify that they are not readable by other users.

ClusterControl
Single Console for Your Entire Database Infrastructure
Find out what else is new in ClusterControl

9. SSL and Encryption of Data in Transit

Preventing people from accessing configuration and log files is one thing. The other issue is to make sure data is securely transferred over the network. With an exception of setups where all the clients are local and use Unix socket to access MySQL, in majority of cases, data which forms a result set for a query, leaves the server and is transferred to the client over the network. Data can also be transferred between MySQL servers, for example via standard MySQLreplication or within a Galera cluster. Network traffic can be sniffed, and through those means, your data would be exposed.

To prevent this from happening, it is possible to use SSL to encrypt traffic, both server and client-side. You can create an SSL connection between a client and a MySQL server. You can also create an SSL connection between your master and your slaves, or between the nodes of a Galera cluster. This will ensure that all data that is transferred is safe and cannot be sniffed by an attacker who gained access to your network.

The MySQL documentation covers in detail how to setup SSL encryption. If you find it too cumbersome, ClusterControl can help you deploy a secure environment for MySQL replication or Galera cluster in a couple of clicks:

10. Encryption of Data at Rest

Securing data in transit using SSL encryption only partially solves the problem. You need to take care also of data at rest - all the data that is stored in the database. Data at rest encryption can also be a requirement for security regulations like HIPAA or PCI DSS. Such encryption can be implemented on multiple levels - you can encrypt the whole disk on which the files are stored. You can encrypt only the MySQL database through functionality available in the latest versions of MySQL or MariaDB. Encryption can also be implemented in the application, so that it encrypts the data before storing it in the database. Every option has its pros and cons: disk encryption can help only when disks are physically stolen, but the files would not be encrypted on a running database server. MySQL database encryption solves this issue, but it cannot prevent access to data when the root account is compromised. Application level encryption is the most flexible and secure, but then you lose the power of SQL - it’s pretty hard to use encrypted columns in WHERE or JOIN clauses.

All flavors of MySQL provide some sort of data at rest encryption. Oracle’s MySQL uses Transparent Data Encryption to encrypt InnoDB tablespaces. This is available in the commercial MySQL Enterprise offering. It provides an option to encrypt InnoDB tablespaces, other files which also store data in some form (for example, binary logs, general log, slow query log) are not encrypted. This allows the toolchain (MySQL Enterprise Backup but also xtrabackup, mysqldump, mysqlbinlog) to work correctly with such setup.

Starting from MySQL 5.7.11, the community version of MySQL also got support for InnoDB tablespace encryption. The main difference compared to the enterprise offering is the way the keys are stored - keys are not located in a secure vault, which is required for regulatory compliance. This means that starting from Percona Server 5.7.11, it is also possible to encrypt InnoDB tablespace. In the recently published Percona Server 5.7.20, support for encrypting binary logs has been added. It is also possible to integrate with Hashicorp Vault server via a keyring_vault plugin, matching (and even extending - binary log encryption) the features available in Oracle’s MySQL Enterprise edition.

MariaDB added support for data encryption in 10.1.3 - it is a separate, enhanced implementation. It gives you the possibility to not only encrypt InnoDB tablespaces, but also InnoDB log files. As a result, data is more secure but some of the tools won’t work in such configuration. Xtrabackup will not work with encrypted redo logs - MariaDB created a fork, MariaDB Backup, which adds support for MariaDB encryption. There are also issues with mysqlbinlog.

No matter which MySQL flavor you use, as long as it is a recent version, you would have options to implement data at rest encryption via the database server, making sure that your data is additionally secured.

Securing MySQL or MariaDB is not trivial, but we hope these 10 tips will help you along the way.

How to Secure Galera Cluster - 8 Tips

$
0
0

As a distributed database system, Galera Cluster requires additional security measures as compared to a centralized database. Data is distributed across multiple servers or even datacenters perhaps. With significant data communication happening across nodes, there can be significant exposure if the appropriate security measures are not taken.

In this blog post, we are going to look into some tips on how to secure our Galera Cluster. Note that this blog builds upon our previous blog post - How to Secure Your Open Source Databases with ClusterControl.

Firewall & Security Group

The following ports are very important for a Galera Cluster:

  • 3306 - MySQL
  • 4567 - Galera communication and replication
  • 4568 - Galera IST
  • 4444 - Galera SST

From the external network, it is recommended to only open access to MySQL port 3306. The other three ports can be closed down from the external network, and only allows them for internal access between the Galera nodes. If you are running a reverse proxy sitting in front of the Galera nodes, for example HAProxy, you can lock down the MySQL port from public access. Also ensure the monitoring port for the HAProxy monitoring script is opened. The default port is 9200 on the Galera node.

The following diagram illustrates our example setup on a three-node Galera Cluster, with an HAProxy facing the public network with its related ports:

Based on the above diagram, the iptables commands for database nodes are:

$ iptables -A INPUT -p tcp -s 10.0.0.0/24 --dport 3306 -j ACCEPT
$ iptables -A INPUT -p tcp -s 10.0.0.0/24 --dport 4444 -j ACCEPT
$ iptables -A INPUT -p tcp -s 10.0.0.0/24 --dports 4567:4568 -j ACCEPT
$ iptables -A INPUT -p tcp -s 10.0.0.0/24 --dport 9200 -j ACCEPT

While on the load balancer:

$ iptables -A INPUT -p tcp --dport 3307 -j ACCEPT

Make sure to end your firewall rules with deny all, so only traffic as defined in the exception rules is allowed. You can be stricter and extend the commands to follow your security policy - for example, by adding network interface, destination address, source address, connection state and what not.

MySQL Client-Server Encryption

MySQL supports encryption between the client and the server. First we have to generate the certificate. Once configured, you can enforce user accounts to specify certain options to connect with encryption to a MySQL server.

The steps require you to:

  1. Create a key for Certificate Authority (ca-key.pem)
  2. Generate a self-signed CA certificate (ca-cert.pem)
  3. Create a key for server certificate (server-key.pem)
  4. Generate a certificate for server and sign it with ca-key.pem (server-cert.pem)
  5. Create a key for client certificate (client-key.pem)
  6. Generate a certificate for client and sign it with ca-key.pem (client-cert.pem)

Always be careful with the CA private key (ca-key.pem) - anybody with access to it can use it to generate additional client or server certificates that will be accepted as legitimate when CA verification is enabled. The bottom line is all the keys must be kept discreet.

You can then add the SSL-related variables under [mysqld] directive, for example:

ssl-ca=/etc/ssl/mysql/ca-cert.pem
ssl-cert=/etc/ssl/mysql/server-cert.pem
ssl-key=/etc/ssl/mysql/server-key.pem

Restart the MySQL server to load the changes. Then create a user with the REQUIRE SSL statement, for example:

mysql> GRANT ALL PRIVILEGES ON db1.* TO 'dbuser'@'192.168.1.100' IDENTIFIED BY 'mySecr3t' REQUIRE SSL;

The user created with REQUIRE SSL will be enforced to connect with the correct client SSL files (client-cert.pem, client-key.pem and ca-cert.pem).

With ClusterControl, client-server SSL encryption can easily be enabled from the UI, using the "Create SSL Encryption" feature.

Galera Encryption

Enabling encryption for Galera means IST will also be encrypted because the communication happens via the same socket. SST, on the other hand, has to be configured separately as shown in the next section. All nodes in the cluster must be enabled with SSL encryption and you cannot have a mix of nodes where some have enabled SSL encryption, and others not. The best time to configure this is when setting up a new cluster. However, if you need to add this on a running production system, you will unfortunately need to rebootstrap the cluster and there will be downtime.

All Galera nodes in the cluster must use the same key, certificate and CA (optional). You could also use the same key and certificate created for MySQL client-server encryption, or generate a new set for this purpose only. To activate encryption inside Galera, one has to append the option and value under wsrep_provider_options inside the MySQL configuration file on each Galera node. For example, consider the following existing line for our Galera node:

wsrep_provider_options = "gcache.size=512M; gmcast.segment=0;"

Append the related variables inside the quote, delimited by a semi-colon:

wsrep_provider_options = "gcache.size=512M; gmcast.segment=0; socket.ssl_cert=/etc/mysql/cert.pem; socket.ssl_key=/etc/mysql/key.pem;"

For more info on the Galera's SSL related parameters, see here. Perform this modification on all nodes. Then, stop the cluster (one node at a time) and bootstrap from the last node that shut down. You can verify if SSL is loaded correctly by looking into the MySQL error log:

2018-01-19T01:15:30.155211Z 0 [Note] WSREP: gcomm: connecting to group 'my_wsrep_cluster', peer '192.168.10.61:,192.168.10.62:,192.168.10.63:'
2018-01-19T01:15:30.159654Z 0 [Note] WSREP: SSL handshake successful, remote endpoint ssl://192.168.10.62:53024 local endpoint ssl://192.168.10.62:4567 cipher: AES128-SHA compression:

With ClusterControl, Galera Replication encryption can be easily enabled using the "Create SSL Galera Encryption" feature.

SST Encryption

When SST happens without encryption, the data communication is exposed while the SST process is ongoing. SST is a full data synchronization process from a donor to a joiner node. If an attacker was able to "see" the full data transmission, the person would get a complete snapshot of your database.

SST with encryption is supported only for mysqldump and xtrabackup-v2 methods. For mysqldump, the user must be granted with "REQUIRE SSL" on all nodes and the configuration is similar to standard MySQL client-server SSL encryption (as described in the previous section). Once the client-server encryption is activated, create a new SST user with SSL enforced:

mysql> GRANT ALL ON *.* TO 'sst_user'@'%' IDENTIFIED BY 'mypassword' REQUIRE SSL;

For rsync, we recommend using galera-secure-rsync, a drop-in SSL-secured rsync SST script for Galera Cluster. It operates almost exactly like wsrep_sst_rsync except that it secures the actual communications with SSL using socat. Generate the required client/server key and certificate files, copy them to all nodes and specify the "secure_rsync" as the SST method inside the MySQL configuration file to activate it:

wsrep_sst_method=secure_rsync

For xtrabackup, the following configuration options must be enabled inside the MySQL configuration file under [sst] directive:

[sst]
encrypt=4
ssl-ca=/path/to/ca-cert.pem
ssl-cert=/path/to/server-cert.pem
ssl-key=/path/to/server-key.pem

Database restart is not necessary. If this node is selected by Galera as a donor, these configuration options will be picked up automatically when Galera initiates the SST.

SELinux

Security-Enhanced Linux (SELinux) is an access control mechanism implemented in the kernel. Without SELinux, only traditional access control methods such as file permissions or ACL are used to control the file access of users.

By default, with strict enforcing mode enabled, everything is denied and the administrator has to make a series of exceptions policies to the elements of the system require in order to function. Disabling SELinux entirely has become a common poor practice for many RedHat based installation nowadays.

Depending on the workloads, usage patterns and processes, the best way is to create your own SELinux policy module tailored for your environment. What you really need to do is to set SELinux to permissive mode (logging only without enforce), and trigger events that can happen on a Galera node for SELinux to log. The more extensive the better. Example events like:

  • Starting node as donor or joiner
  • Restart node to trigger IST
  • Use different SST methods
  • Backup and restore MySQL databases using mysqldump or xtrabackup
  • Enable and disable binary logs

One example is if the Galera node is monitored by ClusterControl and the query monitor feature is enabled, ClusterControl will enable/disable the slow query log variable to capture the slow running queries. Thus, you would see the following denial in the audit.log:

$ grep -e denied audit/audit.log | grep -i mysql
type=AVC msg=audit(1516835039.802:37680): avc:  denied  { open } for  pid=71222 comm="mysqld" path="/var/log/mysql/mysql-slow.log" dev="dm-0" ino=35479360 scontext=system_u:system_r:mysqld_t:s0 tcontext=unconfined_u:object_r:var_log_t:s0 tclass=file

The idea is to let all possible denials get logged into the audit log, which later can be used to generate the policy module using audit2allow before loading it into SELinux. Codership has covered this in details in the documentation page, SELinux Configuration.

SST Account and Privileges

SST is an initial syncing process performed by Galera. It brings a joiner node up-to-date with the rest of the members in the cluster. The process basically exports the data from the donor node and restores it on the joiner node, before the joiner is allowed to catch up on the remaining transactions from the queue (i.e., those that happened during the syncing process). Three SST methods are supported:

  • mysqldump
  • rsync
  • xtrabackup (or xtrabackup-v2)

For mysqldump SST usage, the following privileges are required:

  • SELECT, SHOW VIEW, TRIGGER, LOCK TABLES, RELOAD, FILE

We are not going to go further with mysqldump because it is probably not often used in production as SST method. Beside, it is a blocking procedure on the donor. Rsync is usually a preferred second choice after xtrabackup due to faster syncing time, and less error-prone as compared to mysqldump. SST authentication is ignored with rsync, therefore you may skip configuring SST account privileges if rsync is the chosen SST method.

Moving along with xtrabackup, the following privileges are advised for standard backup and restore procedures based on the Xtrabackup documentation page:

  • CREATE, CREATE TABLESPACE, EVENT, INSERT, LOCK TABLE, PROCESS, RELOAD, REPLICATION CLIENT, SELECT, SHOW VIEW, SUPER

However for xtrabackup's SST usage, only the following privileges matter:

  • PROCESS, RELOAD, REPLICATION CLIENT

Thus, the GRANT statement for SST can be minimized as:

mysql> GRANT PROCESS,RELOAD,REPLICATION CLIENT ON *.* TO 'sstuser'@'localhost' IDENTIFIED BY 'SuP3R@@sTr0nG%%P4ssW0rD';

Then, configure wsrep_sst_auth accordingly inside MySQL configuration file:

wsrep_sst_auth = sstuser:SuP3R@@sTr0nG%%P4ssW0rD

Only grant the SST user for localhost and use a strong password. Avoid using root user as the SST account, because it would expose the root password inside the configuration file under this variable. Plus, changing or resetting the MySQL root password would break SST in the future.

MySQL Security Hardening

Galera Cluster is a multi-master replication plugin for InnoDB storage engine, which runs on MySQL and MariaDB forks. Therefore, standard MySQL/MariaDB/InnoDB security hardening recommendations apply to Galera Cluster as well.

This topic has been covered in numerous blog posts out there. We have also covered this topic in the following blog posts:

The above blog posts summarize the necessity of encrypting data at rest and data in transit, having audit plugins, general security guidelines, network security best practices and so on.

Use a Load Balancer

There are a number of database load balancers (reverse proxy) that can be used together with Galera - HAProxy, ProxySQL and MariaDB MaxScale to name some of them. You can set up a load balancer to control access to your Galera nodes. It is a great way of distributing the database workload between the database instances, as well as restricting access, e.g., if you want to take a node offline for maintenance, or if you want to limit the number of connections opened on the Galera nodes. The load balancer should be able to queue connections, and therefore provide some overload protection to your database servers.

ProxySQL, a powerful database reverse-proxy which understands MySQL and MariaDB, can be extended with many useful security features like query firewall, to block offending queries from the database server. The query rules engine can also be used to rewrite bad queries into something better/safer, or redirect them to another server which can absorb the load without affecting any of the Galera nodes. MariaDB MaxScale also capable of blocking queries based on regular expressions with its Database Firewall filter.

Another advantage having a load balancer for your Galera Cluster is the ability to host a data service without exposing the database tier to the public network. The proxy server can be used as the bastion host to gain access to the database nodes in a private network. By having the database cluster isolated from the outside world, you have removed one of the important attacking vectors.

That's it. Always stay secure and protected.

Comparing Oracle RAC HA Solution to Galera Cluster for MySQL or MariaDB

$
0
0

Business has continuously desired to derive insights from information to make reliable, smarter, real-time, fact-based decisions. As firms rely more on data and databases, information and data processing is the core of many business operations and business decisions. The faith in the database is total. None of the day-to-day company services can run without the underlying database platforms. As a consequence, the necessity on scalability and performance of database system software is more critical than ever. The principal benefits of the clustered database system are scalability and high availability. In this blog, we will try to compare Oracle RAC and Galera Cluster in the light of these two aspects. Real Application Clusters (RAC) is Oracle’s premium solution to clustering Oracle databases and provides High Availability and Scalability. Galera Cluster is the most popular clustering technology for MySQL and MariaDB.

Architecture overview

Oracle RAC uses Oracle Clusterware software to bind multiple servers. Oracle Clusterware is a cluster management solution that is integrated with Oracle Database, but it can also be used with other services, not only the database. The Oracle Clusterware is an additional software installed on servers running the same operating system, which lets the servers to be chained together to operate as if they were one server.

Oracle Clusterware watches the instance and automatically restarts it if a crash occurs. If your application is well designed, you may not experience any service interruption. Only a group of sessions (those connected to the failed instance) is affected by the failure. The blackout can be efficiently masked to the end user using advanced RAC features like Fast Application Notification and the Oracle client’s Fast Connection Failover. Oracle Clusterware controls node membership and prevents split brain symptoms in which two or more instances attempt to control the instance.

Galera Cluster is a synchronous active-active database clustering technology for MySQL and MariaDB. Galera Cluster differs from what is known as Oracle’s MySQL Cluster - NDB. MariaDB cluster is based on the multi-master replication plugin provided by Codership. Since version 5.5, the Galera plugin (wsrep API) is an integral part of MariaDB. Percona XtraDB Cluster (PXC) is also based on the Galera plugin. The Galera plugin architecture stands on three core layers: certification, replication, and group communication framework. Certification layer prepares the write-sets and does the certification checks on them, guaranteeing that they can be applied. Replication layer manages the replication protocol and provides the total ordering capability. Group Communication Framework implements a plugin architecture which allows other systems to connect via gcomm back-end schema.

To keep the state identical across the cluster, the wsrep API uses a Global Transaction ID. GTID unique identifier is created and associated with each transaction committed on the database node. In Oracle RAC, various database instances share access to resources such as data blocks in the buffer cache to enqueue data blocks. Access to the shared resources between RAC instances needs to be coordinated to avoid conflict. To organize shared access to these resources, the distributed cache maintains information such as data block ID, which RAC instance holds the current version of this data block, and the lock mode in which each instance contains the data block.

Data storage key concepts

Oracle RAC relies on a distributed disk architecture. The database files, control files and online redo logs for the database need be accessible to each node in the cluster. There is a variation of ways to configure shared storage including directly attached disks, Storage Area Networks (SAN), and Network Attached Storage (NAS) and Oracle ASM. Two most popular are OCFS and ASM. Oracle Cluster File System (OCFS) is a shared file system designed specifically for Oracle RAC. OCFS eliminates the requirement that Oracle database files be connected to logical drives and enables all nodes to share a single Oracle Home ASM, RAW Device. Oracle ASM is Oracle's advised storage management solution that provides an alternative to conventional volume managers, file systems, and raw devices. The Oracle ASM provides a virtualization layer between the database and storage. It treats multiple disks as a single disk group and lets you dynamically add or remove drives while maintaining databases online.

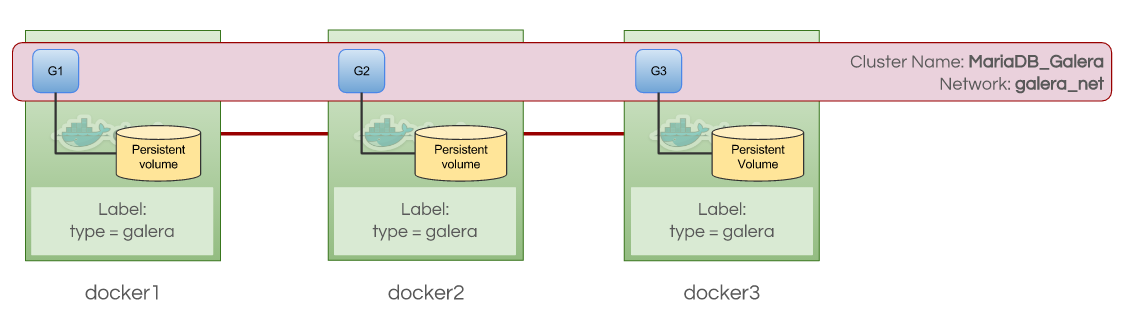
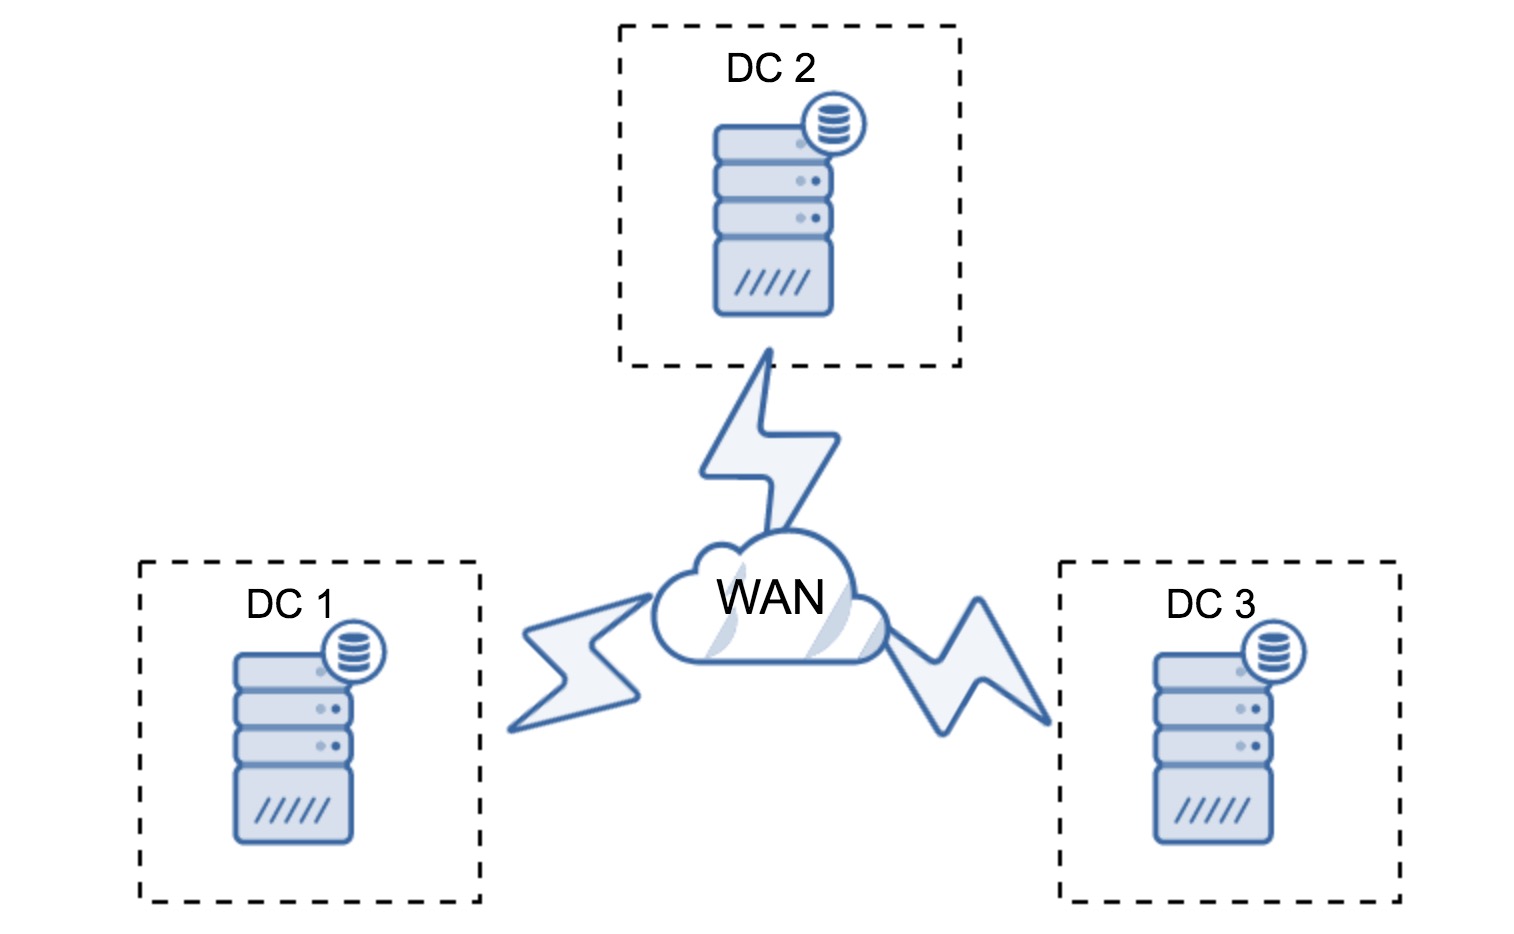
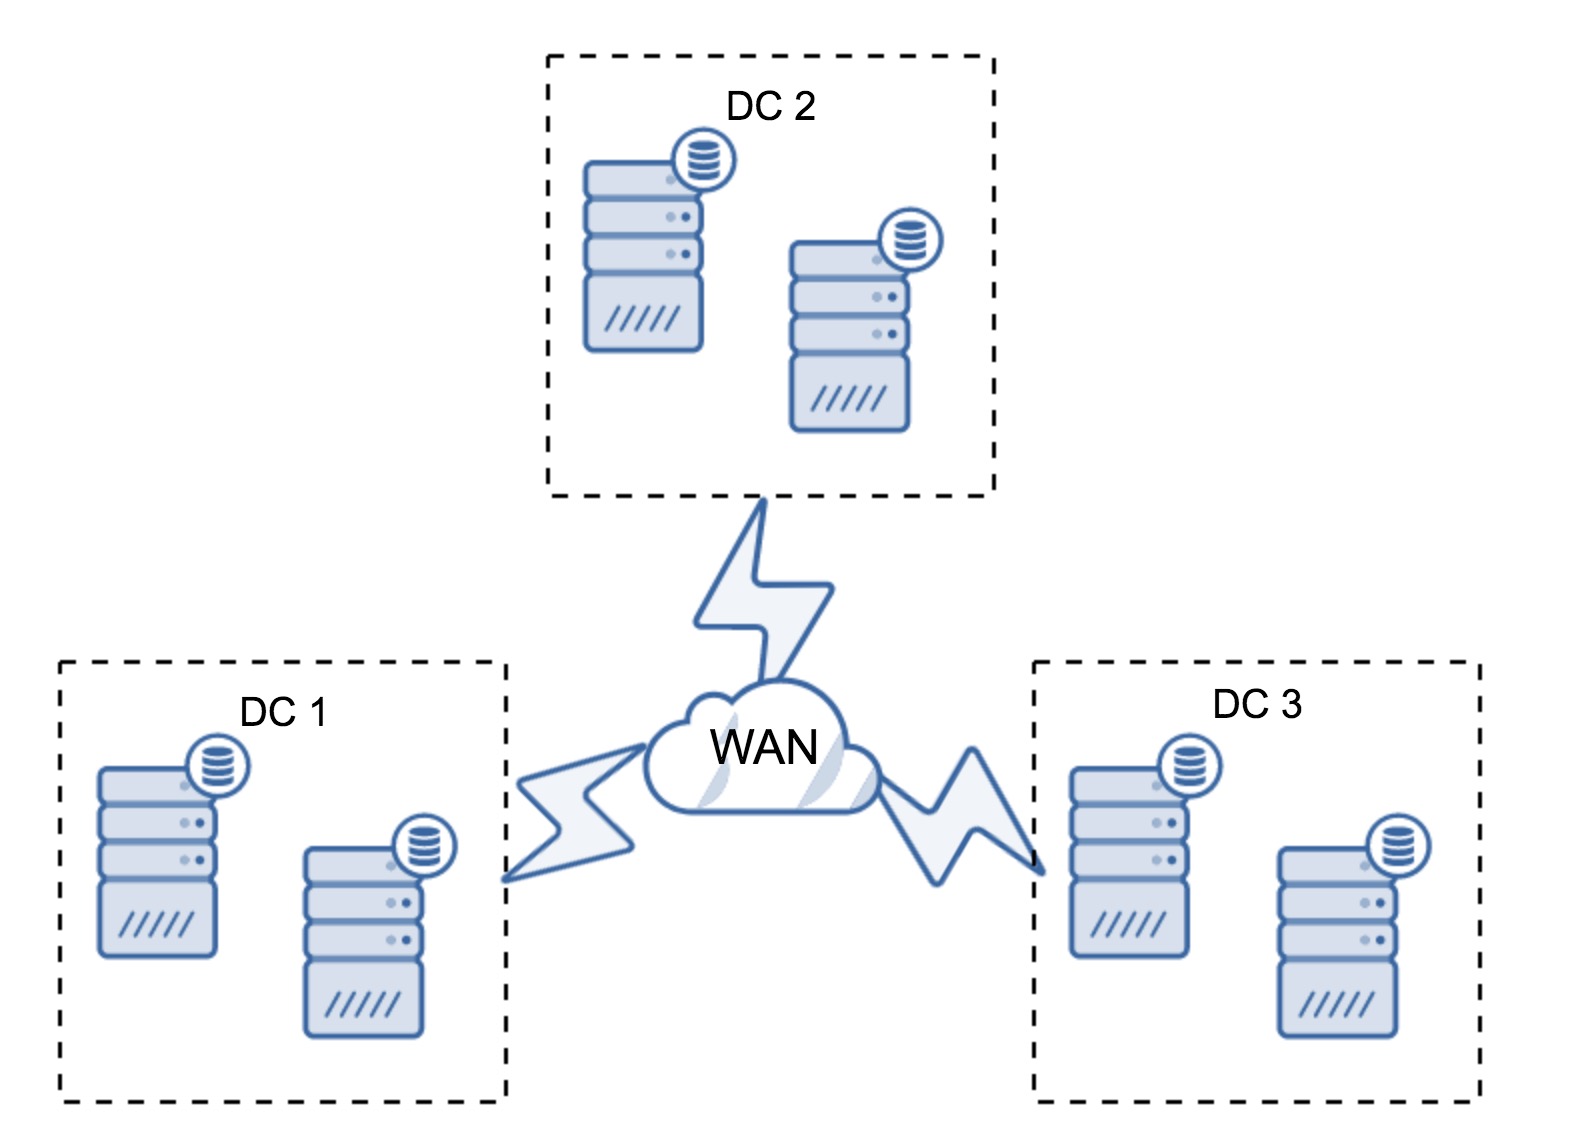
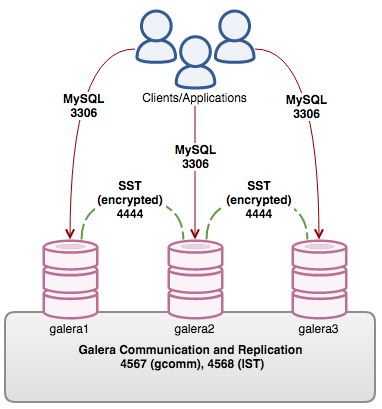
There is no need to build sophisticated shared disk storage for Galera, as each node has its full copy of data. However it is a good practice to make the storage reliable with battery-backed write caches.
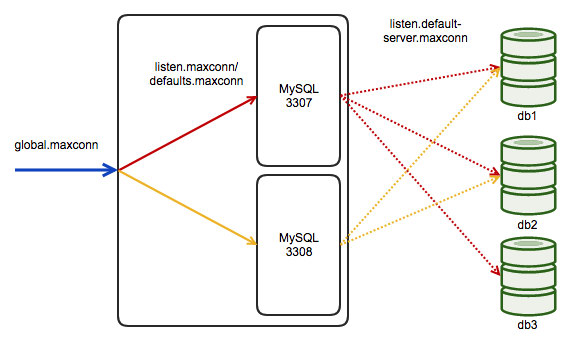
Oracle RAC, Cluster storage
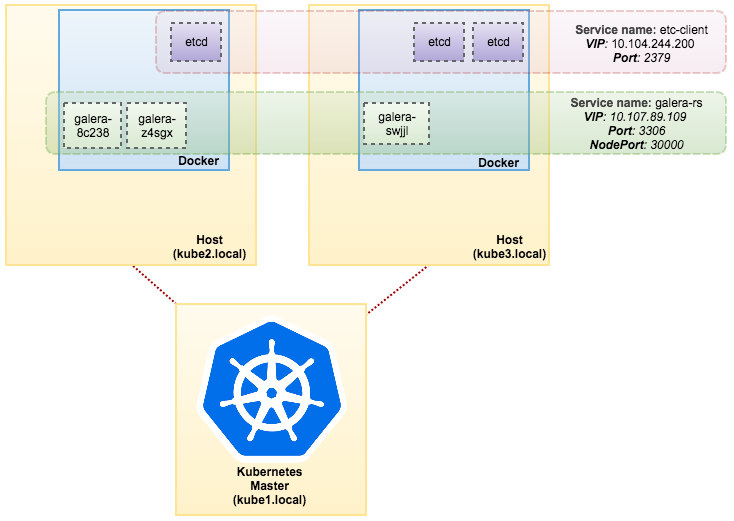
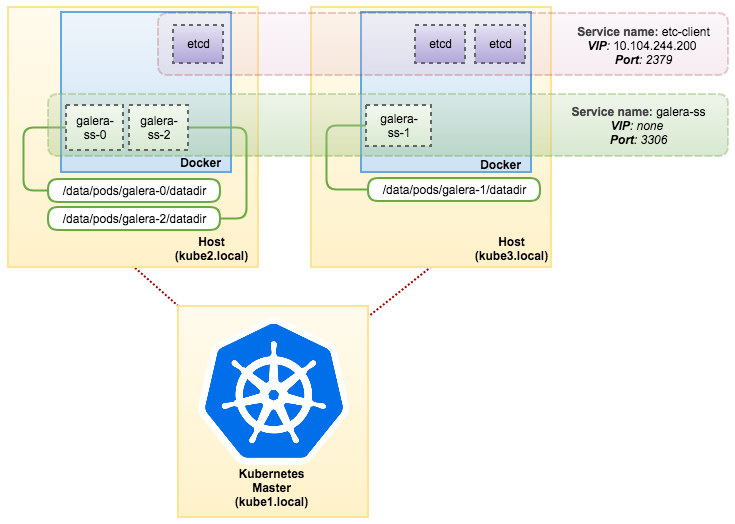
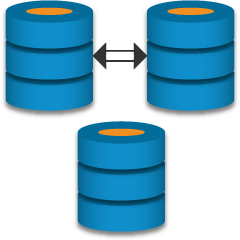
Galera replication, disks attached to database nodes

Cluster nodes communication and cache

Oracle Real Application Clusters has a shared cache architecture, it utilizes Oracle Grid Infrastructure to enable the sharing of server and storage resources. Communication between nodes is the critical aspect of cluster integrity. Each node must have at least two network adapters or network interface cards: one for the public network interface, and one for the interconnect. Each cluster node is connected to all other nodes via a private high-speed network, also recognized as the cluster interconnect.

Oracle RAC, network architecture

The private network is typically formed with Gigabit Ethernet, but for high-volume environments, many vendors offer low-latency, high-bandwidth solutions designed for Oracle RAC. Linux also extends a means of bonding multiple physical NICs into a single virtual NIC to provide increased bandwidth and availability.

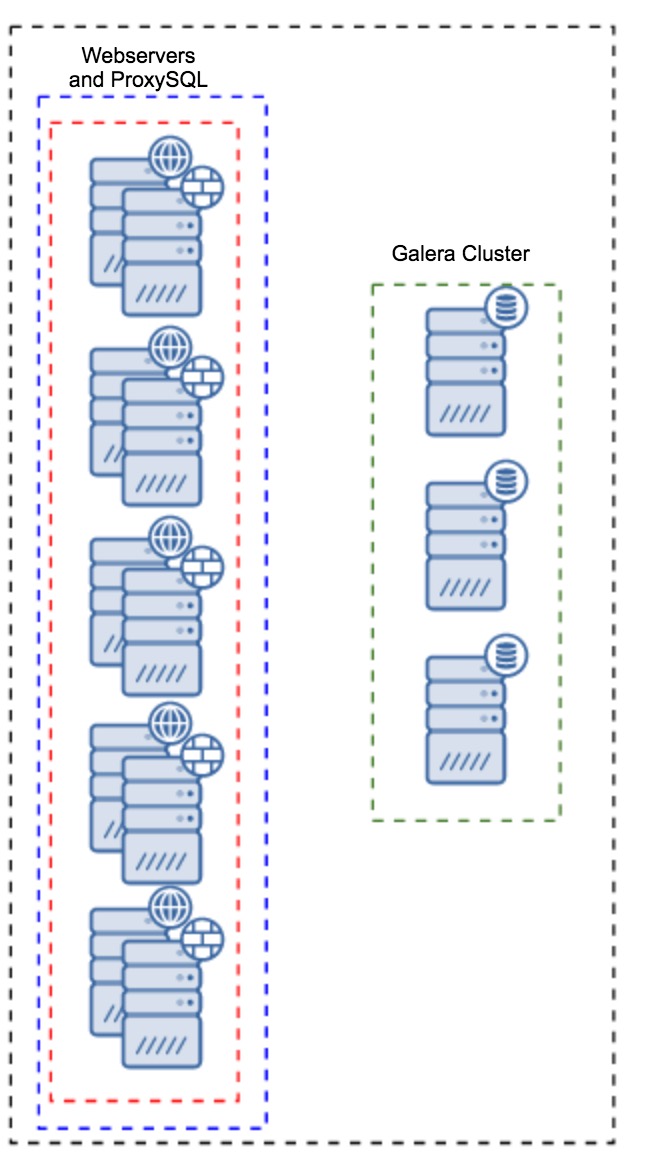
While the default approach to connecting Galera nodes is to use a single NIC per host, you can have more than one card. ClusterControl can assist you with such setup. The main difference is the bandwidth requirement on the interconnect. Oracle RAC ships blocks of data between instances, so it places a heavier load on the interconnect as compared to Galera write-sets (which consist of a list of operations).

With Redundant Interconnect Usage in RAC, you can identify multiple interfaces to use for the private cluster network, without the need of using bonding or other technologies. This functionality is available starting with Oracle Database 11gR2. If you use the Oracle Clusterware excessive interconnect feature, then you must use IPv4 addresses for the interfaces (UDP is a default).

To manage high availability, each cluster node is assigned a virtual IP address (VIP). In the event of node failure, the failed node's IP address can be reassigned to a surviving node to allow applications continue to reach the database through the same IP address.

Sophisticated network setup is necessary to Oracle's Cache Fusion technology to couple the physical memory in each host into a single cache. Oracle Cache Fusion provides data stored in the cache of one Oracle instance to be accessed by any other instance by transporting it across the private network. It also protects data integrity and cache coherency by transmitting locking and supplementary synchronization information beyond cluster nodes.

On top of the described network setup, you can set a single database address for your application - Single Client Access Name (SCAN). The primary purpose of SCAN is to provide ease of connection management. For instance, you can add new nodes to the cluster without changing your client connection string. This functionality is because Oracle will automatically distribute requests accordingly based on the SCAN IPs which point to the underlying VIPs. Scan listeners do the bridge between clients and the underlying local listeners which are VIP-dependent.

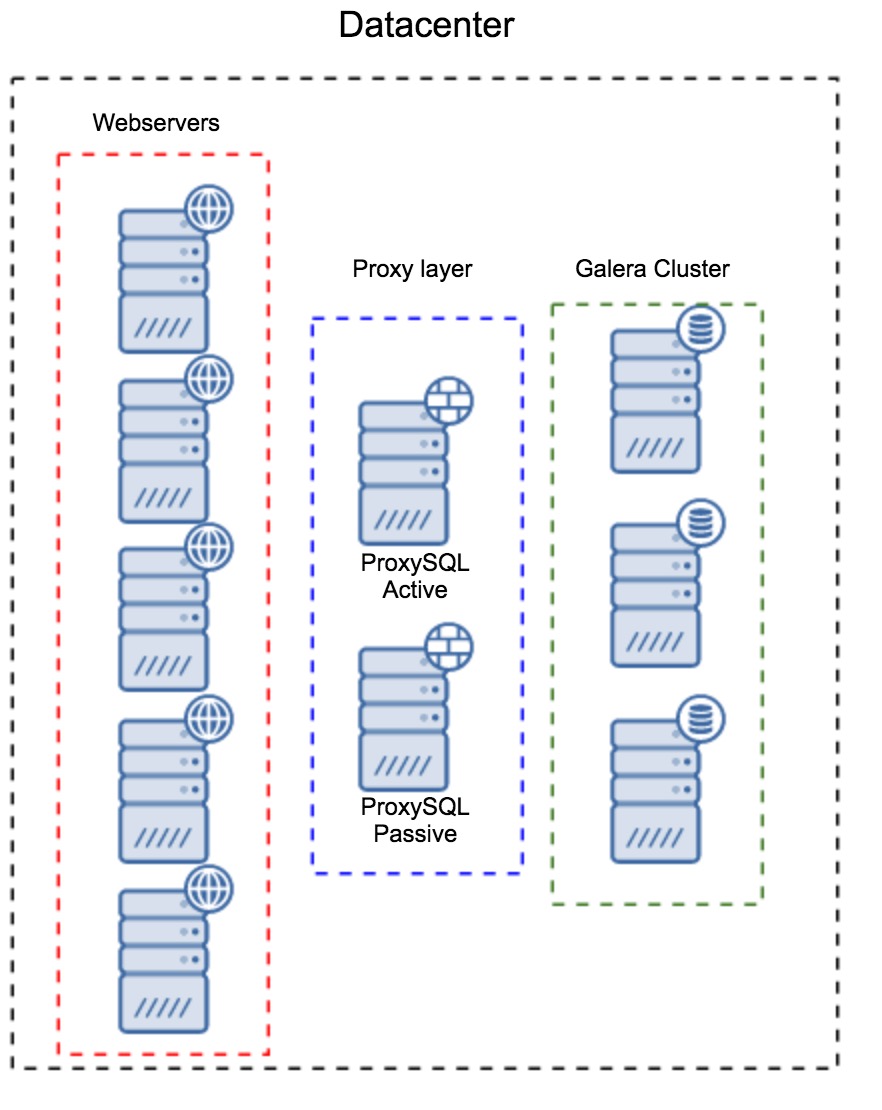
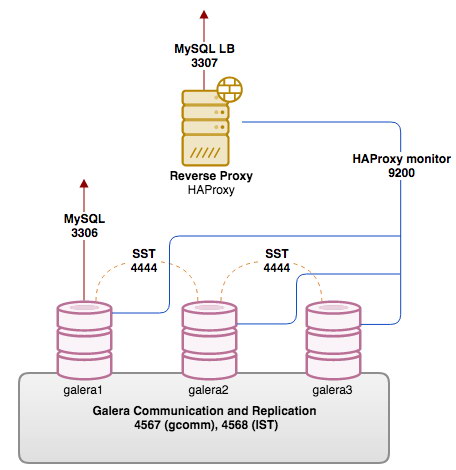
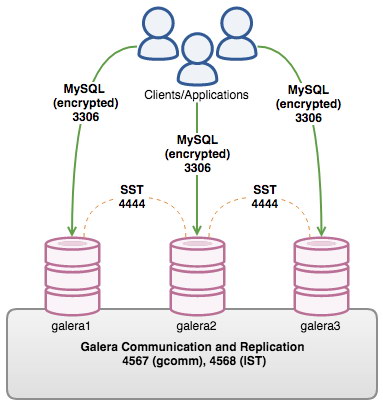
For Galera Cluster, the equivalent of SCAN would be adding a database proxy in front of the Galera nodes. The proxy would be a single point of contact for applications, it can blacklist failed nodes and route queries to healthy nodes. The proxy itself can be made redundant with Keepalived and Virtual IP.

ClusterControl
Single Console for Your Entire Database Infrastructure
Find out what else is new in ClusterControl

Failover and data recovery

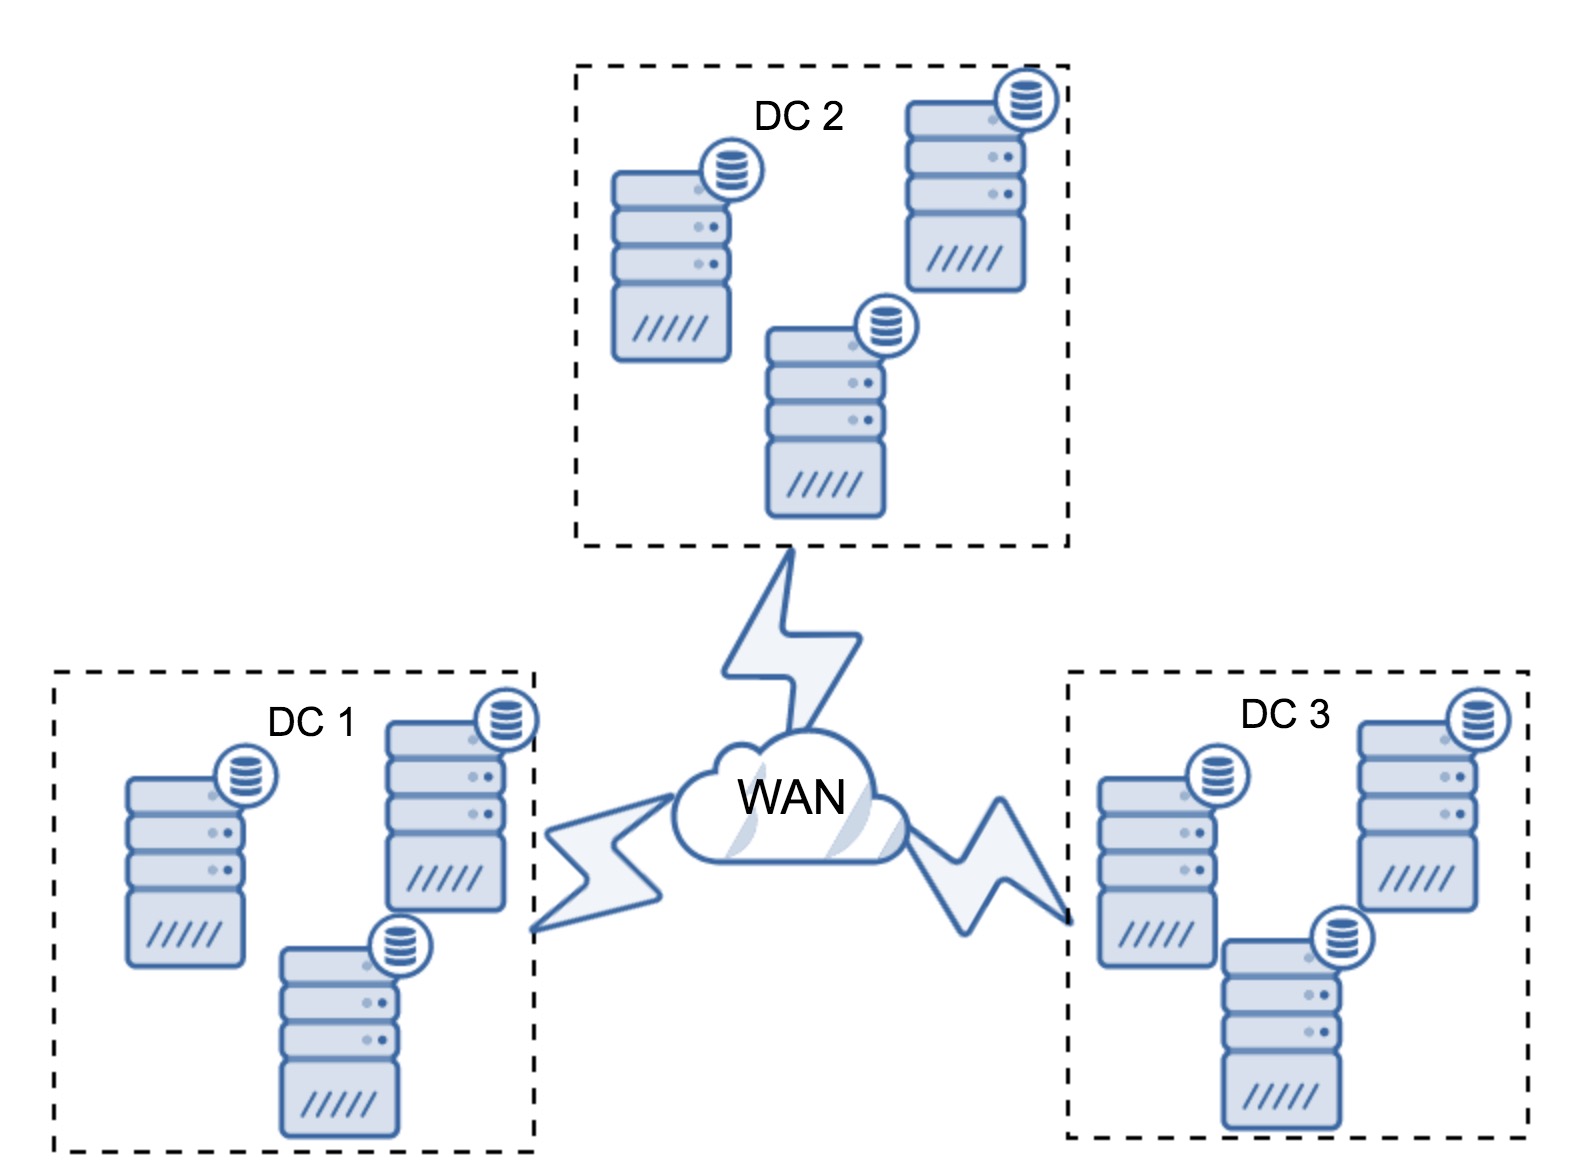
The main difference between Oracle RAC and MySQL Galera Cluster is that Galera is shared nothing architecture. Instead of shared disks, Galera uses certification based replication with group communication and transaction ordering to achieve synchronous replication. A database cluster should be able to survive a loss of a node, although it's achieved in different ways. In case of Galera, the critical aspect is the number of nodes, Galera requires a quorum to stay operational. A three node cluster can survive the crash of one node. With more nodes in your cluster, your availability will grow. Oracle RAC doesn't require a quorum to stay operational after a node crash. It is because of the access to distributed storage that keeps consistent information about cluster state. However, your data storage could be a potential point of failure in your high availability plan. While it's reasonably straightforward task to have Galera cluster nodes spread across geolocation data centers, it wouldn't be that easy with RAC. Oracle RAC requires additional high-end disk mirroring however, basic RAID like redundancy can be achieved inside an ASM diskgroup.

Disk Group TypeSupported Mirroring LevelsDefault Mirroring Level
External redundancyUnprotected (none)Unprotected
Normal redundancyTwo-way, three-way, unprotected (none)Two-way
High redundancyThree-wayThree-way
Flex redundancyTwo-way, three-way, unprotected (none)Two-way (newly-created)
Extended redundancyTwo-way, three-way, unprotected (none)Two-way
ASM Disk Group redundancy

Locking Schemes

In a single-user database, a user can alter data without concern for other sessions modifying the same data at the same time. However, in a multi-user database multi-node environment, this become more tricky. A multi-user database must provide the following:

  • data concurrency - the assurance that users can access data at the same time,
  • data consistency - the assurance that each user sees a consistent view of the data.

Cluster instances require three main types of concurrency locking:

  • Data concurrency reads on different instances,
  • Data concurrency reads and writes on different instances,
  • Data concurrency writes on different instances.

Oracle lets you choose the policy for locking, either pessimistic or optimistic, depending on your requirements. To obtain concurrency locking, RAC has two additional buffers. They are Global Cache Service (GCS) and Global Enqueue Service (GES). These two services cover the Cache Fusion process, resource transfers, and resource escalations among the instances. GES include cache locks, dictionary locks, transaction locks and table locks. GCS maintains the block modes and block transfers between the instances.

In Galera cluster, each node has its storage and buffers. When a transaction is started, database resources local to that node are involved. At commit, the operations that are part of that transaction are broadcasted as part of a write-set, to the rest of the group. Since all nodes have the same state, the write-set will either be successful on all nodes or it will fail on all nodes.

Galera Cluster uses at the cluster-level optimistic concurrency control, which can appear in transactions that result in a COMMIT aborting. The first commit wins. When aborts occur at the cluster level, Galera Cluster gives a deadlock error. This may or may not impact your application architecture. High number of rows to replicate in a single transaction would impact node responses, although there are techniques to avoid such behavior.

Hardware & Software requirements

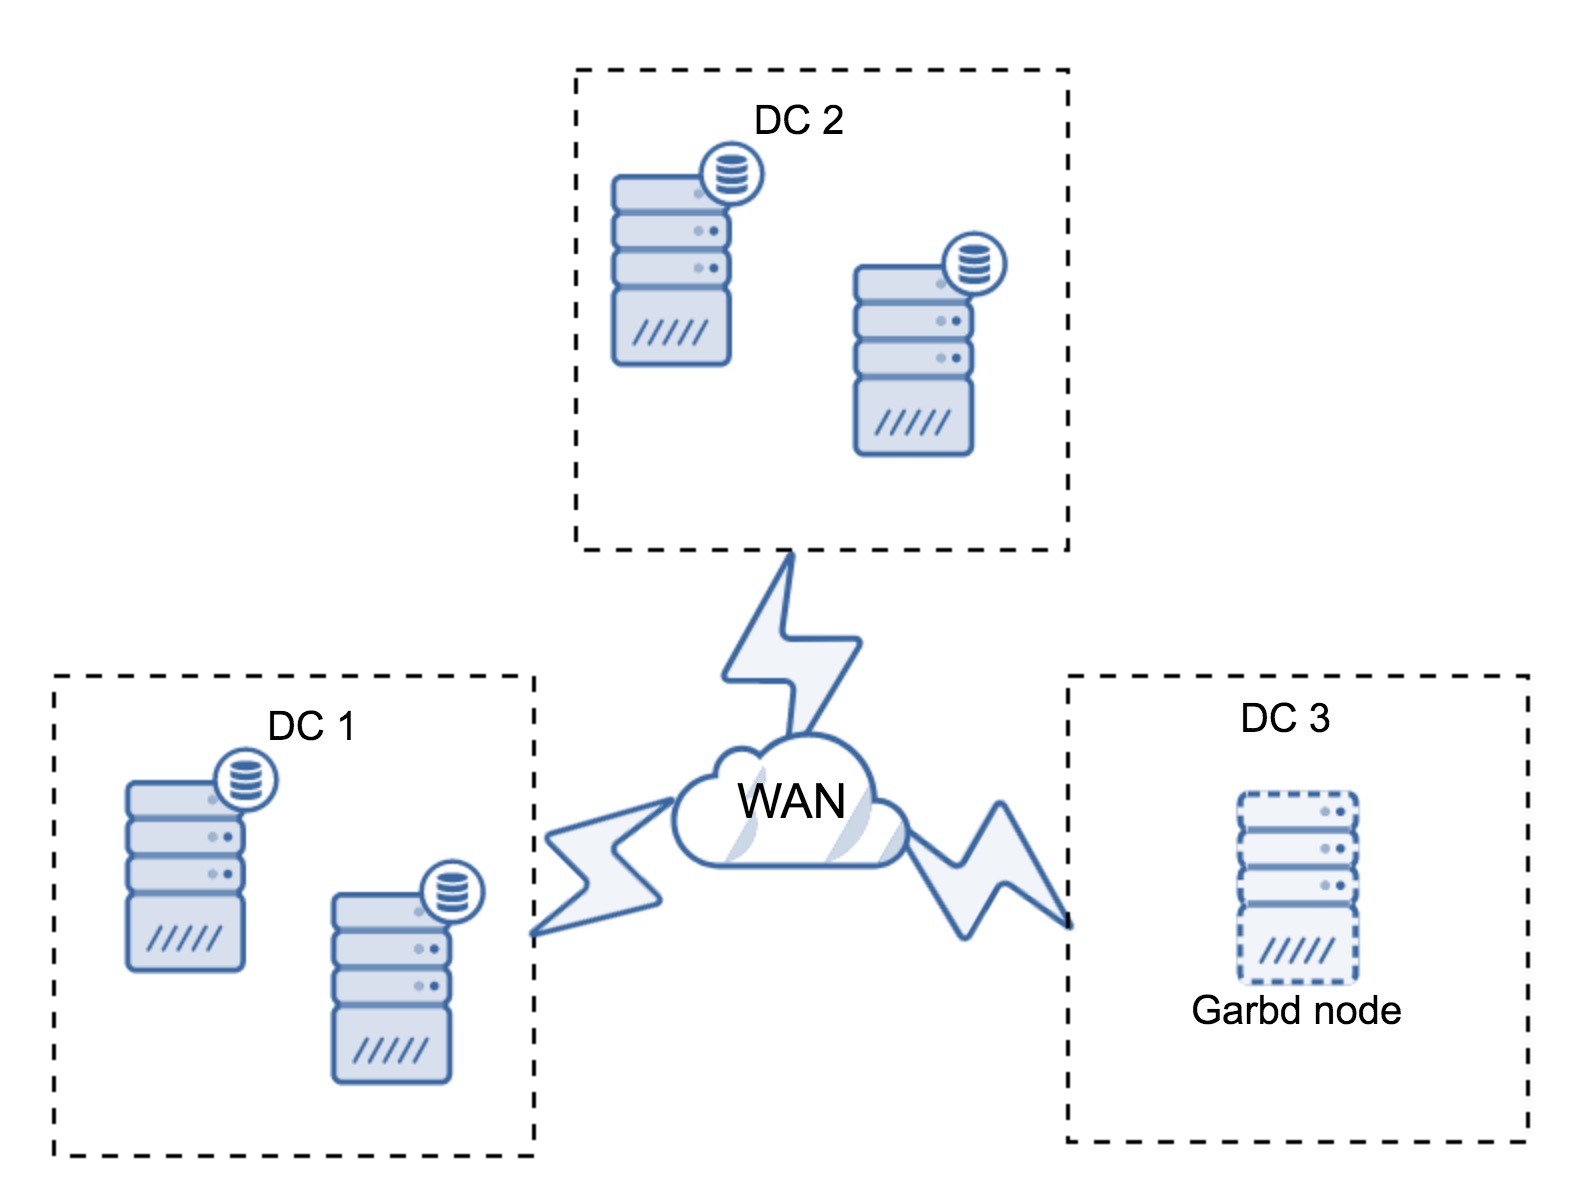
Configuring both clusters hardware doesn’t require potent resources. Minimal Oracle RAC cluster configuration would be satisfied by two servers with two CPUs, physical memory at least 1.5 GB of RAM, an amount of swap space equal to the amount of RAM and two Gigabit Ethernet NICs. Galera’s minimum node configuration is three nodes (one of nodes can be an arbitrator, gardb), each with 1GHz single-core CPU 512MB RAM, 100 Mbps network card. While these are the minimal, we can safely say that in both cases you would probably like to have more resources for your production system.

Each node stores software so you would need to prepare several gigabytes of your storage. Oracle and Galera both have the ability to individually patch the nodes by taking them down one at a time. This rolling patch avoids a complete application outage as there are always database nodes available to handle traffic.

What is important to mention is that a production Galera cluster can easily run on VM’s or basic bare metal, while RAC would need investment in sophisticated shared storage and fiber communication.

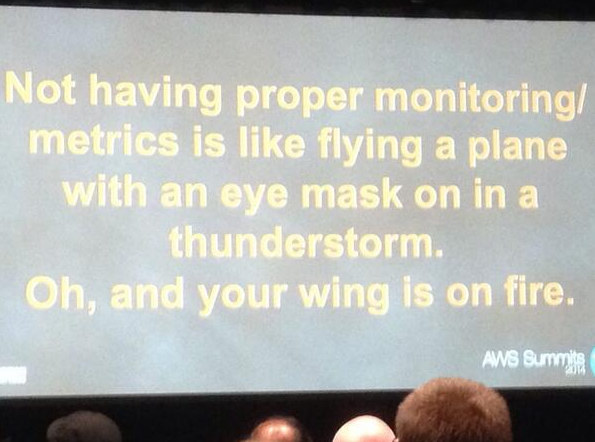
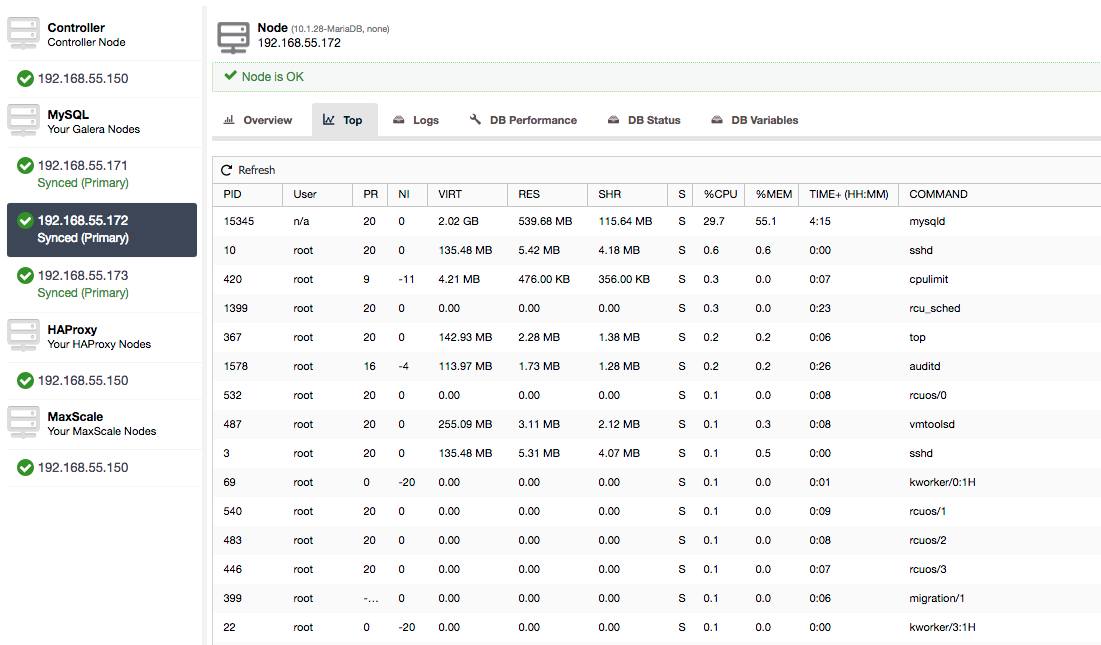
Monitoring and management

Oracle Enterprise Manager is the favored approach for monitoring Oracle RAC and Oracle Clusterware. Oracle Enterprise Manager is an Oracle Web-based unified management system for monitoring and administering your database environment. It’s part of Oracle Enterprise License and should be installed on separate server. Cluster control monitoring and management is done via combination on crsctl and srvctl commands which are part of cluster binaries. Below you can find a couple of example commands.

Clusterware Resource Status Check:

    crsctl status resource -t (or shorter: crsctl stat res -t)

Example:

$ crsctl stat res ora.test1.vip
NAME=ora.test1.vip
TYPE=ora.cluster_vip_net1.type
TARGET=ONLINE
STATE=ONLINE on test1

Check the status of the Oracle Clusterware stack:

    crsctl check cluster

Example:

$ crsctl check cluster -all
*****************************************************************
node1:
CRS-4537: Cluster Ready Services is online
CRS-4529: Cluster Synchronization Services is online
CRS-4533: Event Manager is online
*****************************************************************
node2:
CRS-4537: Cluster Ready Services is online
CRS-4529: Cluster Synchronization Services is online
CRS-4533: Event Manager is online

Check the status of Oracle High Availability Services and the Oracle Clusterware stack on the local server:

    crsctl check crs

Example:

$ crsctl check crs
CRS-4638: Oracle High Availablity Services is online
CRS-4537: Cluster Ready Services is online
CRS-4529: Cluster Synchronization Services is online
CRS-4533: Event Manager is online

Stop Oracle High Availability Services on the local server.

    crsctl stop has

Stop Oracle High Availability Services on the local server.

    crsctl start has

Displays the status of node applications:

    srvctl status nodeapps

Displays the configuration information for all SCAN VIPs

    srvctl config scan

Example:

srvctl config scan -scannumber 1
SCAN name: testscan, Network: 1
Subnet IPv4: 192.51.100.1/203.0.113.46/eth0, static
Subnet IPv6: 
SCAN 1 IPv4 VIP: 192.51.100.195
SCAN VIP is enabled.
SCAN VIP is individually enabled on nodes:
SCAN VIP is individually disabled on nodes:

The Cluster Verification Utility (CVU) performs system checks in preparation for installation, patch updates, or other system changes:

    cluvfy comp ocr

Example:

Verifying OCR integrity
Checking OCR integrity...
Checking the absence of a non-clustered configurationl...
All nodes free of non-clustered, local-only configurations
ASM Running check passed. ASM is running on all specified nodes
Checking OCR config file “/etc/oracle/ocr.loc"...
OCR config file “/etc/oracle/ocr.loc" check successful
Disk group for ocr location “+DATA" available on all the nodes
NOTE:
This check does not verify the integrity of the OCR contents. Execute ‘ocrcheck' as a privileged user to verify the contents of OCR.
OCR integrity check passed
Verification of OCR integrity was successful.

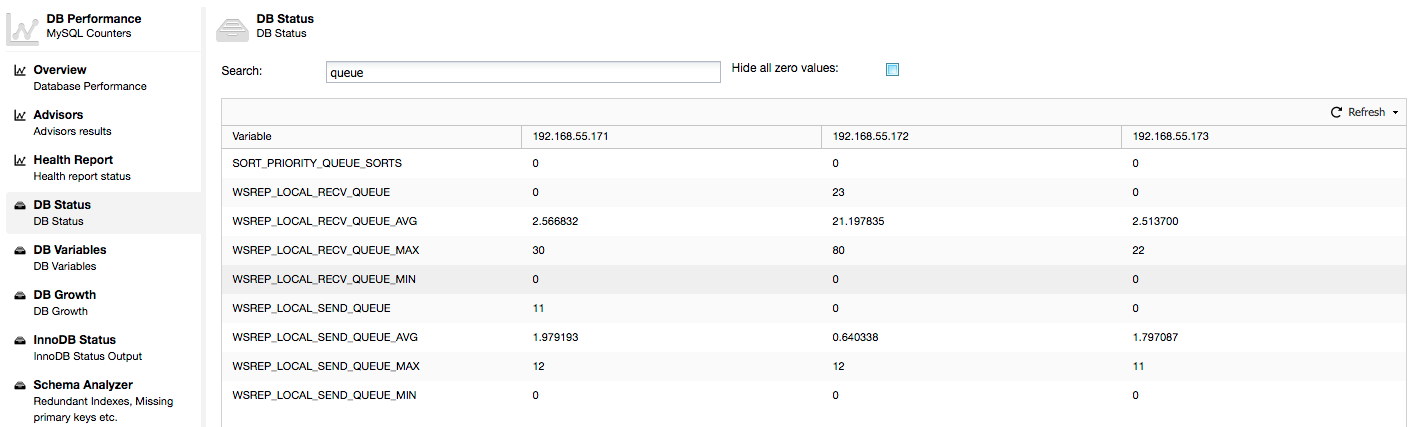
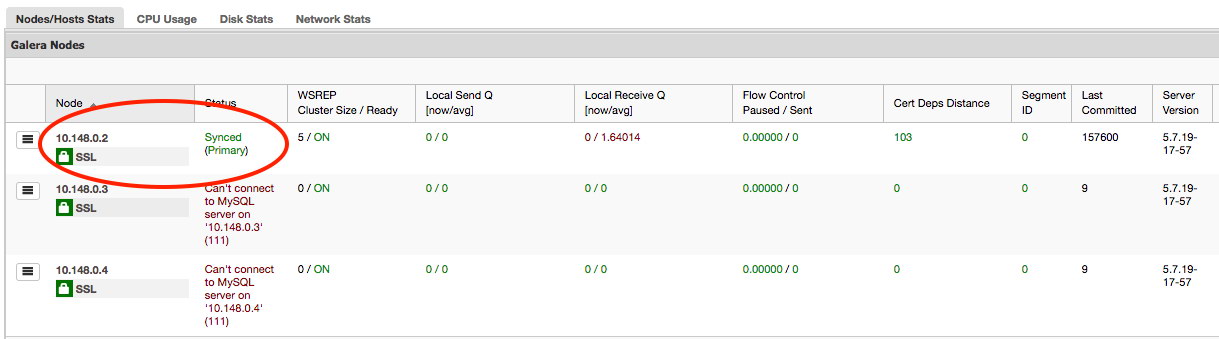
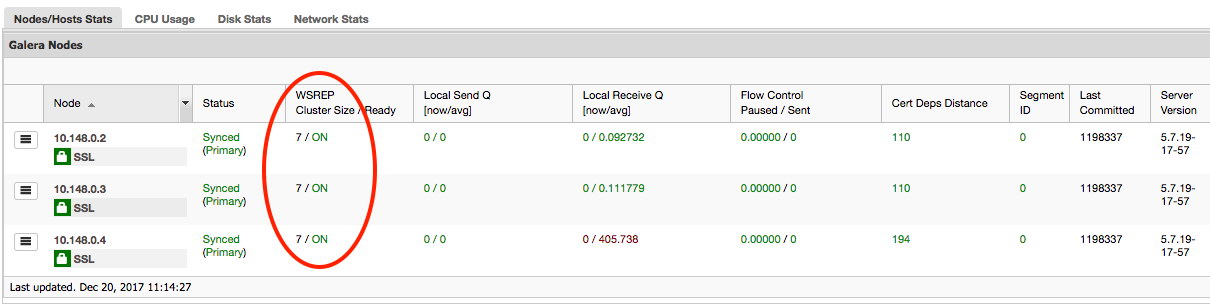
Galera nodes and the cluster requires the wsrep API to report several statuses, which is exposed. There are currently 34 dedicated status variables can be viewed with SHOW STATUS statement.

mysql> SHOW STATUS LIKE 'wsrep_%';
wsrep_apply_oooe
wsrep_apply_oool
wsrep_cert_deps_distance
wsrep_cluster_conf_id
wsrep_cluster_size
wsrep_cluster_state_uuid
wsrep_cluster_status
wsrep_connected
wsrep_flow_control_paused
wsrep_flow_control_paused_ns
wsrep_flow_control_recv
wsrep_local_send_queue_avg
wsrep_local_state_uuid
wsrep_protocol_version
wsrep_provider_name
wsrep_provider_vendor
wsrep_provider_version
wsrep_flow_control_sent
wsrep_gcomm_uuid
wsrep_last_committed
wsrep_local_bf_aborts
wsrep_local_cert_failures
wsrep_local_commits
wsrep_local_index
wsrep_local_recv_queue
wsrep_local_recv_queue_avg
wsrep_local_replays
wsrep_local_send_queue
wsrep_ready
wsrep_received
wsrep_received_bytes
wsrep_replicated
wsrep_replicated_bytes
wsrep_thread_count

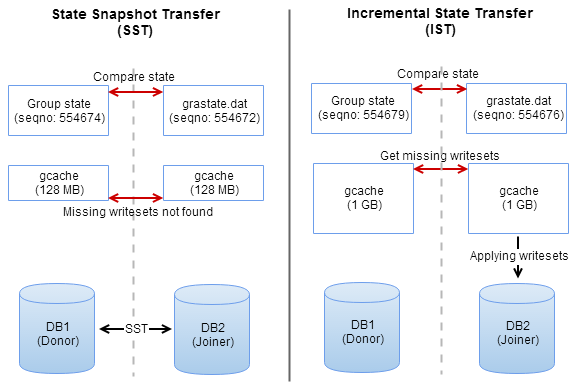
The administration of MySQL Galera Cluster in many aspects is very similar. There are just few exceptions like bootstrapping the cluster from initial node or recovering nodes via SST or IST operations.

Bootstrapping cluster:

$ service mysql bootstrap # sysvinit
$ service mysql start --wsrep-new-cluster # sysvinit
$ galera_new_cluster # systemd
$ mysqld_safe --wsrep-new-cluster # command line

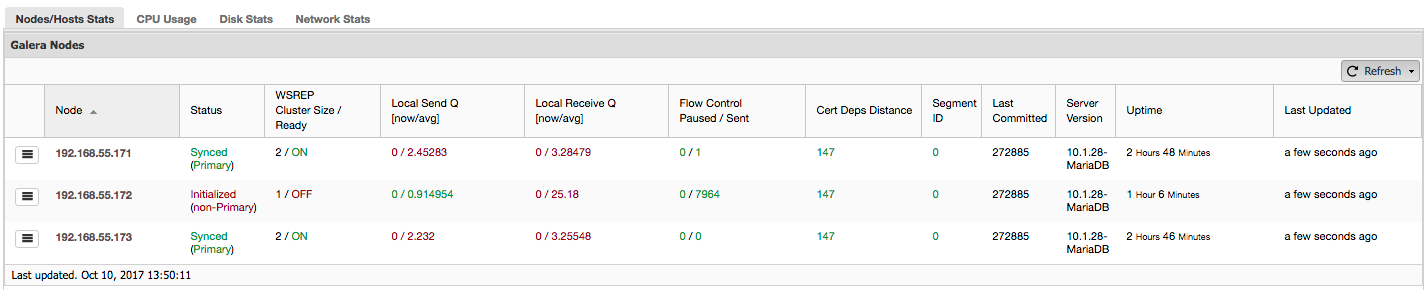
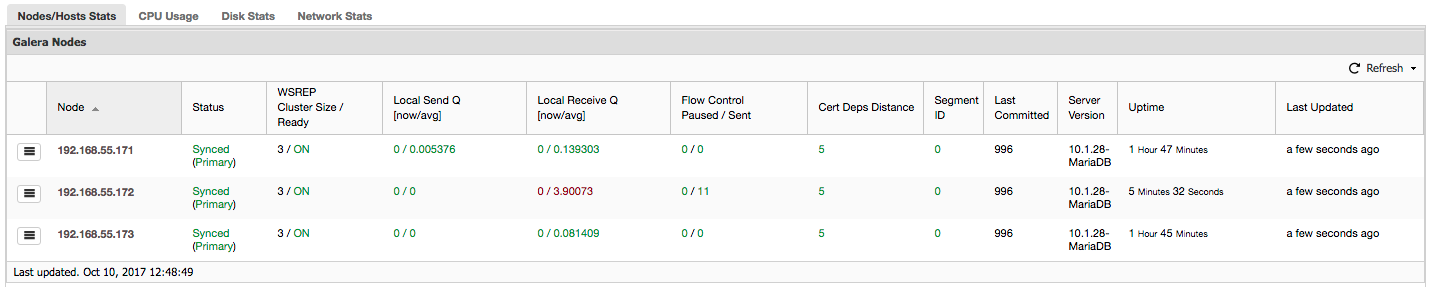
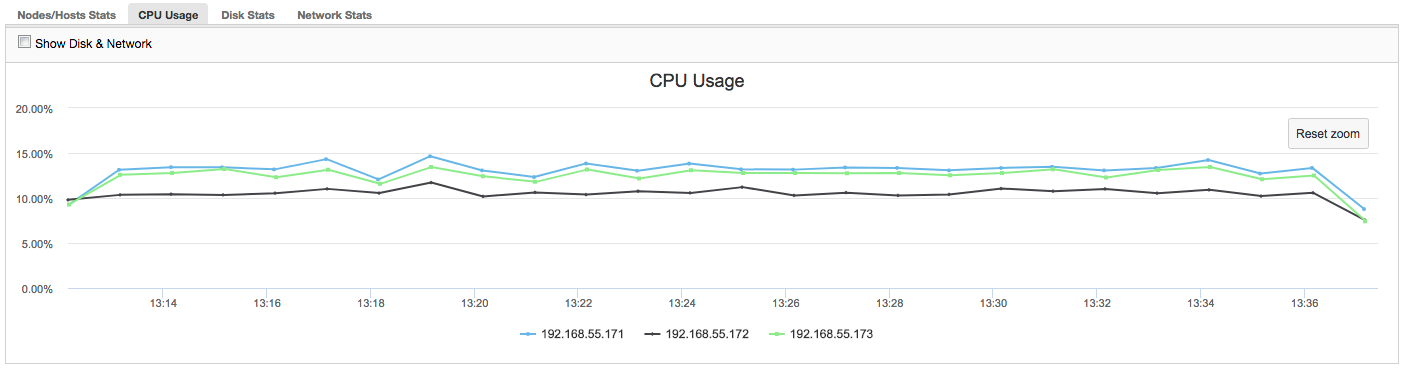
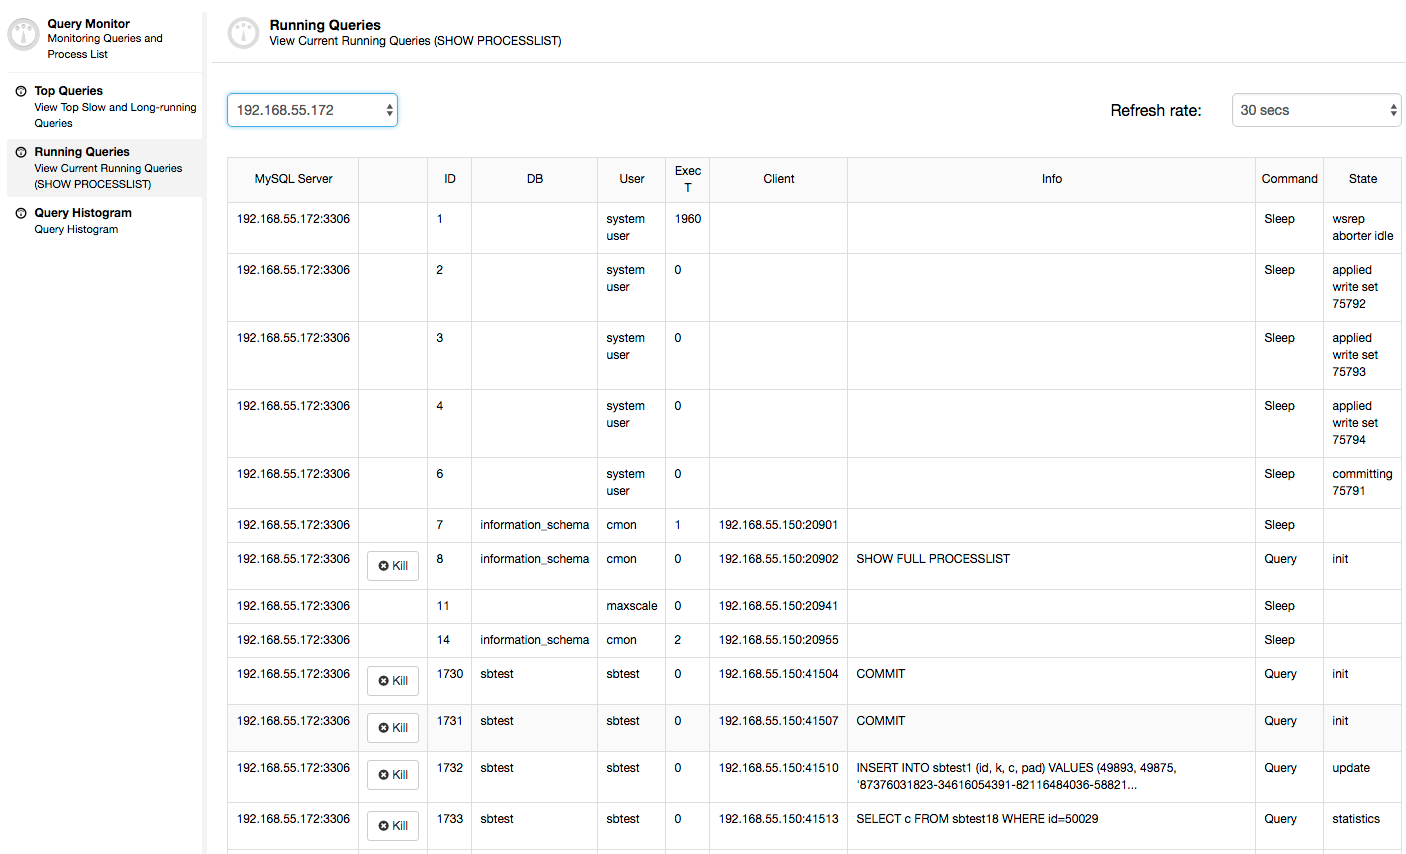
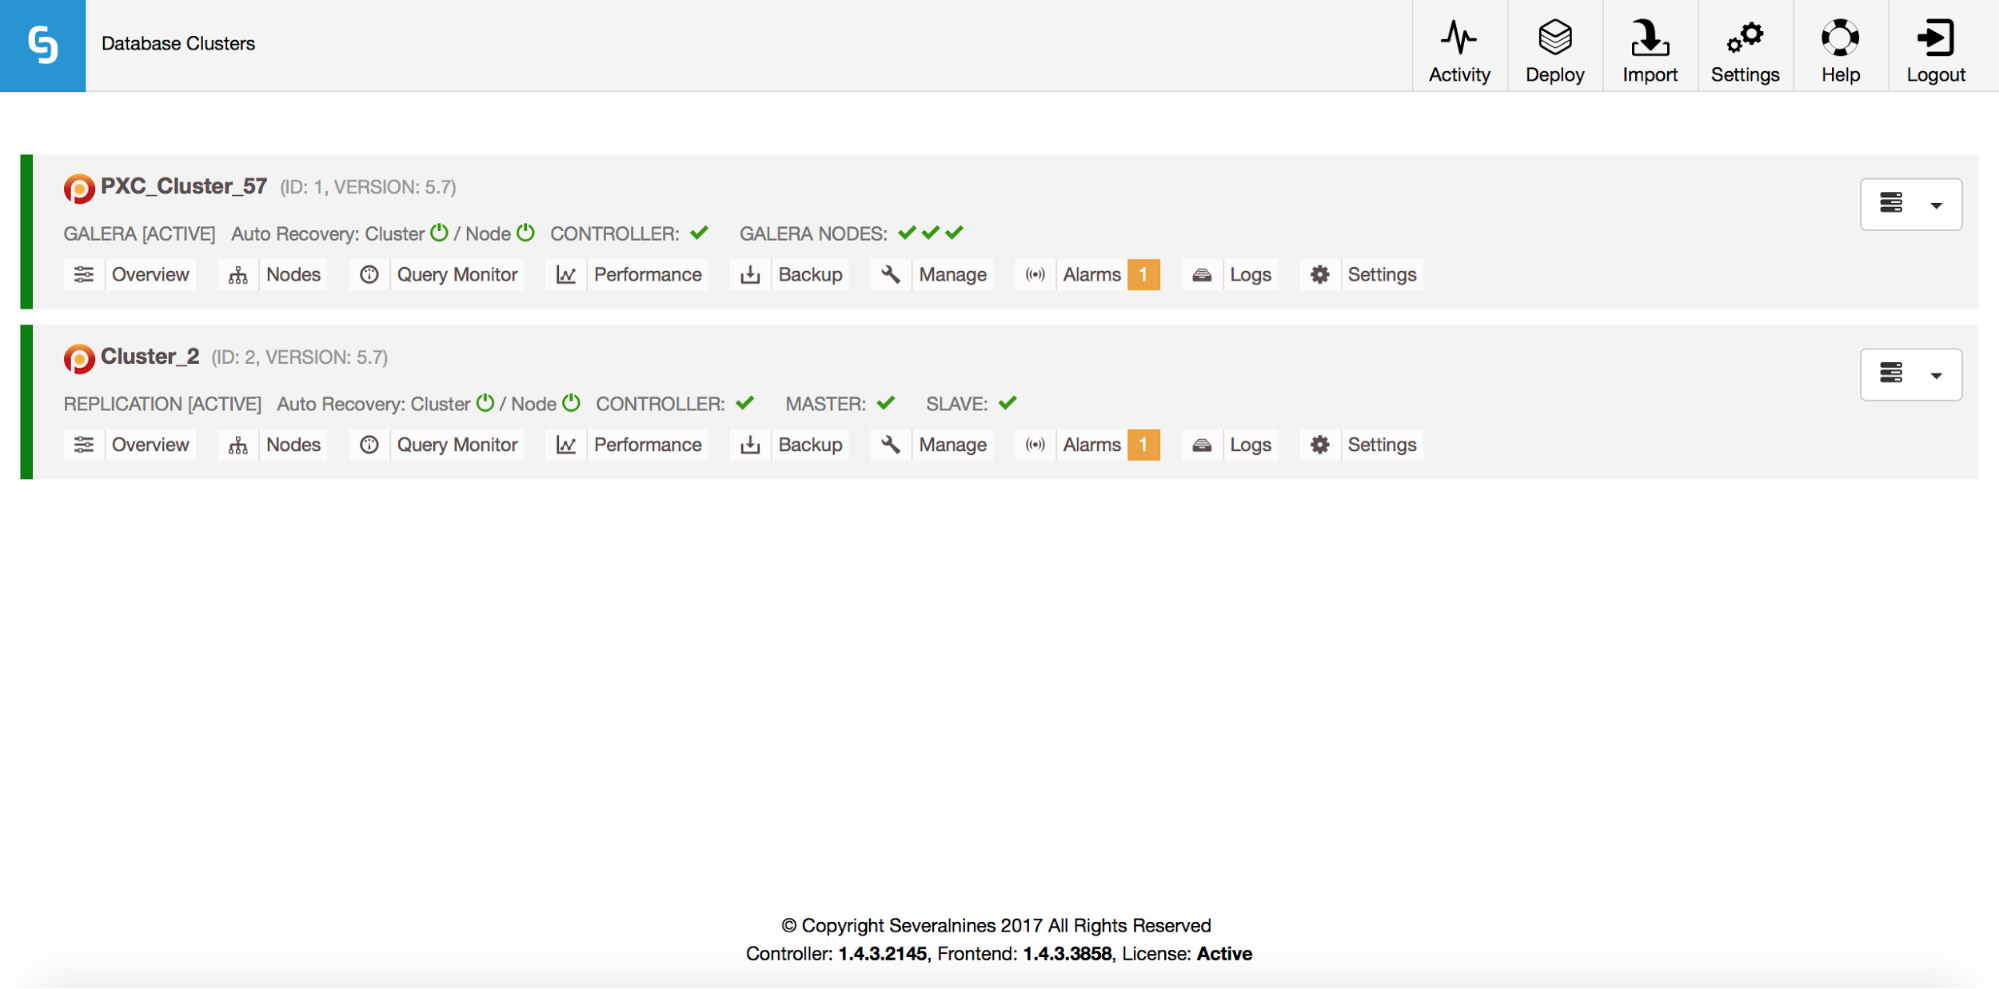
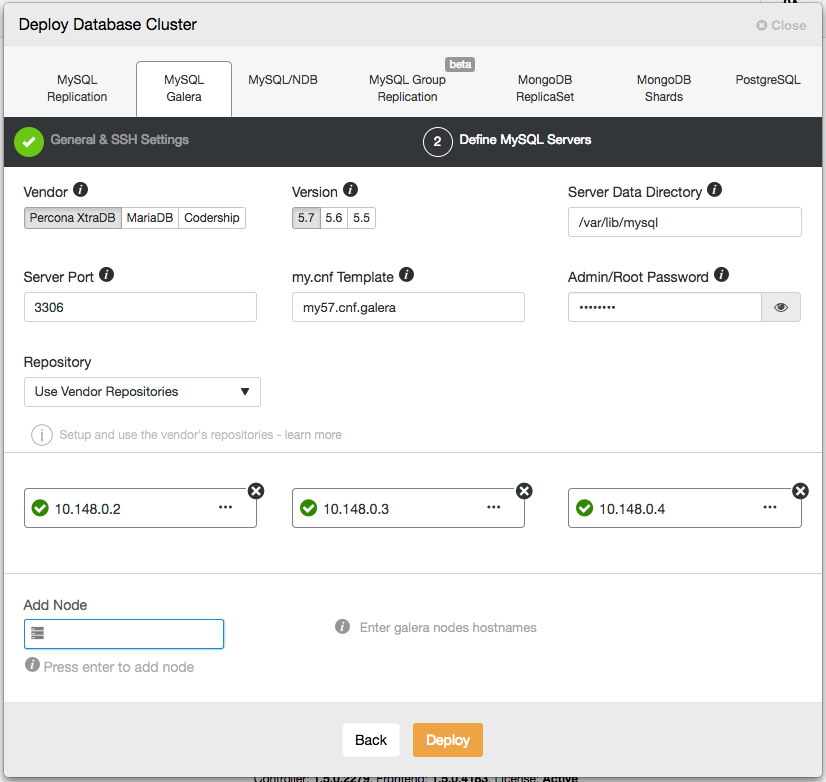
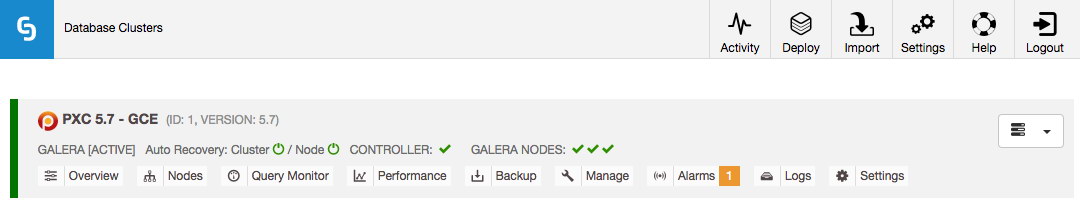
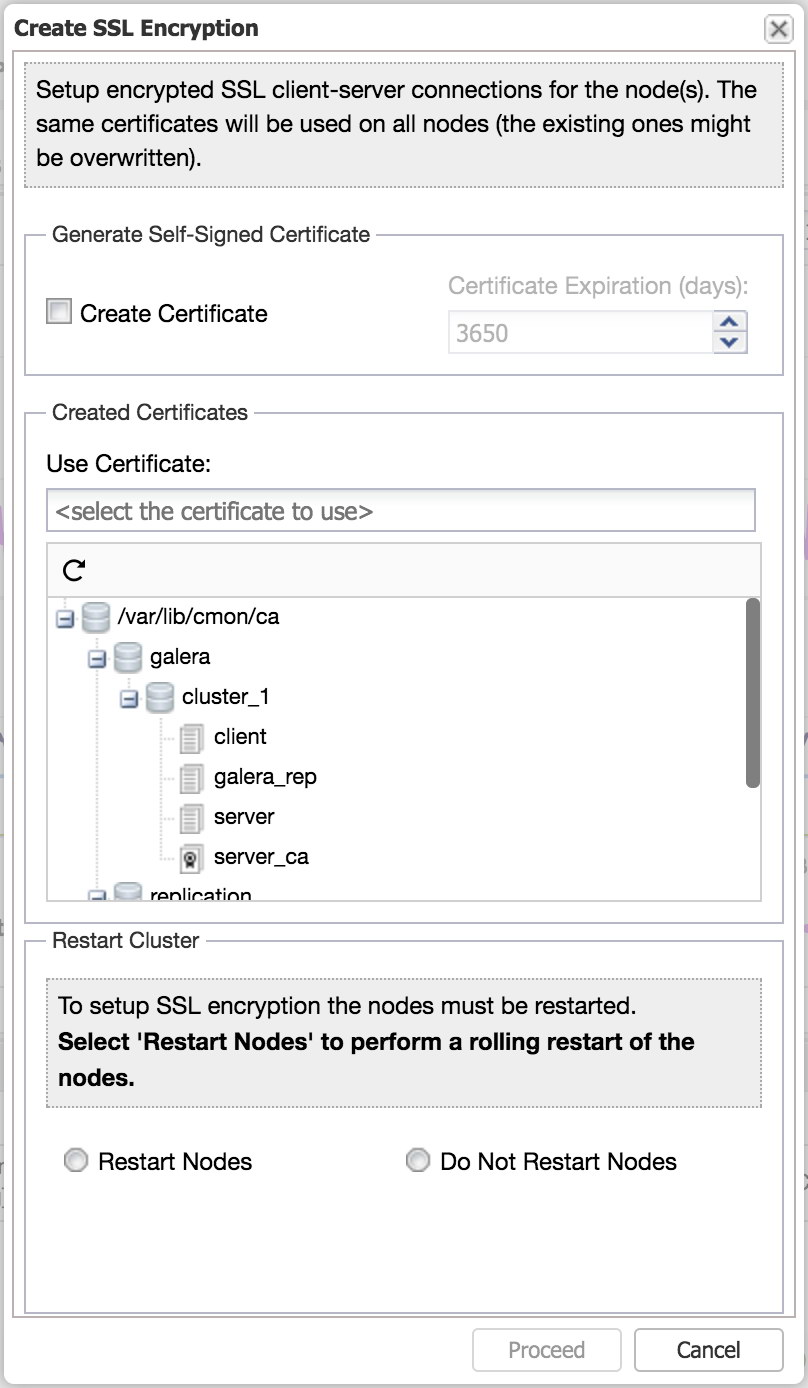
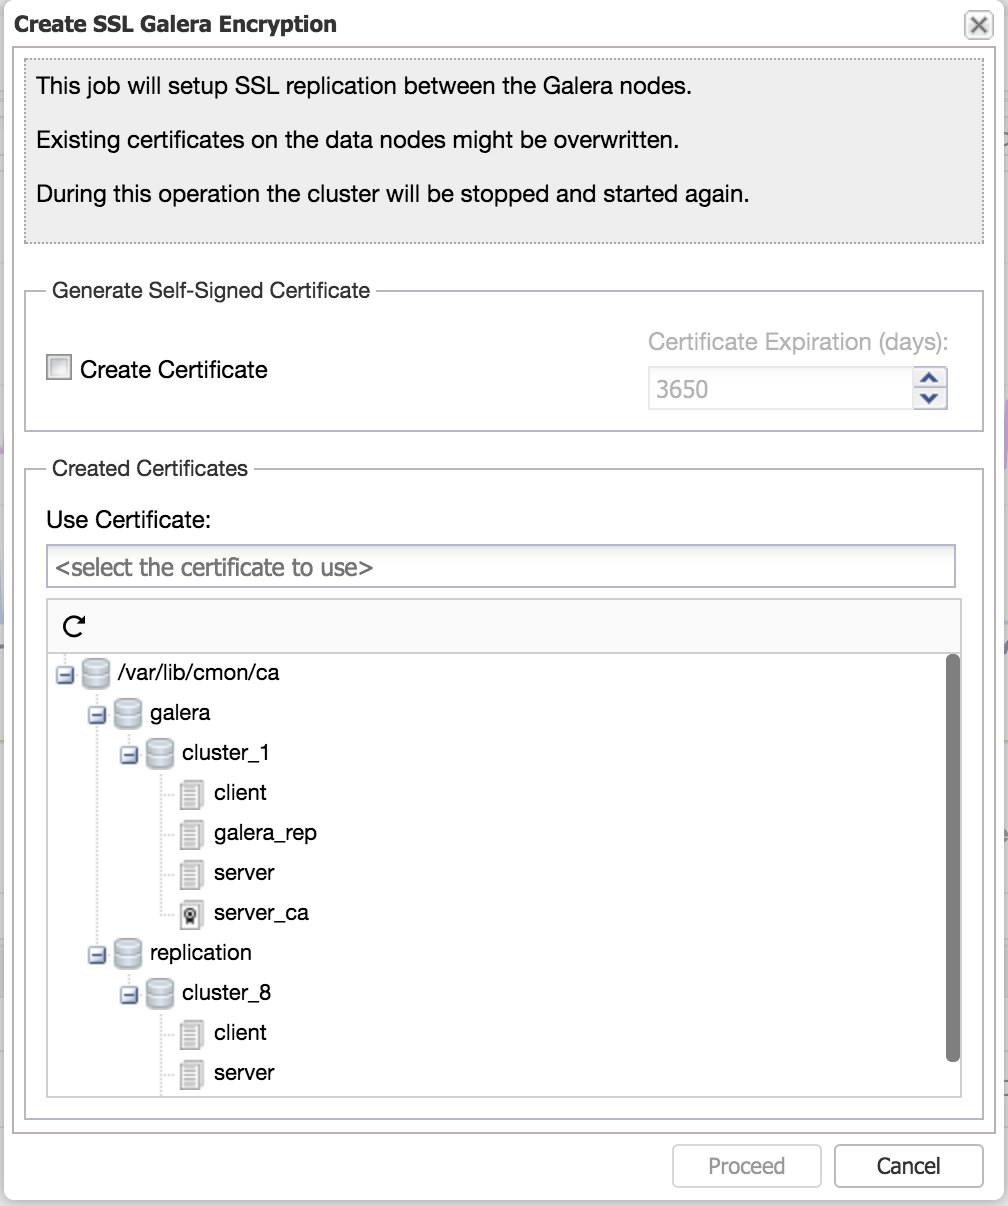
The equivalent Web-based, out of the box solution to manage and monitor Galera Cluster is ClusterControl. It provides a web-based interface to deploy clusters, monitors key metrics, provides database advisors, and take care of management tasks like backup and restore, automatic patching, traffic encryption and availability management.

Restrictions on workload

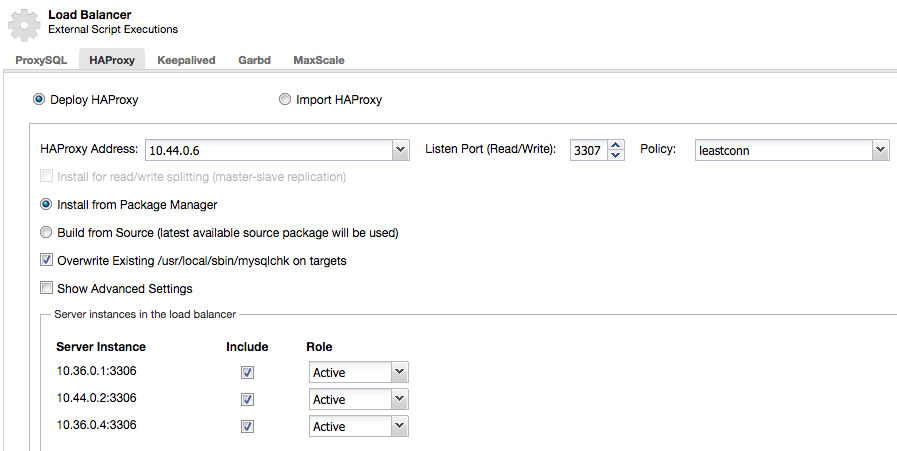
Oracle provides SCAN technology which we found missing in Galera Cluster. The benefit of SCAN is that the client’s connection information does not need to change if you add or remove nodes or databases in the cluster. When using SCAN, the Oracle database randomly connects to one of the available SCAN listeners (typically three) in a round robin fashion and balances the connections between them. Two kinds load balancing can be configured: client side, connect time load balancing and on the server side, run time load balancing. Although there is nothing similar within Galera cluster itself, the same functionality can be addressed with additional software like ProxySQL, HAProxy, Maxscale combined with Keepalived.

When it comes to application workload design for Galera Cluster, you should avoid conflicting updates on the same row, as it leads to deadlocks across the cluster. Avoid bulk inserts or updates, as these might be larger than the maximum allowed writeset. That might also cause cluster stalls.

Designing Oracle HA with RAC you need to keep in mind that RAC only protects against server failure, and you need to mirror the storage and have network redundancy. Modern web applications require access to location-independent data services, and because of RAC’s storage architecture limitations, it can be tricky to achieve. You also need to spend a notable amount of time to gain relevant knowledge to manage the environment; it is a long process. On the application workload side, there are some drawbacks. Distributing separated read or write operations on the same dataset is not optimal because latency is added by supplementary internode data exchange. Things like partitioning, sequence cache, and sorting operations should be reviewed before migrating to RAC.

Multi data-center redundancy

According to the Oracle documentation, the maximum distance between two boxes connected in a point-to-point fashion and running synchronously can be only 10 km. Using specialized devices, this distance can be increased to 100 km.

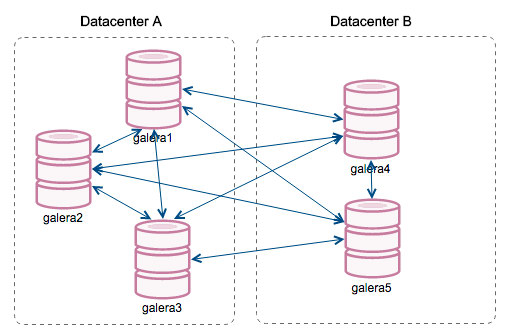
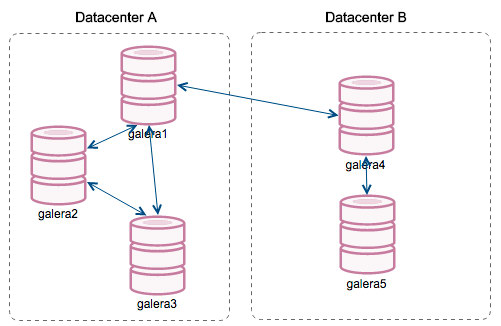
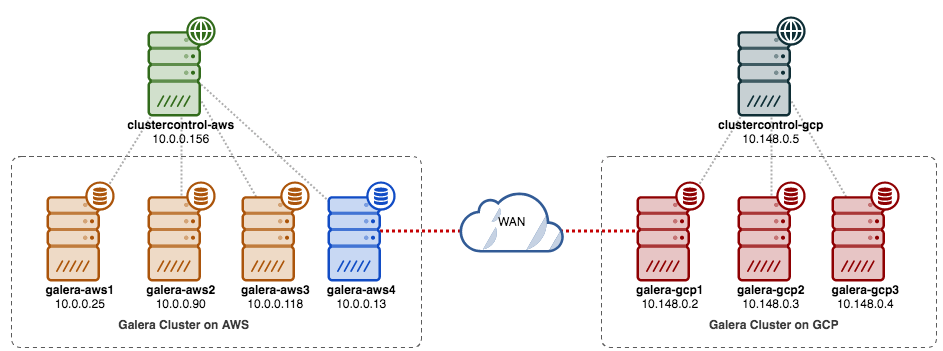
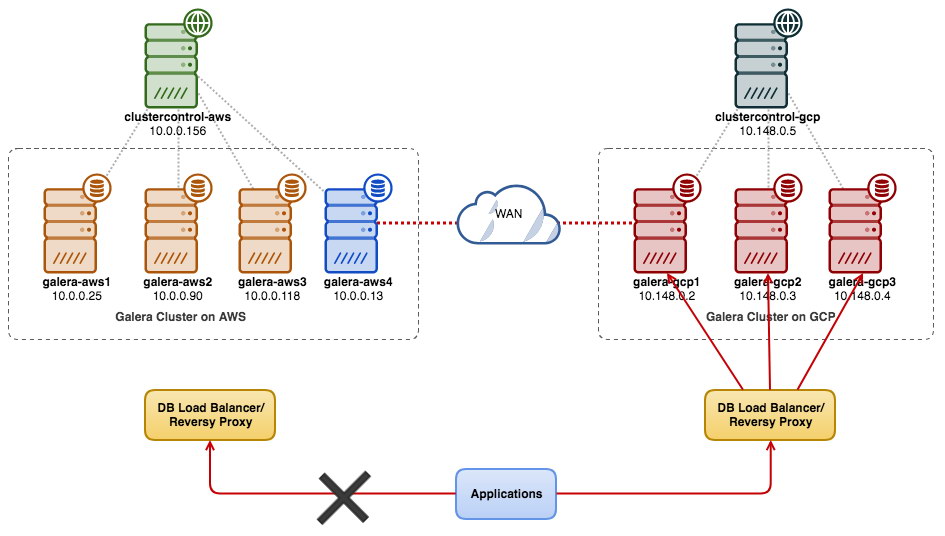
Galera Cluster is well known for its multi-datacenter replication capabilities. It has rich support for Wider Area Networks network settings. It can be configured for high network latency by taking Round-Trip Time (RTT) measurements between cluster nodes and adjusting necessary parameters. The wsrep_provider_options parameters allow you to configure settings like suspect_timeout, interactive_timeout, join_retrans_timouts and many more.

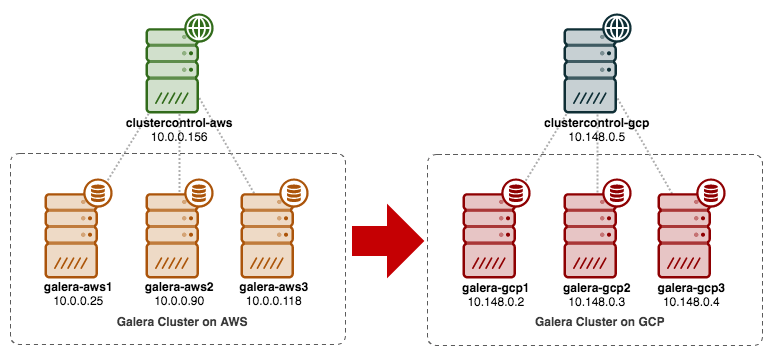
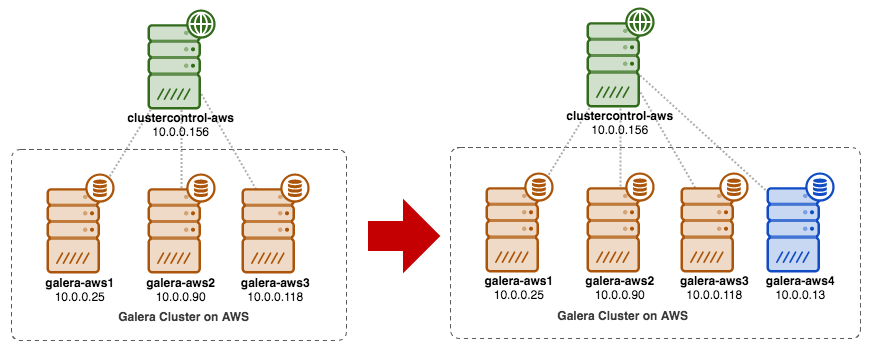
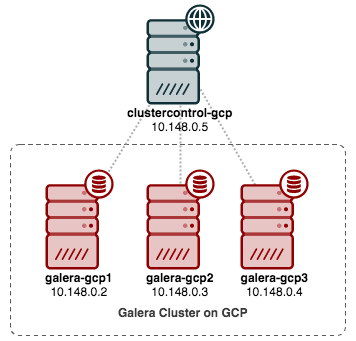
Using Galera and RAC in Cloud

Per Oracle note www.oracle.com/technetwork/database/options/.../rac-cloud-support-2843861.pdf no third-party cloud currently meets Oracle’s requirements regarding natively provided shared storage. “Native” in this context means that the cloud provider must support shared storage as part of their infrastructure as per Oracle’s support policy.

Thanks to its shared nothing architecture, which is not tied to a sophisticated storage solution, Galera cluster can be easily deployed in a cloud environment. Things like:

  • optimized network protocol,
  • topology-aware replication,
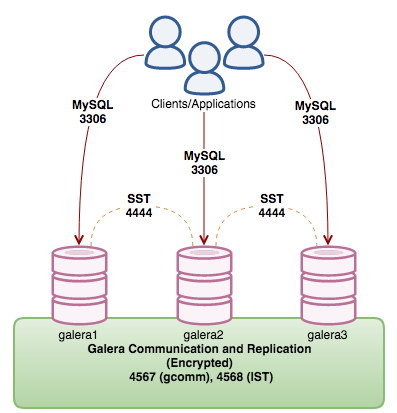
  • traffic encryption,
  • detection and automatic eviction of unreliable nodes,

makes cloud migration process more reliable.

Licenses and hidden costs

Oracle licensing is a complex topic and would require a separate blog article. The cluster factor makes it even more difficult. The cost goes up as we have to add some options to license a complete RAC solution. Here we just want to highlight what to expect and where to find more information.

RAC is a feature of Oracle Enterprise Edition license. Oracle Enterprise license is split into two types, per named user and per processor. If you consider Enterprise Edition with per core license, then the single core cost is RAC 23,000 USD + Oracle DB EE 47,500 USD, and you still need to add a ~ 22% support fee. We would like to refer to a great blog on pricing found on https://flashdba.com/2013/09/18/the-real-cost-of-oracle-rac/.

Flashdba calculated the price of a four node Oracle RAC. The total amount was 902,400 USD plus additional 595,584 USD for three years DB maintenance, and that does not include features like partitioning or in-memory database, all that with 60% Oracle discount.

Galera Cluster is an open source solution that anyone can run for free. Subscriptions are available for production implementations that require vendor support. A good TCO calculation can be found at https://severalnines.com/blog/database-tco-calculating-total-cost-ownership-mysql-management.

Conclusion

While there are significant differences in architecture, both clusters share the main principles and can achieve similar goals. Oracle enterprise product comes with everything out of the box (and it's price). With a cost in the range of >1M USD as seen above, it is a high-end solution that many enterprises would not be able to afford. Galera Cluster can be described as a decent high availability solution for the masses. In certain cases, Galera may well be a very good alternative to Oracle RAC. One drawback is that you have to build your own stack, although that can be completely automated with ClusterControl. We’d love to hear your thoughts on this.

How to Make Your MySQL or MariaDB Database Highly Available on AWS and Google Cloud

$
0
0

Running databases on cloud infrastructure is getting increasingly popular these days. Although a cloud VM may not be as reliable as an enterprise-grade server, the main cloud providers offer a variety of tools to increase service availability. In this blog post, we’ll show you how to architect your MySQL or MariaDB database for high availability, in the cloud. We will be looking specifically at Amazon Web Services and Google Cloud Platform, but most of the tips can be used with other cloud providers too.

Both AWS and Google offer database services on their clouds, and these services can be configured for high availability. It is possible to have copies in different availability zones (or zones in GCP), in order to increase your chances to survive partial failure of services within a region. Although a hosted service is a very convenient way of running a database, note that the service is designed to behave in a specific way and that may or may not fit your requirements. So for instance, AWS RDS for MySQL has a pretty limited list of options when it comes to failover handling. Multi-AZ deployments come with 60-120 seconds failover time as per the documentation. In fact, given the “shadow” MySQL instance has to start from a “corrupted” dataset, this may take even longer as more work could be required on applying or rolling back transactions from InnoDB redo logs. There is an option to promote a slave to become a master, but it is not feasible as you cannot reslave existing slaves off the new master. In the case of a managed service, it is also intrinsically more complex and harder to trace performance problems. More insights on RDS for MySQL and its limitations in this blog post.

On the other hand, if you decide to manage the databases, you are in a different world of possibilities. A number of things that you can do on bare metal are also possible on EC2 or Compute Engine instances. You do not have the overhead of managing the underlying hardware, and yet retain control on how to architect the system. There are two main options when designing for MySQL availability - MySQL replication and Galera Cluster. Let’s discuss them.

MySQL Replication

MySQL replication is a common way of scaling MySQL with multiple copies of the data. Asynchronous or semi-synchronous, it allows to propagate changes executed on a single writer, the master, to replicas/slaves - each of which would contain the full data set and can be promoted to become the new master. Replication can also be used for scaling reads, by directing read traffic to replicas and offloading the master in this way. The main advantage of replication is the ease of use - it is so widely known and popular (it’s also easy to configure) that there are numerous resources and tools to help you manage and configure it. Our own ClusterControl is one of them - you can use it to easily deploy a MySQL replication setup with integrated load balancers, manage topology changes, failover/recovery, and so on.

One major issue with MySQL replication is that it is not designed to handle network splits or master’s failure. If a master goes down, you have to promote one of the replicas. This is a manual process, although it can be automated with external tools (e.g. ClusterControl). There is also no quorum mechanism and there is no support for fencing of failed master instances in MySQL replication. Unfortunately, this may lead to serious issues in distributed environments - if you promoted a new master while your old one comes back online, you may end up writing to two nodes, creating data drift and causing serious data consistency issues.

We’ll look into some examples later in this post, that shows you how to detect network splits and implement STONITH or some other fencing mechanism for your MySQL replication setup.

Galera Cluster

We saw in the previous section that MySQL replication lacks fencing and quorum support - this is where Galera Cluster shines. It has a quorum support built-in, it also has a fencing mechanism which prevents partitioned nodes from accepting writes. This makes Galera Cluster more suitable than replication in multi-datacenter setups. Galera Cluster also supports multiple writers, and is able to resolve write conflicts. You are therefore not limited to a single writer in a multi-datacenter setup, it is possible to have a writer in every datacenter which reduces the latency between your application and database tier. It does not speed up writes as every write still has to be sent to every Galera node for certification, but it’s still easier than to send writes from all application servers across WAN to one single remote master.

As good as Galera is, it is not always the best choice for all workloads. Galera is not a drop-in replacement for MySQL/InnoDB. It shares common features with “normal” MySQL -  it uses InnoDB as storage engine, it contains the entire dataset on every node, which makes JOINs feasible. Still, some of the performance characteristics of Galera (like the performance of writes which are affected by network latency) differ from what you’d expect from replication setups. Maintenance looks different too: schema change handling works slightly different. Some schema designs are not optimal: if you have hotspots in your tables, like frequently updated counters, this may lead to performance issues. There is also a difference in best practices related to batch processing - instead of executing queries in large transactions, you want your transactions to be small.

Proxy tier

It is very hard and cumbersome to build a highly available setup without proxies. Sure, you can write code in your application to keep track of database instances, blacklist unhealthy ones, keep track of the writeable master(s), and so on. But this is much more complex than just sending traffic to a single endpoint - which is where a proxy comes in. ClusterControl allows you to deploy ProxySQL, HAProxy and MaxScale. We will give some examples using ProxySQL, as it gives us good flexibility in controlling database traffic.

ProxySQL can be deployed in a couple of ways. For starters, it can be deployed on separate hosts and Keepalived can be used to provide Virtual IP. The Virtual IP will be moved around should one of the ProxySQL instances fail. In the cloud, this setup can be problematic as adding an IP to the interface usually is not enough. You would have to modify Keepalived configuration and scripts to work with elastic IP (or static -however it might be called by your cloud provider). Then one would use cloud API or CLI to relocate this IP address to another host. For this reason, we’d suggest to collocate ProxySQL with the application. Each application server would be configured to connect to the local ProxySQL, using Unix sockets. As ProxySQL uses an angel process, ProxySQL crashes can be detected/restarted within a second. In case of hardware crash, that particular application server will go down along with ProxySQL. The remaining application servers can still access their respective local ProxySQL instances. This particular setup has additional features. Security - ProxySQL, as of version 1.4.8, does not have support for client-side SSL. It can only setup SSL connection between ProxySQL and the backend. Collocating ProxySQL on the application host and using Unix sockets is a good workaround. ProxySQL also has the ability to cache queries and if you are going to use this feature, it makes sense to keep it as close to the application as possible to reduce latency. We would suggest to use this pattern to deploy ProxySQL.

Typical setups

Let’s take a look at examples of highly available setups.

Single datacenter, MySQL replication

The assumption here is that there are two separate zones within the datacenter. Each zone has redundant and separate power, networking and connectivity to reduce the likelihood of two zones failing simultaneously. It is possible to set up a replication topology spanning both zones.

Here we use ClusterControl to manage the failover. To solve the split-brain scenario between availability zones, we collocate the active ClusterControl with the master. We also blacklist slaves in the other availability zone to make sure that automated failover won’t result in two masters being available.

Multiple datacenters, MySQL replication

In this example we use three datacenters and Orchestrator/Raft for quorum calculation. You might have to write your own scripts to implement STONITH if master is in the partitioned segment of the infrastructure. ClusterControl is used for node recovery and management functions.

Multiple datacenters, Galera Cluster

In this case we use three datacenters with a Galera arbitrator in the third one - this makes possible to handle whole datacenter failure and reduces a risk of network partitioning as the third datacenter can be used as a relay.

For further reading, take a look at the “How to Design Highly Available Open Source Database Environments” whitepaper and watch the webinar replay “Designing Open Source Databases for High Availability”.

Viewing all 210 articles
Browse latest View live