Quantcast
Channel: Severalnines - Galera Cluster
Viewing all 210 articles
Browse latest View live

Webinar Replay & Slides: How to build scalable database infrastructures with MariaDB & HAProxy

$
0
0

Thanks to everyone who participated in last week’s live webinar on how CloudStats.me moved from MySQL to clustered MariaDB for high availability with Severalnines ClusterControl. The webinar included use case discussions on cloudstats.me’s database infrastructure bundled with a live demonstration of ClusterControl to illustrate the key elements that were discussed.

We had a lot of questions in the audience and you can read through the transcript of these further below in this blog.

If you missed the session and/or would like to watch the replay in your own time, it is now available online for sign up and viewing.

Replay Details

Get access to the replay

Agenda

  • CloudStats.me infrastructure overview
  • Database challenges
  • Limitations in cloud-based infrastructure
  • Scaling MySQL - many options
    • MySQL Cluster, Master-Slave Replication, Sharding, ...
  • Availability and failover
  • Application sharding vs auto-sharding
  • Migration to MariaDB / Galera Cluster with ClusterControl & NoSQL
  • Load Balancing with HAProxy & MaxScale
  • Infrastructure set up provided to CloudStats.me
    • Private Network, Cluster Nodes, H/W SSD Raid + BBU
  • What we learnt - “Know your data!”

Speakers

Andrey Vasilyev, CTO of Aqua Networks Limited - a London-based company which owns brands, such as WooServers.com, CloudStats.me and CloudLayar.com, and Art van Scheppingen, Senior Support Engineer at Severalnines, discussed the challenges encountered by CloudStats.me in achieving database high availability and performance, as well as the solutions that were implemented to overcome these challenges.

If you have any questions or would like a personalised live demo, please do contact us.

Follow our technical blogs: http://severalnines.com/blog


Questions & Answers - Transcript

Maybe my question is not directly related to the topic of the webinar... But will your company (I mean Severalnines) in the future also consider the possibility to install and setup Pivotal's Greenplum database?
Currently, there are no plans for us that, as we have not received requests to support Greenplum yet. But it’s something we’ll keep in mind!

What about Spider and ClusterControl? Is this combination available / being used?
Spider can be used independently of ClusterControl, since ClusterControl can be used to manage the individual MySQL instances. We are not aware of any ClusterControl users who are using Spider.

Is MySQL Cluster NDB much faster than a Galera Cluster?
MySQL NDB and Galera Cluster are two different types of clustering. The main difference is that in Galera Cluster all nodes are equal and contain the same dataset, while with NDB Cluster the data nodes contain sharded/mirrored data sets. NDB Cluster can handle larger data sets to write, but if you need multiple equal MySQL master nodes Galera is a better choice. Galera is also faster in replicating data than a traditional MySQL replication due to the ability to write all queries in parallel.

Does CloudStats also support database backups on the end user level?
CloudStats can backup your files to S3, Azure, locally etc., but for database backup, it’s best to use ClusterControl, while CloudStats is for the rest of files.

Is it possible to restore the structure and the whole setup of a previous ClusterControl infrastructure from the backups?
Yes, that would be possible, if you make backups of your existing ClusterControl database and configuration files.

I'm using Maxscale with Galera. The Read/Write Split modules drop the connection on very intensive operations involving reading and then writing of rows up to 80,000, but works fine with readconnroute module (which doesn't split). Anyway I can scale writes involving just Galera?
You could create two readconnroute interfaces using MaxScale and use one for writes only. You can do this by adding router_options=master to the configuration and with a Galera cluster this will only write to one single node in the Galera cluster.

Cluster is fast as the slowest node? like NODE1-SSD, NODE2-SSD, NODE3-SATA...
Yes, within Galera Cluster your slowest node will determine the speed of the whole cluster

Galera cluster is INNODB only. If it is. Is it recommended not to use MyISAM?
In principle Galera is InnoDB only, however there is limited support for MyISAM if you encapsulate your queries in a transaction. As there is no guarantee the data will be kept equal on all nodes due to MyISAM not being a transactional storage engine and this could cause data drift to happen. Using MyISAM with Galera is not advised to do.

Virtualized nodes should then be on SSD host storage. Not network storage because IOPS will be low. Correct?
Yes, that's correct, its best to store it on a local ssd.

MySQLdump is slow right?
MySQLdump is dumping the entire contents of your database as a logical backup and therefore slower than Xtrabackup.

HAProxy instances are installed on 2x cluster control servers?
HAProxy instances are usually installed on dedicated hosts, not on the CC node.

What about MySQL proxy, and use cases with that tool? And would it be better to just split query R/W at application level?
MySQL proxy can be used, but the tool is not maintained anymore and we found HAProxy and MaxScale are better options.

HAProxy can run custom scripts and these statuses can also be manually created right?
Exactly, you can do that. ClusterControl just has a few preset checks by default but you can change them if you like

In your experience, how does EC2 perform with a MariaDB based cluster?
According to our Benchmarks, EC2 M3.Xlarge instances showed a Read Output performance of 16914 and Write Input Performance of 31092, which is 2 times higher than a similar sized Microsoft Azure DS3 instance (16329 iops for Reads and 15900 iops for Writes). So yes, according to our test AWS might perform better than Azure for Write performance, but it will depend on your application size and requirements. A local SSD storage on a server might be recommended for higher iops performance.

Blue - Reads
Red  - Writes

Does WooServers offer PCI DSS compliant servers?
Yes, WooServers offer PCI DSS servers and are able to manage your current infrastructure that you have, either on Azure, on premises or AWS.

AAA pluggable / scriptable? A customer came up with Radius recently…
Unfortunately the authentication/authorization is limited to either ClusterControl internal AAA or LDAP only.

Also: GUI functions accessible via JSON/HTTP API ?
Yes, our most important GUI functions are available through our RPC api. So you would be able to automate deploying, backups and scaling easily.


Severalnines Launches #MySQLHA CrowdChat

$
0
0

Today we launch our live CrowdChat on everything #MySQLHA!

This CrowdChat is brought to you by Severalnines and is hosted by a community of subject matter experts. CrowdChat is a community platform that works across Facebook, Twitter, and LinkedIn to allow users to discuss a topic using a specific #hashtag. This crowdchat focuses on the hashtag #MySQLHA. So if you’re a DBA, architect, CTO, or a database novice register to join and become part of the conversation!

Join this online community to interact with experts on Galera clusters. Get your questions answered and join the conversation around everything #MySQLHA.

Register free

Meet the experts

Art van Scheppingen is a Senior Support Engineer at Severalnines. He’s a pragmatic MySQL and Database expert with over 15 years experience in web development. He previously worked at Spil Games as Head of Database Engineering, where he kept a broad vision upon the whole database environment: from MySQL to Couchbase, Vertica to Hadoop and from Sphinx Search to SOLR. He regularly presents his work and projects at various conferences (Percona Live, FOSDEM) and related meetups.

Krzysztof Książek is a Senior Support Engineer at Severalnines, is a MySQL DBA with experience managing complex database environments for companies like Zendesk, Chegg, Pinterest and Flipboard.

Ashraf Sharif is a System Support Engineer at Severalnines. He has previously worked as principal consultant and head of support team and delivered clustering solutions for big websites in the South East Asia region. His professional interests focus on system scalability and high availability.

Vinay Joosery is a passionate advocate and builder of concepts and businesses around Big Data computing infrastructures. Prior to co-founding Severalnines, Vinay held the post of Vice-President EMEA at Pentaho Corporation - the Open Source BI leader. He has also held senior management roles at MySQL / Sun Microsystems / Oracle, where he headed the Global MySQL Telecoms Unit, and built the business around MySQL's High Availability and Clustering product lines. Prior to that, Vinay served as Director of Sales & Marketing at Ericsson Alzato, an Ericsson-owned venture focused on large scale real-time databases.

MySQL on Docker: Introduction to Docker Swarm Mode and Multi-Host Networking

$
0
0

In the previous blog post, we looked into Docker’s single-host networking for MySQL containers. This time, we are going to look into the basics of multi-host networking and Docker swarm mode, a built-in orchestration tool to manage containers across multiple hosts.

Docker Engine - Swarm Mode

Running MySQL containers on multiple hosts can get a bit more complex depending on the clustering technology you choose.

Before we try to run MySQL on containers + multi-host networking, we have to understand how the image works, how much resources to allocate (disk,memory,CPU), networking (the overlay network drivers - default, flannel, weave, etc) and fault tolerance (how is the container relocated, failed over and load balanced). Because all these will impact the overall operations, uptime and performance of the database. It is recommended to use an orchestration tool to get more manageability and scalability on top of your Docker engine cluster. The latest Docker Engine (version 1.12, released on July 14th, 2016) includes swarm mode for natively managing a cluster of Docker Engines called a Swarm. Take note that Docker Engine Swarm mode and Docker Swarm are two different projects, with different installation steps despite they both work in a similar way.

Some of the noteworthy parts that you should know before entering the swarm world:

  • The following ports must be opened:
    • 2377 (TCP) - Cluster management
    • 7946 (TCP and UDP) - Nodes communication
    • 4789 (TCP and UDP) - Overlay network traffic
  • There are 2 types of nodes:
    • Manager - Manager nodes perform the orchestration and cluster management functions required to maintain the desired state of the swarm. Manager nodes elect a single leader to conduct orchestration tasks.
    • Worker - Worker nodes receive and execute tasks dispatched from manager nodes. By default, manager nodes are also worker nodes, but you can configure managers to be manager-only nodes.

More details in the Docker Engine Swarm documentation.

In this blog, we are going to deploy application containers on top of a load-balanced Galera Cluster on 3 Docker hosts (docker1, docker2 and docker3), connected through an overlay network as a proof of concept for MySQL clustering in multiple Docker hosts environment. We will use Docker Engine Swarm mode as the orchestration tool.

“Swarming” Up

Let’s cluster our Docker nodes into a Swarm. Swarm mode requires an odd number of managers (obviously more than one) to maintain quorum for fault tolerance. So, we are going to use all the physical hosts as manager nodes. Note that by default, manager nodes are also worker nodes.

  1. Firstly, initialize Swarm mode on docker1. This will make the node as manager and leader:

    [root@docker1]$ docker swarm init --advertise-addr 192.168.55.111
    Swarm initialized: current node (6r22rd71wi59ejaeh7gmq3rge) is now a manager.
    
    To add a worker to this swarm, run the following command:
    
        docker swarm join \
        --token SWMTKN-1-16kit6dksvrqilgptjg5pvu0tvo5qfs8uczjq458lf9mul41hc-dzvgu0h3qngfgihz4fv0855bo \
        192.168.55.111:2377
    
    To add a manager to this swarm, run 'docker swarm join-token manager' and follow the instructions.
  2. We are going to add two more nodes as manager. Generate the join command for other nodes to register as manager:

    [docker1]$ docker swarm join-token manager
    To add a manager to this swarm, run the following command:
    
        docker swarm join \
        --token SWMTKN-1-16kit6dksvrqilgptjg5pvu0tvo5qfs8uczjq458lf9mul41hc-7fd1an5iucy4poa4g1bnav0pt \
        192.168.55.111:2377
  3. On docker2 and docker3, run the following command to register the node:

    $ docker swarm join \
        --token SWMTKN-1-16kit6dksvrqilgptjg5pvu0tvo5qfs8uczjq458lf9mul41hc-7fd1an5iucy4poa4g1bnav0pt \
        192.168.55.111:2377
  4. Verify if all nodes are added correctly:

    [docker1]$ docker node ls
    ID                           HOSTNAME       STATUS  AVAILABILITY  MANAGER STATUS
    5w9kycb046p9aj6yk8l365esh    docker3.local  Ready   Active        Reachable
    6r22rd71wi59ejaeh7gmq3rge *  docker1.local  Ready   Active        Leader
    awlh9cduvbdo58znra7uyuq1n    docker2.local  Ready   Active        Reachable

    At the moment, we have docker1.local as the leader. 

Overlay Network

The only way to let containers running on different hosts connect to each other is by using an overlay network. It can be thought of as a container network that is built on top of another network (in this case, the physical hosts network). Docker Swarm mode comes with a default overlay network which implements a VxLAN-based solution with the help of libnetwork and libkv. You can however choose another overlay network driver like Flannel, Calico or Weave, where extra installation steps are necessary. We are going to cover more on that later in an upcoming blog post.

In Docker Engine Swarm mode, you can create an overlay network only from a manager node and it doesn’t need an external key-value store like etcd, consul or Zookeeper.

The swarm makes the overlay network available only to nodes in the swarm that require it for a service. When you create a service that uses an overlay network, the manager node automatically extends the overlay network to nodes that run service tasks.

Let’s create an overlay network for our containers. We are going to deploy Percona XtraDB Cluster and application containers on separate Docker hosts to achieve fault tolerance. These containers must be running on the same overlay network so they can communicate with each other.

We are going to name our network “mynet”. You can only create this on the manager node:

[docker1]$ docker network create --driver overlay mynet

Let’s see what networks we have now:

[docker1]$ docker network ls
NETWORK ID          NAME                DRIVER              SCOPE
213ec94de6c9        bridge              bridge              local
bac2a639e835        docker_gwbridge     bridge              local
5b3ba00f72c7        host                host                local
03wvlqw41e9g        ingress             overlay             swarm
9iy6k0gqs35b        mynet               overlay             swarm
12835e9e75b9        none                null                local

There are now 2 overlay networks with a Swarm scope. The “mynet” network is what we are going to use today when deploying our containers. The ingress overlay network comes by default. The swarm manager uses ingress load balancing to expose the services you want externally to the swarm.

Deployment using Services and Tasks

We are going to deploy the Galera Cluster containers through services and tasks. When you create a service, you specify which container image to use and which commands to execute inside running containers. There are two type of services:

  • Replicated services - Distributes a specific number of replica tasks among the nodes based upon the scale you set in the desired state, for examples “--replicas 3”.
  • Global services - One task for the service on every available node in the cluster, for example “--mode global”. If you have 7 Docker nodes in the Swarm, there will be one container on each of them.

Docker Swarm mode has a limitation in managing persistent data storage. When a node fails, the manager will get rid of the containers and create new containers in place of the old ones to meet the desired replica state. Since a container is discarded when it goes down, we would lose the corresponding data volume as well. Fortunately for Galera Cluster, the MySQL container can be automatically provisioned with state/data when joining.

Deploying Key-Value Store

The docker image that we are going to use is from Percona-Lab. This image requires the MySQL containers to access a key-value store (supports etcd only) for IP address discovery during cluster initialization and bootstrap. The containers will look for other IP addresses in etcd, if there are any, start the MySQL with a proper wsrep_cluster_address. Otherwise, the first container will start with the bootstrap address, gcomm://.

  1. Let’s deploy our etcd service. We will use etcd image available here. It requires us to have a discovery URL on the number of etcd node that we are going to deploy. In this case, we are going to setup a standalone etcd container, so the command is:

    [docker1]$ curl -w "\n"'https://discovery.etcd.io/new?size=1'
    https://discovery.etcd.io/a293d6cc552a66e68f4b5e52ef163d68
  2. Then, use the generated URL as “-discovery” value when creating the service for etcd:

    [docker1]$ docker service create \
    --name etcd \
    --replicas 1 \
    --network mynet \
    -p 2379:2379 \
    -p 2380:2380 \
    -p 4001:4001 \
    -p 7001:7001 \
    elcolio/etcd:latest \
    -name etcd \
    -discovery=https://discovery.etcd.io/a293d6cc552a66e68f4b5e52ef163d68

    At this point, Docker swarm mode will orchestrate the deployment of the container on one of the Docker hosts.

  3. Retrieve the etcd service virtual IP address. We are going to use that in the next step when deploying the cluster:

    [docker1]$ docker service inspect etcd -f "{{ .Endpoint.VirtualIPs }}"
    [{03wvlqw41e9go8li34z2u1t4p 10.255.0.5/16} {9iy6k0gqs35bn541pr31mly59 10.0.0.2/24}]

    At this point, our architecture looks like this:

Deploying Database Cluster

  1. Specify the virtual IP address for etcd in the following command to deploy Galera (Percona XtraDB Cluster) containers:

    [docker1]$ docker service create \
    --name mysql-galera \
    --replicas 3 \
    -p 3306:3306 \
    --network mynet \
    --env MYSQL_ROOT_PASSWORD=mypassword \
    --env DISCOVERY_SERVICE=10.0.0.2:2379 \
    --env XTRABACKUP_PASSWORD=mypassword \
    --env CLUSTER_NAME=galera \
    perconalab/percona-xtradb-cluster:5.6
  2. It takes some time for the deployment where the image will be downloaded on the assigned worker/manager node. You can verify the status with the following command:

    [docker1]$ docker service ps mysql-galera
    ID                         NAME                IMAGE                                  NODE           DESIRED STATE  CURRENT STATE            ERROR
    8wbyzwr2x5buxrhslvrlp2uy7  mysql-galera.1      perconalab/percona-xtradb-cluster:5.6  docker1.local  Running        Running 3 minutes ago
    0xhddwx5jzgw8fxrpj2lhcqeq  mysql-galera.2      perconalab/percona-xtradb-cluster:5.6  docker3.local  Running        Running 2 minutes ago
    f2ma6enkb8xi26f9mo06oj2fh  mysql-galera.3      perconalab/percona-xtradb-cluster:5.6  docker2.local  Running        Running 2 minutes ago
  3. We can see that the mysql-galera service is now running. Let’s list out all services we have now:

    [docker1]$ docker service ls
    ID            NAME          REPLICAS  IMAGE                                  COMMAND
    1m9ygovv9zui  mysql-galera  3/3       perconalab/percona-xtradb-cluster:5.6
    au1w5qkez9d4  etcd          1/1       elcolio/etcd:latest                    -name etcd -discovery=https://discovery.etcd.io/a293d6cc552a66e68f4b5e52ef163d68
  4. Swarm mode has an internal DNS component that automatically assigns each service in the swarm a DNS entry. So you use the service name to resolve to the virtual IP address:

    [docker2]$ docker exec -it $(docker ps | grep etcd | awk {'print $1'}) ping mysql-galera
    PING mysql-galera (10.0.0.4): 56 data bytes
    64 bytes from 10.0.0.4: seq=0 ttl=64 time=0.078 ms
    64 bytes from 10.0.0.4: seq=1 ttl=64 time=0.179 ms

    Or, retrieve the virtual IP address through the “docker service inspect” command:

    [docker1]# docker service inspect mysql-galera -f "{{ .Endpoint.VirtualIPs }}"
    [{03wvlqw41e9go8li34z2u1t4p 10.255.0.7/16} {9iy6k0gqs35bn541pr31mly59 10.0.0.4/24}]

    Our architecture now can be illustrated as below:

Deploying Applications

Finally, you can create the application service and pass the MySQL service name (mysql-galera) as the database host value:

[docker1]$ docker service create \
--name wordpress \
--replicas 2 \
-p 80:80 \
--network mynet \
--env WORDPRESS_DB_HOST=mysql-galera \
--env WORDPRESS_DB_USER=root \
--env WORDPRESS_DB_PASSWORD=mypassword \
wordpress

Once deployed, we can then retrieve the virtual IP address for wordpress service through the “docker service inspect” command:

[docker1]# docker service inspect wordpress -f "{{ .Endpoint.VirtualIPs }}"
[{p3wvtyw12e9ro8jz34t9u1t4w 10.255.0.11/16} {kpv8e0fqs95by541pr31jly48 10.0.0.8/24}]

At this point, this is what we have:

Our distributed application and database setup is now deployed by Docker containers.

ClusterControl
Single Console for Your Entire Database Infrastructure
Deploy, manage, monitor, scale your databases on the technology stack of your choice!

Connecting to the Services and Load Balancing

At this point, the following ports are published (based on the -p flag on each “docker service create” command) on all Docker nodes in the cluster, whether or not the node is currently running the task for the service:

  • etcd - 2380, 2379, 7001, 4001
  • MySQL - 3306
  • HTTP - 80

If we connect directly to the PublishedPort, with a simple loop, we can see that the MySQL service is load balanced among containers:

[docker1]$ while true; do mysql -uroot -pmypassword -h127.0.0.1 -P3306 -NBe 'select @@wsrep_node_address'; sleep 1; done
10.255.0.10
10.255.0.8
10.255.0.9
10.255.0.10
10.255.0.8
10.255.0.9
10.255.0.10
10.255.0.8
10.255.0.9
10.255.0.10
^C

 At the moment, Swarm manager manages the load balancing internally and there is no way to configure the load balancing algorithm. We can then use external load balancers to route outside traffic to these Docker nodes. In case of any of the Docker nodes goes down, the service will be relocated to the other available nodes.

**Warning: The setup shown in this page is just a proof of concept. It may be incomplete for production use and does not cover a full single point of failure (SPOF) setup.

That’s all for now. In the next blog post, we’ll take a deeper look at Docker overlay network drivers for MySQL containers.

How to set up read-write split in Galera Cluster using ProxySQL

$
0
0

Edited on Sep 12, 2016 to correct the description of how ProxySQL handles session variables. Many thanks to Francisco Miguel for pointing this out.


ProxySQL is becoming more and more popular as SQL-aware load balancer for MySQL and MariaDB. In previous blog posts, we covered installation of ProxySQL and its configuration in a MySQL replication environment. We’ve covered how to set up ProxySQL to perform failovers executed from ClusterControl. At that time, Galera support in ProxySQL was a bit limited - you could configure Galera Cluster and split traffic across all nodes but there was no easy way to implement read-write split of your traffic. The only way to do that was to create a daemon which would monitor Galera state and update weights of backend servers defined in ProxySQL - a much more complex task than to write a small bash script.

In one of the recent ProxySQL releases, a very important feature was added - a scheduler, which allows to execute external scripts from within ProxySQL even as often as every millisecond (well, as long as your script can execute within this time frame). This feature creates an opportunity to extend ProxySQL and implement setups which were not possible to build easily in the past due to too low granularity of the cron schedule. In this blog post, we will show you how to take advantage of this new feature and create a Galera Cluster with read-write split performed by ProxySQL.

First, we need to install and start ProxySQL:

[root@ip-172-30-4-215 ~]# wget https://github.com/sysown/proxysql/releases/download/v1.2.1/proxysql-1.2.1-1-centos7.x86_64.rpm

[root@ip-172-30-4-215 ~]# rpm -i proxysql-1.2.1-1-centos7.x86_64.rpm
[root@ip-172-30-4-215 ~]# service proxysql start
Starting ProxySQL: DONE!

Next, we need to download a script which we will use to monitor Galera status. Currently it has to be downloaded separately but in the next release of ProxySQL it should be included in the rpm. The script needs to be located in /var/lib/proxysql.

[root@ip-172-30-4-215 ~]# wget https://raw.githubusercontent.com/sysown/proxysql/master/tools/proxysql_galera_checker.sh

[root@ip-172-30-4-215 ~]# mv proxysql_galera_checker.sh /var/lib/proxysql/
[root@ip-172-30-4-215 ~]# chmod u+x /var/lib/proxysql/proxysql_galera_checker.sh

If you are not familiar with this script, you can check what arguments it accepts by running:

[root@ip-172-30-4-215 ~]# /var/lib/proxysql/proxysql_galera_checker.sh
Usage: /var/lib/proxysql/proxysql_galera_checker.sh <hostgroup_id write> [hostgroup_id read] [number writers] [writers are readers 0|1} [log_file]

As we can see, we need to pass couple of arguments - hostgroups for writers and readers, number of writers which should be active at the same time. We also need to pass information if writers can be used as readers and, finally, path to a log file.

Next, we need to connect to ProxySQL’s admin interface. For that you need to know credentials - you can find them in a configuration file, typically located in /etc/proxysql.cnf:

admin_variables=
{
        admin_credentials="admin:admin"
        mysql_ifaces="127.0.0.1:6032;/tmp/proxysql_admin.sock"
#       refresh_interval=2000
#       debug=true
}

Knowing the credentials and interfaces on which ProxySQL listens, we can connect to the admin interface and begin configuration.

[root@ip-172-30-4-215 ~]# mysql -P6032 -uadmin -padmin -h 127.0.0.1

First, we need to fill mysql_servers table with information about our Galera nodes. We will add them twice, to two different hostgroups. One hostgroup (with hostgroup_id of 0) will handle writes while the second hostgroup (with hostgroup_id of 1) will handle reads.

MySQL [(none)]> INSERT INTO mysql_servers (hostgroup_id, hostname, port) VALUES (0, '172.30.4.238', 3306), (0, '172.30.4.184', 3306), (0, '172.30.4.67', 3306);
Query OK, 3 rows affected (0.00 sec)

MySQL [(none)]> INSERT INTO mysql_servers (hostgroup_id, hostname, port) VALUES (1, '172.30.4.238', 3306), (1, '172.30.4.184', 3306), (1, '172.30.4.67', 3306);
Query OK, 3 rows affected (0.00 sec)

Next, we need to add information about users which will be used by the application. We used a plain text password here but ProxySQL accepts also hashed passwords in MySQL format.

MySQL [(none)]> INSERT INTO mysql_users (username, password, active, default_hostgroup) VALUES ('sbtest', 'sbtest', 1, 0);
Query OK, 1 row affected (0.00 sec)

What’s important to keep in mind is the default_hostgroup setting - we set it to ‘0’ which means that, unless one of query rules say different, all queries will be sent to the hostgroup 0 - our writers.

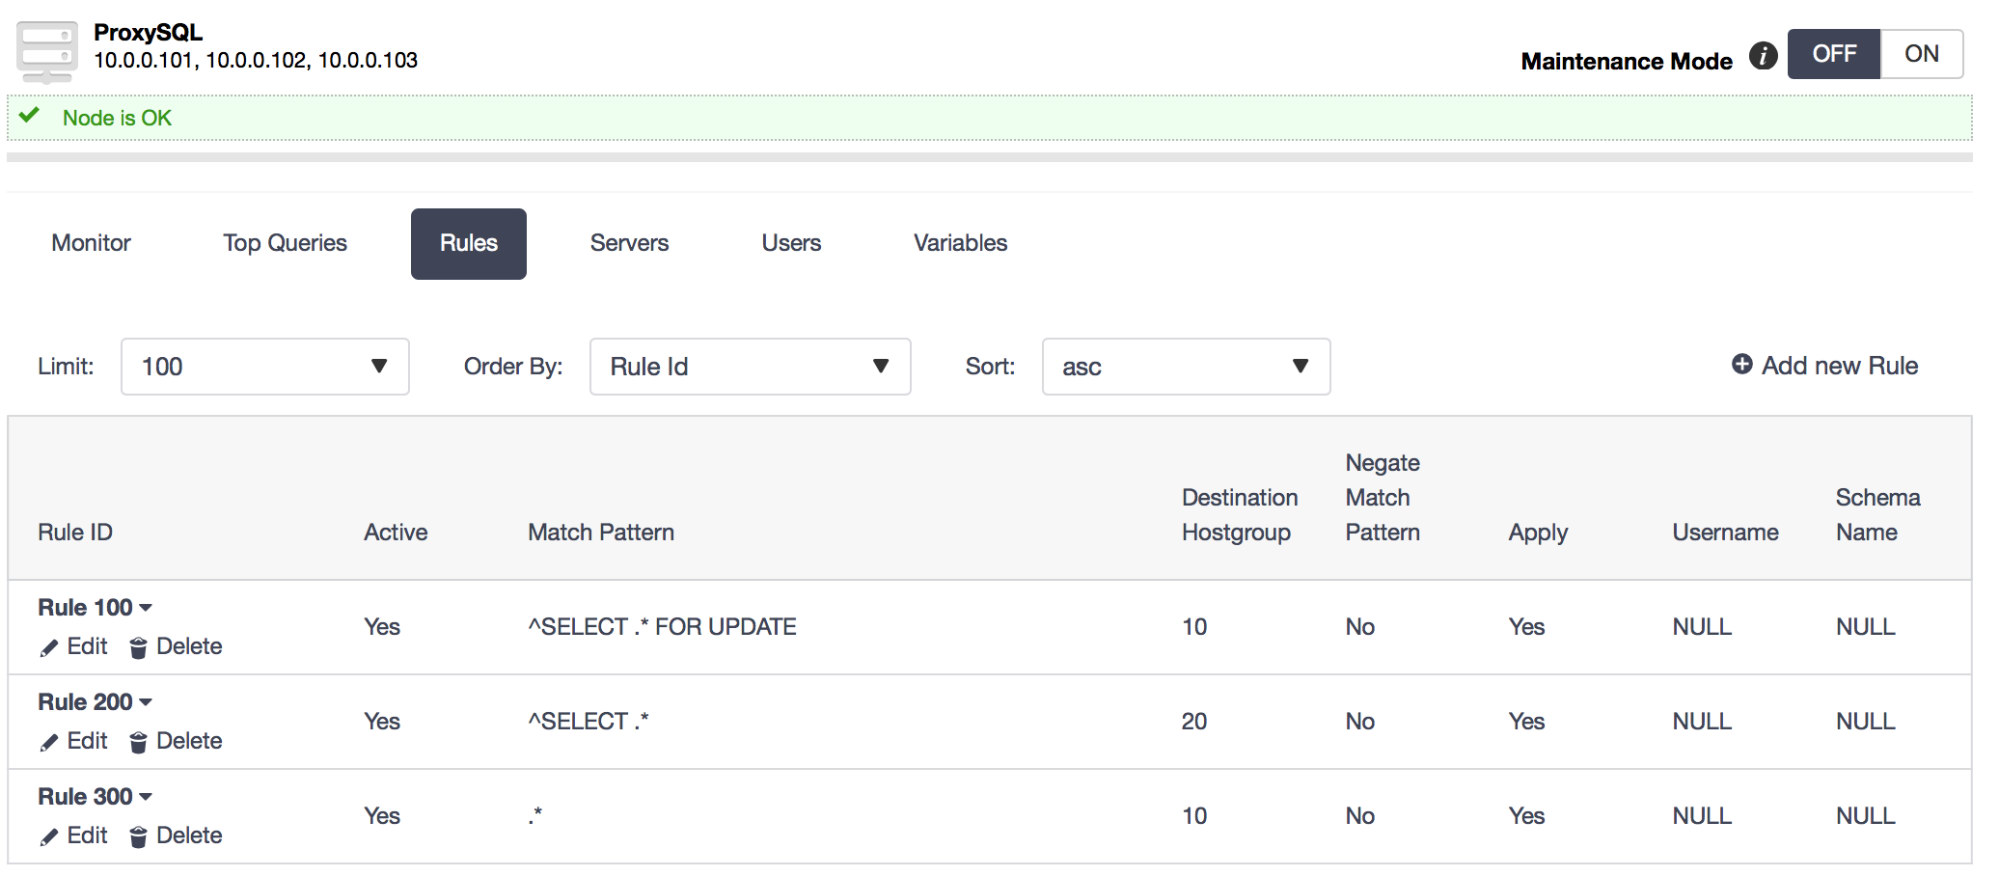
At this point we need to define query rules which will handle read/write split. First, we want to match all SELECT queries:

MySQL [(none)]> INSERT INTO mysql_query_rules (active, match_pattern, destination_hostgroup, apply) VALUES (1, '^SELECT.*', 1, 0);
Query OK, 1 row affected (0.00 sec)

It is important to make sure you get the regex correctly. It is also crucial to note that we set ‘apply’ column to ‘0’. This means that our rule won’t be the final one - a query, even if it matches the regex, will be tested against next rule in the chain. You can see why we’ve done that when you look at our second rule:

MySQL [(none)]> INSERT INTO mysql_query_rules (active, match_pattern, destination_hostgroup, apply) VALUES (1, '^SELECT.*FOR UPDATE', 0, 1);
Query OK, 1 row affected (0.00 sec)

We are looking for SELECT … FOR UPDATE queries, that’s why we couldn’t just finish checking our SELECT queries on the first rule. SELECT … FOR UPDATE should be routed to our write hostgroup, where UPDATE will happen.

Those settings will work fine if autocommit is enabled and no explicit transactions are used. If your application uses transactions, one of the methods to make them work safely in ProxySQL is to use the following set of queries:

SET autocommit=0;
BEGIN;
...

The transaction is created and it will stick to the host where it was opened. You also need to have a query rule for BEGIN, which would route it to the hostgroup for writers - in our case we leverage the fact that, by default, all queries executed as ‘sbtest’ user are routed to writers’ hostgroup (‘0’) so there’s no need to add anything.

Second method would be to enable persistent transactions for our user (transaction_persistent column in mysql_users table should be set to ‘1’).

ProxySQL’s handling of other SET statements and user-defined variables is another thing we’d like to discuss a bit here. ProxySQL works on two levels of routing. First - query rules. You need to make sure all your queries are routed accordingly to your needs. Then, connection mutiplexing - even when routed to the same host, every query you issue may in fact use a different connection to the backend. This makes things hard for session variables. Luckily, ProxySQL treats all queries containing ‘@’ character in a special way - once it detects it, it disables connection multiplexing for the duration of that session - thanks to that, we don’t have to be worried that the next query won’t know a thing about our session variable.

The only thing we need to make sure of is that we end up in the correct hostgroup before disabling connection multiplexing. To cover all cases, the ideal hostgroup in our setup would be the one with writers. This would require slight change in the way we set our query rules (you may require to run ‘DELETE FROM mysql_query_rules’ if you already added the query rules we mentioned earlier).

MySQL [(none)]> INSERT INTO mysql_query_rules (active, match_pattern, destination_hostgroup, apply) VALUES (1, '.*@.*', 0, 1);
Query OK, 1 row affected (0.00 sec)

MySQL [(none)]> INSERT INTO mysql_query_rules (active, match_pattern, destination_hostgroup, apply) VALUES (1, '^SELECT.*', 1, 0);
Query OK, 1 row affected (0.00 sec)

MySQL [(none)]> INSERT INTO mysql_query_rules (active, match_pattern, destination_hostgroup, apply) VALUES (1, '^SELECT.*FOR UPDATE', 0, 1);
Query OK, 1 row affected (0.00 sec)

Those two cases could become a problem in our setup but as long as you are not affected by them (or if you used the proposed workarounds), we can proceed further with configuration. We still need to setup our script to be executed from ProxySQL:

MySQL [(none)]> INSERT INTO scheduler (id, active, interval_ms, filename, arg1, arg2, arg3, arg4, arg5) VALUES (1, 1, 1000, '/var/lib/proxysql/proxysql_galera_checker.sh', 0, 1, 1, 1, '/var/lib/proxysql/proxysql_galera_checker.log');
Query OK, 1 row affected (0.01 sec)

Additionally, because of the way how Galera handles dropped nodes, we want to increase the number of attempts that ProxySQL will make before it decides a host cannot be reached.

MySQL [(none)]> SET mysql-query_retries_on_failure=10;
Query OK, 1 row affected (0.00 sec)

Finally, we need to apply all changes we made to the runtime configuration and save them to disk.

MySQL [(none)]> LOAD MYSQL USERS TO RUNTIME; SAVE MYSQL USERS TO DISK; LOAD MYSQL QUERY RULES TO RUNTIME; SAVE MYSQL QUERY RULES TO DISK; LOAD MYSQL SERVERS TO RUNTIME; SAVE MYSQL SERVERS TO DISK; LOAD SCHEDULER TO RUNTIME; SAVE SCHEDULER TO DISK; LOAD MYSQL VARIABLES TO RUNTIME; SAVE MYSQL VARIABLES TO DISK;
Query OK, 0 rows affected (0.00 sec)

Query OK, 0 rows affected (0.02 sec)

Query OK, 0 rows affected (0.00 sec)

Query OK, 0 rows affected (0.02 sec)

Query OK, 0 rows affected (0.00 sec)

Query OK, 0 rows affected (0.02 sec)

Query OK, 0 rows affected (0.00 sec)

Query OK, 0 rows affected (0.01 sec)

Query OK, 0 rows affected (0.00 sec)

Query OK, 64 rows affected (0.05 sec)

Ok, let’s see how things work together. First, verify that our script works by looking at /var/lib/proxysql/proxysql_galera_checker.log:

Fri Sep  2 21:43:15 UTC 2016 Check server 0:172.30.4.184:3306 , status ONLINE , wsrep_local_state 4
Fri Sep  2 21:43:15 UTC 2016 Check server 0:172.30.4.238:3306 , status OFFLINE_SOFT , wsrep_local_state 4
Fri Sep  2 21:43:15 UTC 2016 Changing server 0:172.30.4.238:3306 to status ONLINE
Fri Sep  2 21:43:15 UTC 2016 Check server 0:172.30.4.67:3306 , status OFFLINE_SOFT , wsrep_local_state 4
Fri Sep  2 21:43:15 UTC 2016 Changing server 0:172.30.4.67:3306 to status ONLINE
Fri Sep  2 21:43:15 UTC 2016 Check server 1:172.30.4.184:3306 , status ONLINE , wsrep_local_state 4
Fri Sep  2 21:43:15 UTC 2016 Check server 1:172.30.4.238:3306 , status ONLINE , wsrep_local_state 4
Fri Sep  2 21:43:16 UTC 2016 Check server 1:172.30.4.67:3306 , status ONLINE , wsrep_local_state 4
Fri Sep  2 21:43:16 UTC 2016 Number of writers online: 3 : hostgroup: 0
Fri Sep  2 21:43:16 UTC 2016 Number of writers reached, disabling extra write server 0:172.30.4.238:3306 to status OFFLINE_SOFT
Fri Sep  2 21:43:16 UTC 2016 Number of writers reached, disabling extra write server 0:172.30.4.67:3306 to status OFFLINE_SOFT
Fri Sep  2 21:43:16 UTC 2016 Enabling config

Looks ok. Next we can check mysql_servers table:

MySQL [(none)]> select hostgroup_id, hostname, status from mysql_servers;
+--------------+--------------+--------------+
| hostgroup_id | hostname     | status       |
+--------------+--------------+--------------+
| 0            | 172.30.4.238 | OFFLINE_SOFT |
| 0            | 172.30.4.184 | ONLINE       |
| 0            | 172.30.4.67  | OFFLINE_SOFT |
| 1            | 172.30.4.238 | ONLINE       |
| 1            | 172.30.4.184 | ONLINE       |
| 1            | 172.30.4.67  | ONLINE       |
+--------------+--------------+--------------+
6 rows in set (0.00 sec)

Again, everything looks as expected - one host is taking writes (172.30.4.184), all three are handling reads. Let’s start sysbench to generate some traffic and then we can check how ProxySQL will handle failure of the writer host.

[root@ip-172-30-4-215 ~]# while true ; do sysbench --test=/root/sysbench/sysbench/tests/db/oltp.lua --num-threads=6 --max-requests=0 --max-time=0 --mysql-host=172.30.4.215 --mysql-user=sbtest --mysql-password=sbtest --mysql-port=6033 --oltp-tables-count=32 --report-interval=1 --oltp-skip-trx=on --oltp-read-only=off --oltp-table-size=100000  run ;done

We are going to simulate a crash by killing the mysqld process on host 172.30.4.184. This is what you’ll see on the application side:

[  45s] threads: 6, tps: 0.00, reads: 4891.00, writes: 1398.00, response time: 23.67ms (95%), errors: 0.00, reconnects:  0.00
[  46s] threads: 6, tps: 0.00, reads: 4973.00, writes: 1425.00, response time: 25.39ms (95%), errors: 0.00, reconnects:  0.00
[  47s] threads: 6, tps: 0.00, reads: 5057.99, writes: 1439.00, response time: 22.23ms (95%), errors: 0.00, reconnects:  0.00
[  48s] threads: 6, tps: 0.00, reads: 2743.96, writes: 774.99, response time: 23.26ms (95%), errors: 0.00, reconnects:  0.00
[  49s] threads: 6, tps: 0.00, reads: 0.00, writes: 1.00, response time: 0.00ms (95%), errors: 0.00, reconnects:  0.00
[  50s] threads: 6, tps: 0.00, reads: 0.00, writes: 0.00, response time: 0.00ms (95%), errors: 0.00, reconnects:  0.00
[  51s] threads: 6, tps: 0.00, reads: 0.00, writes: 0.00, response time: 0.00ms (95%), errors: 0.00, reconnects:  0.00
[  52s] threads: 6, tps: 0.00, reads: 0.00, writes: 0.00, response time: 0.00ms (95%), errors: 0.00, reconnects:  0.00
[  53s] threads: 6, tps: 0.00, reads: 0.00, writes: 0.00, response time: 0.00ms (95%), errors: 0.00, reconnects:  0.00
[  54s] threads: 6, tps: 0.00, reads: 1235.02, writes: 354.01, response time: 6134.76ms (95%), errors: 0.00, reconnects:  0.00
[  55s] threads: 6, tps: 0.00, reads: 5067.98, writes: 1459.00, response time: 24.95ms (95%), errors: 0.00, reconnects:  0.00
[  56s] threads: 6, tps: 0.00, reads: 5131.00, writes: 1458.00, response time: 22.07ms (95%), errors: 0.00, reconnects:  0.00
[  57s] threads: 6, tps: 0.00, reads: 4936.02, writes: 1414.00, response time: 22.37ms (95%), errors: 0.00, reconnects:  0.00
[  58s] threads: 6, tps: 0.00, reads: 4929.99, writes: 1404.00, response time: 24.79ms (95%), errors: 0.00, reconnects:  0.00

There’s a ~5 seconds break but otherwise, no error was reported. Of course, your mileage may vary - all depends on Galera settings and your application. Such feat might not be possible if you use transactions in your application.

To summarize, we showed you how to configure read-write split in Galera Cluster using ProxySQL. There are a couple of limitations due to the way the proxy works, but as long as none of them are a blocker, you can use it and benefit from other ProxySQL features like caching or query rewriting. Please also keep in mind that the script we used for setting up read-write split is just an example which comes from ProxySQL. If you’d like it to cover more complex cases, you can easily write one tailored to your needs.

Sign up for our new webinar: 9 DevOps Tips for Going in Production with Galera Cluster for MySQL / MariaDB

$
0
0

Galera Cluster for MySQL / MariaDB is easy to deploy, but how does it behave under real workload, scale, and during long term operation? Proof of concepts and lab tests usually work great for Galera, until it’s time to go into production. Throw in a live migration from an existing database setup and devops life just got a bit more interesting...

If this scenario sounds familiar, then this webinar is for you!

Operations is not so much about specific technologies, but about the techniques and tools you use to deploy and manage them. Monitoring, managing schema changes and pushing them in production, performance optimizations, configurations, version upgrades, backups; these are all aspects to consider – preferably before going live.

In this webinar, we’d like to guide you through 9 key tips to consider before taking Galera Cluster for MySQL / MariaDB into production.

Date & Time

Europe/MEA/APAC

Tuesday, October 11th at 09:00 BST (UK) / 10:00 CEST (Germany, France, Sweden)
Register Now

North America/LatAm

Tuesday, October 11th at 9:00 Pacific Time (US) / 12:00 Eastern Time (US)
Register Now

Agenda

  • 101 Sanity Check
  • Operating System
  • Backup Strategies
  • Replication & Sync
  • Query Performance
  • Schema Changes
  • Security / Encryption
  • Reporting
  • Managing from disaster

Speaker

Johan Andersson, CTO, Severalnines

Johan's technical background and interest are in high performance computing as demonstrated by the work he did on main-memory clustered databases at Ericsson as well as his research on parallel Java Virtual Machines at Trinity College Dublin in Ireland. Prior to co-founding Severalnines, Johan was Principal Consultant and lead of the MySQL Clustering & High Availability consulting group at MySQL / Sun Microsystems / Oracle, where he designed and implemented large-scale MySQL systems for key customers. Johan is a regular speaker at MySQL User Conferences as well as other high profile community gatherings with popular talks and tutorials around architecting and tuning MySQL Clusters.

Join us for this live webinar, where we’ll be discussing and demonstrating how to best proceed when planning to go into production with Galera Cluster.

We look forward to “seeing” you there and to insightful discussions!

If you have any questions or would like a personalised live demo, please do contact us.

9 DevOps Tips for going in production with MySQL / MariaDB Galera Cluster: webinar replay

$
0
0

Many thanks to everyone who participated in this week’s webinar on ‘9 DevOps Tips for going in production with MySQL / MariaDB Galera Cluster’.

The replay and slides are now available to watch and read online:

Watch the replayRead the slides

Galera Cluster for MySQL / MariaDB is easy to deploy, but how does it behave under real workload, scale, and during long term operation?

This is where monitoring, managing schema changes and pushing them in production, performance optimizations, configurations, version upgrades and performing backups come in.

During this webinar, our CTO Johan Andersson walked us through his tips & tricks on important aspects to consider before going live with Galera Cluster.

Agenda

  • 101 Sanity Check
  • Operating System
  • Backup Strategies
  • Replication & Sync
  • Query Performance
  • Schema Changes
  • Security / Encryption
  • Reporting
  • Managing from disaster

Speaker

Johan Andersson, CTO, Severalnines. Johan's technical background and interest are in high performance computing as demonstrated by the work he did on main-memory clustered databases at Ericsson as well as his research on parallel Java Virtual Machines at Trinity College Dublin in Ireland. Prior to co-founding Severalnines, Johan was Principal Consultant and lead of the MySQL Clustering & High Availability consulting group at MySQL / Sun Microsystems / Oracle, where he designed and implemented large-scale MySQL systems for key customers. Johan is a regular speaker at MySQL User Conferences as well as other high profile community gatherings with popular talks and tutorials around architecting and tuning MySQL Clusters.

If you have any questions or would like a personalised live demo, please do contact us.

Schema changes in Galera cluster for MySQL and MariaDB - how to avoid RSU locks

$
0
0

Working as MySQL DBA, you will often have to deal with schema changes. Changes to production databases are not popular among DBAs, but they are necessary when applications add new requirements on the databases. If you manage a Galera Cluster, this is even more challenging than usual - the default method of doing schema changes (Total Order Isolation) locks the whole cluster for the duration of the alter. There are two more ways to go, though - online schema change and Rolling Schema Upgrade.

A popular method of performing schema changes, using pt-online-schema-change, has its own limitations. It can be tricky if your workload consists of long running transactions, or the workload is highly concurrent and the tool may not be able to acquire metadata locks needed to create triggers. Triggers themselves can become a hard stop if you already have triggers in the table you need to alter (unless you use Galera Cluster based on MySQL 5.7). Foreign keys may also become a serious issue to deal with. You can find more data on those limitations in this Become a MySQL DBA blog post . New alternatives to pt-online-schema-change arrived recently - gh-ost created by GitHub, but it’s still a new tool and unless you evaluated it already, you may have to stick to pt-online-schema-change for time being.

This leaves Rolling Schema Upgrade as the only feasible method to execute schema changes where pt-online-schema-change failed or is not feasible to use. Theoretically speaking, it is a non-blocking operation - you run:

SET SESSION wsrep_OSU_method=RSU;

And the rest should happen automatically once you start the DDL - the node should be desynced and alter should not impact the rest of the cluster.

Let’s check how it behaves in real life, in two scenarios. First, we have a single connection to the Galera cluster. We don’t scale out reads, we just use Galera as a way to improve availability of our application. We will simulate it by running a sysbench workload on one of the Galera cluster nodes. We are also going to execute RSU on this node. A screenshot with result of this operation can be found below.

On the bottom right window you can see the output of sysbench - our application. On the top window there’s a SHOW PROCESSLIST output at the time the alter was running. As you can see, our application stalled for couple of seconds - for the duration of the alter command (visible in bottom left window). Graphs in the ClusterControl show the stalled queries in detail:

You may say, and rightly so, that this is expected - if you write to a node where schema change is performed, those writes have to wait.

What about if we use some sort of round-robin routing of connections? This can be done in the application (just define a pool of hosts to connect to), it can be done at the connector level. It also can be done using a proxy. Results are in the screenshot below.

As you can see, here we also have locked threads which were routed to the host where RSU was in progress. The rest of threads worked ok but some of the connections stalled for a duration of the alter. Please take a closer look at the length of an alter (11.78s) and the maximum response time (12.63s). Some of the users experienced significant performance degradation.

One question you may want to ask is - starting ALTER in RSU desyncs the Galera node. Proxies like ProxySQL, MaxScale or HAProxy (when used in connection with clustercheck script) should detect this behavior and redirect the traffic off the desynced host. Why is it locking commits? Unfortunately, there’s a high probability that some transactions will be in progress and those will get locked after the ALTER starts.

How to avoid the problem? You need to use a proxy. It’s not enough on it’s own, as we have proven just before. But as long as your proxy removes desynced hosts out of rotation, you can easily add this step to the RSU process and make sure a node is desynced and not accepting any form of traffic before you actually start your DDL.

mysql> SET GLOBAL wsrep_desync=1; SELECT SLEEP(20); ALTER TABLE sbtest.sbtest3 DROP INDEX idx_pad; ALTER TABLE sbtest.sbtest3 ADD KEY idx_pad (pad); SET GLOBAL wsrep_desync=0;

This should work with all proxies deployed through ClusterControl - HAProxy and MaxScale. ProxySQL will also be able to handle RSU executed in that way correctly.

Another method, which can be used for HAProxy, would be to disable a backend node by setting it to maintenance state. You can do this from ClusterControl:

Make sure you ticked the correct node, confirm that’s what you want to do, and in a couple of minutes you should be good to start RSU on that node. The host will be highlighted in brown:

It’s still better to be on the safe side and verify using SHOW PROCESLIST (also available in the ClusterControl -> Query Monitor -> Running Queries) that indeed no traffic is hitting this node. Once you are done running DML’s, you can enable the backend node again in the HAProxy tab in ClusterControl and you’ll be able to route traffic also to this node.

As you can see, even with load balancers used, running RSU may seriously impact performance and availability of your database. Most likely it’ll affect just a small subset of users (a few percent of connections), but it’s still not something we’d like to see. Using properly configured proxies (like those deployed by ClusterControl) and ensuring you first desync the node and then execute RSU, will be enough to avoid this type of problem.

High Availability on a Shoestring Budget - Deploying a Minimal Two Node MySQL Galera Cluster

$
0
0

We regularly get questions about how to set up a Galera cluster with just 2 nodes. The documentation clearly states you should have at least 3 Galera nodes to avoid network partitioning. But there are some valid reasons for considering a 2 node deployment, e.g., if you want achieve database high availability but have limited budget to spend on a third database node. Or perhaps you are running Galera in a development/sandbox environment and prefer a minimal setup.

Galera implements a quorum-based algorithm to select a primary component through which it enforces consistency. The primary component needs to have a majority of votes, so in a 2 node system, there would be no majority resulting in split brain. Fortunately, it is possible to add a garbd (Galera Arbitrator Daemon), which is a lightweight stateless daemon that can act as the odd node. Arbitrator failure does not affect the cluster operations and a new instance can be reattached to the cluster at any time. There can be several arbitrators in the cluster.

ClusterControl has support for deploying garbd on non-database hosts.

Normally a Galera cluster needs at least three hosts to be fully functional, however at deploy time two nodes would suffice to create a primary component. Here are the steps:

  1. Deploy a Galera cluster of two nodes,
  2. After the cluster has been deployed by ClusterControl, add garbd on the ClusterControl node.

You should end up with the below setup:

Deploy the Galera Cluster

Go to the ClusterControl deploy wizard to deploy the cluster.

Even though ClusterControl warns you a Galera cluster needs an odd number of nodes, only add two nodes to the cluster.

Deploying a Galera cluster will trigger a ClusterControl job which can be monitored at the Jobs page.

Install Garbd

Once deployment is complete, install garbd on the ClusterControl host. It will be under the Manage -> Load Balancer:

Installing garbd will trigger a ClusterControl job which can be monitored at the Jobs page. Once completed, you can verify garbd is running with a green tick icon at the top bar:

That’s it. Our minimal two-node Galera cluster is now ready!


Database TCO - Calculating the Total Cost of Ownership for MySQL Management

$
0
0

Cost analysis and cost effectiveness for databases are hardly ever performed, while it actually makes a lot of sense to perform such calculations. The easiest method of gaining insights into these is by performing a total cost of ownership (TCO) calculation. You might have theories on what your greatest cost factor is, but do you really know for sure?

Why would you perform such a TCO analysis? As with most research: prove your theory of the highest cost factor wrong. The TCO is a great tool to give a precise cost analysis and would give you some surprising insights!

Cost factors for databases

The cost factors for databases can be divided into two separate groups: capital expenses (CAPEX) and operational expenses (OPEX). Both cost factors are part of the infrastructure lifecycle.

TCO lifetime cycle
TCO lifetime cycle

Capital expenses are the costs you pay upfront during the acquire phase: hardware purchases, (non-recurring) licensing cost and any other one time cost factors like replacement parts. These expenses are a constant factor in the TCO and are spread out over the lifetime of your database servers. Most of these costs will happen in the acquire phase, however the replacement parts will obviously take place in the maintenance phase.

Operational expenses are the costs for running the database servers. As these costs are recurring, you pay them on a regular (e.g., yearly) interval and mostly during the maintenance phase. These cost include datacenter/rack rental, power consumption, network usage and operational costs like (remote) hands and personnel. The last one includes sysops, DBAs and all costs made to facilitate them like desks, office space and training. Since these expenses are recurring, they will continue to grow during the lifetime of your database servers. The longer you operate these servers, the higher the operational expenses (OPEX) will be.

This means that the longer you use your database servers, the share between CAPEX and OPEX will shift towards a higher share of OPEX. The one time purchase of hardware may be considered a high cost upfront, but given that you will probably use the hardware for more than three years, it justifies the upfront cost.

For cloud hosting, the calculation will be similar. However, since you don’t have hardware to purchase upfront, the CAPEX will be a lot lower. As cloud hosting has a recurring monthly cost, the OPEX will be higher. In some cases, your cloud provider may calculate some (setup) cost upfront and this should be treated as CAPEX.

Example calculation for hardware

In this example we will make a calculation of a small company (under 100 employees) that hosts on hardware in their own racks in a data center. This company has two dedicated sysops and one experienced DBA (1-4 years), where the DBA is managing around 20 databases and the sysops around 200 hosts. The average DBA salary for this is $65,000, so the annual cost per database would be $3,250. The sysops average around $50,000 for the same experience, and cost $250 per host per year. The sysops are also the people who manage the datacenter. We will not factor in the facilitation costs as this would get over complicated.

For our example cluster, we will make use of a three node MySQL replication setup: one master and two slave nodes. Hardware is based upon the Dell R730 with 64GB of memory and six 400GB SSDs, as this is a very popular model for this purpose. The price of a R730 with this configuration is currently $7655.

Rental cost of a full rack is nowadays around $350[1], so the colocation cost per U is roughly $8 per month. Since the R730 is a 2U unit, the total cost for our databases would be $48 per month.

Modern colocation costs factor out the power consumption, as the power is a variable factor. Prices for power with colocation can vary a lot, but it currently averages around $0.20 per kWh. The average database server consumes around 200 watts, which results in a 144kWh consumption per month per server. For our three database servers this would result in $86 per month.

This results in the following TCO:

Cost itemCAPEXOPEX (per year)TCO (3 years)
Purchase: hardware$22,965  
Professional support (DBA / Sysop) $10,500 
Colocation cost $576 
Power cost (200W) $1,032 
Replacement parts$1,500  
Total$24,465$12,108$60,789
TCO for database servers (hardware)

There are a couple of conclusions we can draw from this calculation. Cost for colocation, power and replacement parts are neglectable, compared to the other cost factors. Also during the lifetime of a database server, the support costs make up more than half of the total costs. And are far higher than the original purchase price of the servers.

Example calculation cloud hosting

In this example we will make a calculation for a company that hosts in the cloud. To compare fairly, we will again make use of a three node MySQL replication setup on EC2. Amazon provides a nice TCO calculator for these purposes, so we made use of this as input for the calculations below.

To make the database servers comparable, we chose the i3.2xlarge, which (currently) has 8 vCPUs, 61GB of RAM and 1900GB of SSD storage. This currently costs $0.624 per hour, which is slightly below $15 per day and $5466 per year.

In the cloud the upfront investments (CAPEX) are not necessary. This is true in many cases, except if you make use of reserved instances like in AWS. With reserved instances, you make a claim on Amazon to reserve (performant) capacity for you, that you can use at will. In our calculation, we will not make use of reserved instances. Next to the lower CAPEX, our OPEX should be lower since our sysops don’t have to go to the data center or install these servers.

This results in the following TCO:

Cost itemCAPEXOPEX (per year)TCO (3 years)
Professional support (DBA only) $9,750 
AWS 3x i3.2xlarge $16,399 
Total$0$27,149$78,447
TCO for databases (cloud hosted)

Even though we have eliminated our upfront costs and capital investments (CAPEX), the OPEX is really high due to the premium we have to pay for high performance instances in AWS. Over a three year period, your TCO will be higher than having your own hardware

OPEX has a large influence

As you can see from these calculations, the influence of the operational costs (OPEX) during the lifetime of the servers is far greater than the initial large investment of the CAPEX. This is mostly due to running (and owning) these servers for multiple years.

In the case of owning your own hardware, we have shown that the operational costs even outweigh the initial costs for purchasing these servers. For the AWS example, the total costs of “owning” these servers is even higher than for the hardware example. This is the premium paid for flexibility, as with a cloud environment you are free to upgrade to a newer instance every year.

For both examples it is clear that the professional support for running these databases is relatively high. It looks like the sysops are clearly far more efficient when they are managing more than 200 hosts, but they don’t have to bother with the additional tasks that the DBA is supposed to do. If you could only make the DBA more efficient.

Making the DBA more efficient

Luckily, there are a few methods to make your DBA more efficient and handle more database servers. Either have the DBA relieved from various tasks (others will perform these tasks) or have the DBA perform less tasks through automation. The low hanging fruit would be to automate the most time consuming tasks or the most error prone ones.

The most time consuming DBAs tasks are provisioning, deployments, performance tuning, troubleshooting, backups and scaling clusters. Provisioning and installation of software is a repetitive task that can easily be automated, just like copying data and setting up replication when scaling out with read slaves. Similarly backups can be automated and with the help of a backup manager the restore process as well.

For the most error prone actions we could identify setting up replication, failover and schema management. In these tasks a single typo could lead to disastrous proportions where the only way to resolve is to restore from an earlier made backup.

Automation of repetitive tasks and chores is a tedious, but useful task. It takes time to automate each and every one of these tasks, and your DBA will most certainly be more busy with automation than with the other (daily) tasks. This automation may actually interfere with the normal day to day jobs, especially if the DBA isn’t a developer type and is struggling with the automation jobs. Wouldn’t it be more productive to offer the DBA a readily available toolset to work with instead? Or perhaps provide the sysops with a way that allows them to perform the tasks instead?

Do you even need a DBA?

Not all companies have full-time DBAs, at least not if you have a small number of databases. A DBA is a very specialized role, where a single person is dedicated to perform all database related tasks. This requires specialized knowledge of specific hardware, specific software, operating systems and in depth knowledge of SQL. Placing such a specialized person on a small number of databases, means the person will not have a lot to do and only cost money.

A sysop (or system administrator) is more of a generalist, and has to do a bit of everything. They generally manage hardware, operating systems, network, security, applications, databases and storage. They may have specific knowledge on one or more of these systems, but they can’t be specialized in all of them. The knowledge gap becomes more apparent when it comes to distributed setups (replication or clusters) and need for high availability.

As shown in the example calculations, the difference in salary expresses this picture as well. A DBA will cost more than a sysop and is more difficult to find as there’s not many of them around. That means that you probably have to do without a DBA. The challenge for the sysop is to have enough time to keep the databases perform well, troubleshoot any issues, monitor for any anomalies, maintain high availability, ensure data integrity and that data is backed up (and backups are verified to be ok).

ClusterControl saving costs

In ClusterControl the full database lifetime cycle has already been automated for the most popular open source databases. This means the DBA doesn’t necessarily have to automate his/her job anymore, as most of the tasks already have been automated in ClusterControl. Reliability will increase as the automation done in ClusterControl has been tested through and through, while what the DBA produced will only be tested directly in production.

Implementing a complete lifetime cycle management tool like ClusterControl means the DBA can now spend more time on useful things and manage more database servers. Or it could also mean people with less knowledge on databases can perform the same tasks.

Updated - How to Bootstrap MySQL or MariaDB Galera Cluster

$
0
0

Unlike standard MySQL server and MySQL Cluster, the way to start a MySQL/MariaDB Galera Cluster is a bit different. Galera requires you to start a node in a cluster as a reference point, before the remaining nodes are able to join and form the cluster. This process is known as cluster bootstrap. Bootstrapping is an initial step to introduce a database node as primary component, before others see it as a reference point to sync up data.

How does it work?

When Galera starts with the bootstrap command on a node, that particular node will reach Primary state (check the value of wsrep_cluster_status). The remaining nodes will just require a normal start command and they will automatically look for existing Primary Component (PC) in the cluster and join to form a cluster. Data synchronization then happens through either incremental state transfer (IST) or snapshot state transfer (SST) between the joiner and the donor.

So basically, you should only bootstrap the cluster if you want to start a new cluster or when no other nodes in the cluster is in PRIMARY state. Care should be taken when choosing the action to take, or else you might end up with split clusters or loss of data.

The following example scenarios illustrate when to bootstrap the a three-node cluster based on node state (wsrep_local_state_comment) and cluster state (wsrep_cluster_status):

Galera StateBootstrap Flow
  1. Restart the INITIALIZED node.
  1. Restart the INITIALIZED node.
  2. Once done, start the new node.
  1. Bootstrap the most advanced node using “pc.bootstrap=1”.
  2. Restart the remaining nodes, one node at a time.
  1. Start the new node.
  1. Start the new node, one node at a time.
  1. Bootstrap any node.
  2. Start the remaining nodes, one node at a time.

How to start Galera cluster?

The 3 Galera vendors use different bootstrapping commands (based on the software’s latest version). On the first node, run:

  • MySQL Galera Cluster (Codership):

    $ service mysql bootstrap # sysvinit
    $ galera_new_cluster # systemd
    $ mysqld_safe --wsrep-new-cluster # command line
  • Percona XtraDB Cluster (Percona):

    $ service mysql bootstrap-pxc # sysvinit
    $ systemctl start mysql@bootstrap.service # systemd
  • MariaDB Galera Cluster (MariaDB):

    $ service mysql bootstrap # sysvinit
    $ service mysql start --wsrep-new-cluster # sysvinit
    $ galera_new_cluster # systemd
    $ mysqld_safe --wsrep-new-cluster # command line

The above command is just a wrapper and what it actually does is to start the MySQL instance on that node with gcomm:// as the wsrep_cluster_address variable. You can also manually define the variables inside my.cnf and run the standard start/restart command. However, do not forget to change wsrep_cluster_address back again to contain the addresses to all nodes after the start.

When the first node is live, run the following command on the subsequent nodes:

$ service mysql start
$ systemctl start mysql

The new node connects to the cluster members as defined by the wsrep_cluster_address parameter. It will now automatically retrieve the cluster map and connect to the rest of the nodes and form a cluster.

Warning: Never bootstrap when you want to reconnect a node to an existing cluster, and NEVER run bootstrap on more than one node.

Safe-to-Bootstrap Flag

Galera starting with version 3.19 comes with a new flag called “safe_to_bootstrap” inside grastate.dat. This flag facilitates the decision and prevent unsafe choices by keeping track of the order in which nodes are being shut down. The node that was shut down last will be marked as “Safe-to-Bootstrap”. All the other nodes will be marked as unsafe to bootstrap from.

Looking at grastate.dat (default is under MySQL datadir) content and you should notice the flag on the last line:

# GALERA saved state
version: 2.1
uuid:    8bcf4a34-aedb-14e5-bcc3-d3e36277729f
seqno:   2575
safe_to_bootstrap: 0

When bootstrapping the new cluster, Galera will refuse to start the first node that was marked as unsafe to bootstrap from. You will see the following message in the logs:

“It may not be safe to bootstrap the cluster from this node. It was not the last one to leave the cluster and may not contain all the updates.

To force cluster bootstrap with this node, edit the grastate.dat file manually and set safe_to_bootstrap to 1 .”

In case of unclean shutdown or hard crash, all nodes will have “safe_to_bootstrap: 0”, so we have to consult the InnoDB storage engine to determine which node has committed the last transaction in the cluster. This can be achieved by starting mysqld with the “--wsrep-recover” variable on each of the nodes, which produces an output like this:

$ mysqld --wsrep-recover
...
2016-11-18 01:42:15 36311 [Note] InnoDB: Database was not shutdown normally!
2016-11-18 01:42:15 36311 [Note] InnoDB: Starting crash recovery.
...
2016-11-18 01:42:16 36311 [Note] WSREP: Recovered position: 8bcf4a34-aedb-14e5-bcc3-d3e36277729f:114428
...

The number after the UUID string on the "Recovered position" line is the one to look for. Pick the node that has the highest number and edit its grastate.dat to set “safe_to_bootstrap: 1”, as shown in the example below:

# GALERA saved state
version: 2.1
uuid:    8bcf4a34-aedb-14e5-bcc3-d3e36277729f
seqno:   -1
safe_to_bootstrap: 1

You can then perform the standard bootstrap command on the chosen node.

What if the nodes have diverged?

In certain circumstances, nodes can have diverged from each other. The state of all nodes might turn into Non-Primary due to network split between nodes, cluster crash, or if Galera hit an exception when determining the Primary Component. You will then need to select a node and promote it to be a Primary Component.

To determine which node needs to be bootstrapped, compare the wsrep_last_committed value on all DB nodes:

node1> SHOW STATUS LIKE 'wsrep_%';
+----------------------+-------------+
| Variable_name        | Value       |
+----------------------+-------------+
| wsrep_last_committed | 10032       |
...
| wsrep_cluster_status | non-Primary |
+----------------------+-------------+
node2> SHOW STATUS LIKE 'wsrep_%';
+----------------------+-------------+
| Variable_name        | Value       |
+----------------------+-------------+
| wsrep_last_committed | 10348       |
...
| wsrep_cluster_status | non-Primary |
+----------------------+-------------+
node3> SHOW STATUS LIKE 'wsrep_%';
+----------------------+-------------+
| Variable_name        | Value       |
+----------------------+-------------+
| wsrep_last_committed |   997       |
...
| wsrep_cluster_status | non-Primary |
+----------------------+-------------+

From above outputs, node2 has the most up-to-date data. In this case, all Galera nodes are already started, so you don’t necessarily need to bootstrap the cluster again. We just need to promote node2 to be a Primary Component:

node2> SET GLOBAL wsrep_provider_options="pc.bootstrap=1";

The remaining nodes will then reconnect to the Primary Component (node2) and resync their data based on this node.

ClusterControl
Single Console for Your Entire Database Infrastructure
Find out what else is new in ClusterControl

If you are using ClusterControl (try it for free), you can determine the wsrep_last_committed and wsrep_cluster_status directly from the ClusterControl > Overview page:

Or from ClusterControl > Performance > DB Status page:

Updated - Full Restore of a MySQL or MariaDB Galera Cluster from Backup

$
0
0

Performing regular backups of your database cluster is imperative for high availability and disaster recovery. If for any reason you lost your entire cluster and had to do a full restore from backup, you would need a reliable and up-to-date backup to start from.

Best Practices for Backups

Some recommendations to consider for a good scheduled backup regime:

  • You should be able to completely recover from a catastrophic failure from at least two previous full backups. Just in case the most recent full backup is damaged, lost, or corrupt,
  • Your backup should contain at least one full backup within a chosen cycle, normally weekly,
  • Store backups away from the current data location, preferably off site,
  • Use a mixture of mysqldump and Xtrabackup for extra safety, and not rely on one method,
  • Test restore your backups on a regular basis, e.g. every two months.

A weekly full backup combined with daily incremental backup is normally enough. Keeping a number of backups for a period of time is always a good plan, maybe keep each weekly backup for one month. This allows you to recover an older database in case of emergencies or if for some reason you have local backup file corruption.

mysqldump or Xtrabackup

mysqldump is very likely the most popular way of backing up MySQL. It does a logical backup of the data, reading from each table using SQL statements then exporting the data into text files. Restoration of a mysqldump is as easy as creating the dump file. The main drawbacks are that it is very slow for large databases, it is not ‘hot’ and it wipes out the InnoDB buffer pool.

Xtrabackup performs hot backups, does not lock the database during the backup and is generally faster. Hot backups are important for high availability, as they run without blocking the application. This is also an important factor when used with Galera, as Galera relies on synchronous replication. However, restoring an xtrabackup can be a little tricky using manual ways.

ClusterControl supports the scheduling of both mysqldump and Xtrabackup (full and incremental), as well as the backup restoration right from the UI.

Full Restore from Backup

In this post, we will show you how to restore Xtrabackup (full + incremental) onto an empty cluster running on MariaDB Galera Cluster. These steps should also work on Percona XtraDB Cluster or Galera Cluster for MySQL from Codership.

In our original cluster, we had a full xtrabackup scheduled daily, with incremental backups created every hour. The backups are stored on ClusterControl as shown in the following screenshot:

Now, let’s assume we have lost our original cluster and have to do a full restore onto a new cluster. The steps include:

  1. Set up a new ClusterControl server.
  2. Set up a new MariaDB Cluster.
  3. Export the backup records and files to the new ClusterControl server.
  4. Start the restoration process.
  5. Start the remaining nodes.

The following diagram illustrates our architecture for this exercise:

Step 1 - Set up New MariaDB Cluster

Install ClusterControl and deploy a new MariaDB Cluster. Go to ClusterControl -> Deploy -> Deploy Database Cluster -> MySQL Galera and specify the required information in the deployment dialog:

Click on the Deploy button and start the deployment. Since we only have a cluster on the old server so the cluster ID should be identical (cluster ID: 1) in this new instance.

ClusterControl
Single Console for Your Entire Database Infrastructure
Find out what else is new in ClusterControl

Step 2 - Export and import the backup files

Once the cluster is deployed, we will have to import the backups from the old ClusterControl server into the new one. First, export the content of cmon.backup_records to dump files. Since the old cluster ID and the new one is identical, we just need to modify the dump file with the new IP address and import it to the new ClusterControl node. If the cluster ID is different, then you have to change “cid” value accordingly inside the dump files before importing into CMON DB on the new node. Also, it is easier to keep the backup storage location as in the old server so the new ClusterControl can locate the backup files in the new server.

On the old ClusterControl server, export the backup_records table into dump files:

$ mysqldump -uroot -p --single-transaction --no-create-info cmon backup_records > backup_records.sql

Then, perform remote copy of the backup files from the old server into the new ClusterControl server:

$ scp -r /root/backups 192.168.55.150:/root/
$ scp ~/backup_records.sql 192.168.55.150:~

Next is to modify the dump files to reflect the new ClusterControl server IP address. Don’t forget to escape the dot in the IP address:

$ sed -i "s/192\.168\.55\.170/192\.168\.55\.150/g" backup_records.sql

On the new ClusterControl server, import the dump files:

$ mysql -uroot -p cmon < backup_records.sql

Verify that the backup list is correct in the new ClusterControl server:

As you can see, all occurences of the previous IP address (192.168.55.170) have been replaced by the new IP address (192.168.55.150). Now we are ready to perform the restoration in the new server.

Step 3 - Perform the Restoration

Performing restoration through the ClusterControl UI is a simple point-and-click step. Choose which backup to restore and click on the “Restore” button. We are going to restore the latest incremental backup available (Backup: 9). Click on the “Restore” button just below the backup name and you will be presented with the following pre-restoration dialog:

Looks like the backup size is pretty small (165.6 kB). It doesn’t really matter because ClusterControl will prepare all incremental backups grouped under Backup Set 6, which holds the full Xtrabackup. You also have several post-restoration options:

  • Restore backup on - Choose the node to restore the backup on.
  • Tmp Dir - Directory will be used on the local ClusterControl server as temporary storage during backup preparation. It must be as big as the estimated MySQL data directory.
  • Bootstrap cluster from the restored node - Since this is a new cluster, we are going to toggle this ON so ClusterControl will bootstrap the cluster automatically after the restoration succeeds.
  • Make a copy of the datadir before restoring the backup - If the restored data is corrupted or not as what you are expected it to be, you will have a backup of the previous MySQL data directory. Since this is a new cluster, we are going to ignore this one.

Percona Xtrabackup restoration will cause the cluster to be stopped. ClusterControl will:

  1. Stop all nodes in the cluster.
  2. Restore the backup on the selected node.
  3. Bootstrap the selected node.

To see the restoration progress, go to Activity -> Jobs -> Restore Backup and click on the “Full Job Details” button. You should see something like this:

One important thing that you need to do is to monitor the output of the MySQL error log on the target node (192.168.55.151) during the restoration process. After the restoration completes and during the bootstrapping process, you should see the following lines starting to appear:

Version: '10.1.22-MariaDB' socket: '/var/lib/mysql/mysql.sock' port: 3306 MariaDB Server
2017-04-07 18:03:51 140608191986432 [Warning] Access denied for user 'cmon'@'192.168.55.150' (using password: YES)
2017-04-07 18:03:52 140608191986432 [Warning] Access denied for user 'cmon'@'192.168.55.150' (using password: YES)
2017-04-07 18:03:53 140608191986432 [Warning] Access denied for user 'cmon'@'192.168.55.150' (using password: YES)
2017-04-07 18:03:54 140608191986432 [Warning] Access denied for user 'cmon'@'192.168.55.150' (using password: YES)
2017-04-07 18:03:55 140608191986432 [Warning] Access denied for user 'cmon'@'192.168.55.150' (using password: YES)

Don’t panic. This is an expected behaviour because this backup set doesn’t store the cmon login credentials of the new ClusterControl cmon password. It has restored/replaced the old cmon user instead. What you need to do is to re-grant cmon user back to the server by running the following statement on this DB node:

GRANT ALL PRIVILEGES ON *.* to cmon@'192.168.55.150' IDENTIFIED BY 'mynewCMONpassw0rd' WITH GRANT OPTION;
FLUSH PRIVILEGES;

ClusterControl then would be able to connect to the bootstrapped node and determine the node and backup state. If everything is OK, you should see something like this:

At this point, the target node is bootstrapped and running. We can start the remaining nodes under Nodes -> choose node -> Start Node and check the “Perform an Initial Start” checkbox:

The restoration is now complete and you can expect Performance -> DB Growth to report the updated size of our newly restored data set :

Happy restoring!

Online Schema Upgrade in MySQL Galera Cluster using RSU Method

$
0
0

This post is a continuation of our previous post on Online Schema Upgrade in Galera using TOI method. We will now show you how to perform a schema upgrade using the Rolling Schema Upgrade (RSU) method.

RSU and TOI

As we discussed, when using TOI, a change happens at the same time on all of the nodes. This can become a serious limitation as such way of executing schema changes implies that no other queries can be executed. For long ALTER statements, the cluster may be not available for hours even. Obviously, this is not something you can accept in production. RSU method addresses this weakness - changes happen on one node at a time while other nodes are not affected and can serve traffic. Once ALTER completes on one node, it will rejoin the cluster and you can proceed with executing a schema change on the next node.

Such behavior comes with its own set of limitations. The main one is that scheduled schema change has to be compatible. What does it mean? Let’s think about it for a while. First of all we need to keep in mind that the cluster is up and running all the time - the altered node has to be able to accept all of the traffic which hit the remaining nodes. In short, a DML executed on the old schema has to work also on the new schema (and vice-versa if you use some sort of round-robin-like connection distribution in your Galera Cluster). We will focus on the MySQL compatibility, but you also have to remember that your application has to work with both altered and non-altered nodes - make sure that your alter won’t break the application logic. One good practice is to explicitly pass column names to queries - don’t rely on “SELECT *” because you never know how many columns you’ll get in return.

Galera and Row-based binary log format

Ok, so DML has to work on old and new schemas. How are DML’s transferred between Galera nodes? Does it affect what changes are compatible and what are not? Yes, indeed - it does. Galera does not use regular MySQL replication but it still relies on it to transfer events between the nodes. To be precise, Galera uses ROW format for events. An event in row format (after decoding) may look like this:

### INSERT INTO `schema`.`table`
### SET
###   @1=1
###   @2=1
###   @3='88764053989'
###   @4='14700597838'

Or:

### UPDATE `schema`.`table`
### WHERE
###   @1=1
###   @2=1
###   @3='88764053989'
###   @4='14700597838'
### SET
###   @1=2
###   @2=2
###   @3='88764053989'
###   @4='81084251066'

As you can see, there is a visible pattern: a row is identified by its content. There are no column names, just their order. This alone should turn on some warning lights: “what would happen if I remove one of the columns?” Well, if it is the last column, this is acceptable. If you would remove a column in the middle, this will mess up with the column order and, as a result, replication will break. Similar thing will happen if you add some column in the middle, instead of at the end. There are more constraints, though. Changing column definition will work as long as it is the same data type - you can alter INT column to become BIGINT but you cannot change INT column into VARCHAR - this will break replication. You can find detailed description of what change is compatible and what isn’t in the MySQL documentation. No matter what you can see in the documentation, to stay on the safe side, it’s better to run some tests on a separate development/staging cluster. Make sure it will work not only according to the documentation, but that it also works fine in your particular setup.

All in all, as you can clearly see, performing RSU in a safe way is much more complex than just running couple of commands. Still, as commands are important, let’s take a look at the example of how you can perform the RSU and what can go wrong in the process.

RSU example

Initial setup

Let’s imagine a rather simple example of an application. We will use a bechmark tool, Sysbench, to generate content and traffic, but the flow will be the same for almost every application - Wordpress, Joomla, Drupal, you name it. We will use HAProxy collocated with our application to split reads and writes among Galera nodes in a round-robin fashion. You can check below how HAProxy sees the Galera cluster.

Whole topology looks like below:

Traffic is generated using the following command:

while true ; do sysbench /root/sysbench/src/lua/oltp_read_write.lua --threads=4 --max-requests=0 --time=3600 --mysql-host=10.0.0.100 --mysql-user=sbtest --mysql-password=sbtest --mysql-port=3307 --tables=32 --report-interval=1 --skip-trx=on --table-size=100000 --db-ps-mode=disable run ; done

Schema looks like below:

mysql> SHOW CREATE TABLE sbtest1.sbtest1\G
*************************** 1. row ***************************
       Table: sbtest1
Create Table: CREATE TABLE `sbtest1` (
  `id` int(11) NOT NULL AUTO_INCREMENT,
  `k` int(11) NOT NULL DEFAULT '0',
  `c` char(120) NOT NULL DEFAULT '',
  `pad` char(60) NOT NULL DEFAULT '',
  PRIMARY KEY (`id`),
  KEY `k_1` (`k`)
) ENGINE=InnoDB AUTO_INCREMENT=29986632 DEFAULT CHARSET=latin1
1 row in set (0.00 sec)

First, let’s see how we can add an index to this table. Adding an index is a compatible change which can be easily done using RSU.

mysql> SET SESSION wsrep_OSU_method=RSU;
Query OK, 0 rows affected (0.00 sec)
mysql> ALTER TABLE sbtest1.sbtest1 ADD INDEX idx_new (k, c);
Query OK, 0 rows affected (5 min 19.59 sec)

As you can see in the Node tab, the host on which we executed the change has automatically switched to Donor/Desynced state which ensures that this host will not impact the rest of the cluster if it gets slowed down by the ALTER.

Let’s check how our schema looks now:

mysql> SHOW CREATE TABLE sbtest1.sbtest1\G
*************************** 1. row ***************************
       Table: sbtest1
Create Table: CREATE TABLE `sbtest1` (
  `id` int(11) NOT NULL AUTO_INCREMENT,
  `k` int(11) NOT NULL DEFAULT '0',
  `c` char(120) NOT NULL DEFAULT '',
  `pad` char(60) NOT NULL DEFAULT '',
  PRIMARY KEY (`id`),
  KEY `k_1` (`k`),
  KEY `idx_new` (`k`,`c`)
) ENGINE=InnoDB AUTO_INCREMENT=29986632 DEFAULT CHARSET=latin1
1 row in set (0.00 sec)

As you can see, the index has been added. Please keep in mind, though, this happened only on that particular node. To accomplish a full schema change, you have to follow this process on the remaining nodes of the Galera Cluster. To finish with the first node, we can switch wsrep_OSU_method back to TOI:

SET SESSION wsrep_OSU_method=TOI;
Query OK, 0 rows affected (0.00 sec)

We are not going to show the remainder of the process, because it’s the same - enable RSU on the session level, run ALTER, enable TOI. What’s more interesting is what would happen if the change will be incompatible. Let’s take again a quick look at the schema:

mysql> SHOW CREATE TABLE sbtest1.sbtest1\G
*************************** 1. row ***************************
       Table: sbtest1
Create Table: CREATE TABLE `sbtest1` (
  `id` int(11) NOT NULL AUTO_INCREMENT,
  `k` int(11) NOT NULL DEFAULT '0',
  `c` char(120) NOT NULL DEFAULT '',
  `pad` char(60) NOT NULL DEFAULT '',
  PRIMARY KEY (`id`),
  KEY `k_1` (`k`),
  KEY `idx_new` (`k`,`c`)
) ENGINE=InnoDB AUTO_INCREMENT=29986632 DEFAULT CHARSET=latin1
1 row in set (0.00 sec)

Let’s say we want to change the type of column ‘k’ from INT to VARCHAR(30) on one node.

mysql> SET SESSION wsrep_OSU_method=RSU;
Query OK, 0 rows affected (0.00 sec)
mysql> ALTER TABLE sbtest1.sbtest1 MODIFY COLUMN k VARCHAR(30) NOT NULL DEFAULT '';
Query OK, 10004785 rows affected (1 hour 14 min 51.89 sec)
Records: 10004785  Duplicates: 0  Warnings: 0

Now, lets take a look at the schema:

mysql> SHOW CREATE TABLE sbtest1.sbtest1\G
*************************** 1. row ***************************
       Table: sbtest1
Create Table: CREATE TABLE `sbtest1` (
  `id` int(11) NOT NULL AUTO_INCREMENT,
  `k` varchar(30) NOT NULL DEFAULT '',
  `c` char(120) NOT NULL DEFAULT '',
  `pad` char(60) NOT NULL DEFAULT '',
  PRIMARY KEY (`id`),
  KEY `k_1` (`k`),
  KEY `idx_new` (`k`,`c`)
) ENGINE=InnoDB AUTO_INCREMENT=29986632 DEFAULT CHARSET=latin1
1 row in set (0.02 sec)

Everything is as we expect - ‘k’ column has been changed to VARCHAR. Now we can check if this change is acceptable or not for the Galera Cluster. To test it, we will use one of remaining, unaltered nodes to execute the following query:

mysql> INSERT INTO sbtest1.sbtest1 (k, c, pad) VALUES (123, 'test', 'test');
Query OK, 1 row affected (0.19 sec)
ClusterControl
Single Console for Your Entire Database Infrastructure
Find out what else is new in ClusterControl

Let’s see what happened.

It definitely doesn’t look good - our node is down. Logs will give you more details:

2017-04-07T10:51:14.873524Z 5 [ERROR] Slave SQL: Column 1 of table 'sbtest1.sbtest1' cannot be converted from type 'int' to type 'varchar(30)', Error_code: 1677
2017-04-07T10:51:14.873560Z 5 [Warning] WSREP: RBR event 3 Write_rows apply warning: 3, 982675
2017-04-07T10:51:14.879120Z 5 [Warning] WSREP: Failed to apply app buffer: seqno: 982675, status: 1
         at galera/src/trx_handle.cpp:apply():351
Retrying 2th time
2017-04-07T10:51:14.879272Z 5 [ERROR] Slave SQL: Column 1 of table 'sbtest1.sbtest1' cannot be converted from type 'int' to type 'varchar(30)', Error_code: 1677
2017-04-07T10:51:14.879287Z 5 [Warning] WSREP: RBR event 3 Write_rows apply warning: 3, 982675
2017-04-07T10:51:14.879399Z 5 [Warning] WSREP: Failed to apply app buffer: seqno: 982675, status: 1
         at galera/src/trx_handle.cpp:apply():351
Retrying 3th time
2017-04-07T10:51:14.879618Z 5 [ERROR] Slave SQL: Column 1 of table 'sbtest1.sbtest1' cannot be converted from type 'int' to type 'varchar(30)', Error_code: 1677
2017-04-07T10:51:14.879633Z 5 [Warning] WSREP: RBR event 3 Write_rows apply warning: 3, 982675
2017-04-07T10:51:14.879730Z 5 [Warning] WSREP: Failed to apply app buffer: seqno: 982675, status: 1
         at galera/src/trx_handle.cpp:apply():351
Retrying 4th time
2017-04-07T10:51:14.879911Z 5 [ERROR] Slave SQL: Column 1 of table 'sbtest1.sbtest1' cannot be converted from type 'int' to type 'varchar(30)', Error_code: 1677
2017-04-07T10:51:14.879924Z 5 [Warning] WSREP: RBR event 3 Write_rows apply warning: 3, 982675
2017-04-07T10:51:14.885255Z 5 [ERROR] WSREP: Failed to apply trx: source: 938415a6-1aab-11e7-ac29-0a69a4a1dafe version: 3 local: 0 state: APPLYING flags: 1 conn_id: 125559 trx_id: 2856843 seqnos (l: 392283, g: 9
82675, s: 982674, d: 982563, ts: 146831275805149)
2017-04-07T10:51:14.885271Z 5 [ERROR] WSREP: Failed to apply trx 982675 4 times
2017-04-07T10:51:14.885281Z 5 [ERROR] WSREP: Node consistency compromized, aborting…

As can be seen, Galera complained about the fact that the column cannot be converted from INT to VARCHAR(30). It attempted to re-execute the writeset four times but it failed, unsurprisingly. As such, Galera determined that the node consistency is compromised and the node is kicked out of the cluster. Remaining content of the logs shows this process:

2017-04-07T10:51:14.885560Z 5 [Note] WSREP: Closing send monitor...
2017-04-07T10:51:14.885630Z 5 [Note] WSREP: Closed send monitor.
2017-04-07T10:51:14.885644Z 5 [Note] WSREP: gcomm: terminating thread
2017-04-07T10:51:14.885828Z 5 [Note] WSREP: gcomm: joining thread
2017-04-07T10:51:14.885842Z 5 [Note] WSREP: gcomm: closing backend
2017-04-07T10:51:14.896654Z 5 [Note] WSREP: view(view_id(NON_PRIM,6fcd492a,37) memb {
        b13499a8,0
} joined {
} left {
} partitioned {
        6fcd492a,0
        938415a6,0
})
2017-04-07T10:51:14.896746Z 5 [Note] WSREP: view((empty))
2017-04-07T10:51:14.901477Z 5 [Note] WSREP: gcomm: closed
2017-04-07T10:51:14.901512Z 0 [Note] WSREP: New COMPONENT: primary = no, bootstrap = no, my_idx = 0, memb_num = 1
2017-04-07T10:51:14.901531Z 0 [Note] WSREP: Flow-control interval: [16, 16]
2017-04-07T10:51:14.901541Z 0 [Note] WSREP: Received NON-PRIMARY.
2017-04-07T10:51:14.901550Z 0 [Note] WSREP: Shifting SYNCED -> OPEN (TO: 982675)
2017-04-07T10:51:14.901563Z 0 [Note] WSREP: Received self-leave message.
2017-04-07T10:51:14.901573Z 0 [Note] WSREP: Flow-control interval: [0, 0]
2017-04-07T10:51:14.901581Z 0 [Note] WSREP: Received SELF-LEAVE. Closing connection.
2017-04-07T10:51:14.901589Z 0 [Note] WSREP: Shifting OPEN -> CLOSED (TO: 982675)
2017-04-07T10:51:14.901602Z 0 [Note] WSREP: RECV thread exiting 0: Success
2017-04-07T10:51:14.902701Z 5 [Note] WSREP: recv_thread() joined.
2017-04-07T10:51:14.902720Z 5 [Note] WSREP: Closing replication queue.
2017-04-07T10:51:14.902730Z 5 [Note] WSREP: Closing slave action queue.
2017-04-07T10:51:14.902742Z 5 [Note] WSREP: /usr/sbin/mysqld: Terminated.

Of course, ClusterControl will attempt to recover such node - recovery involves running SST so incompatible schema changes will be removed, but we will be back at the square one - our schema change will be reversed.

As you can see, while running RSU is a very simple process, underneath it can be rather complex. It requires some tests and preparations to make sure that you won’t lose a node just because the schema change was not compatible.

ClusterControl Product Video for Galera Clusters

$
0
0

In this video Art van Scheppingen shows you how easy it is to add your Galera setups to ClusterControl. ClusterControl provides you with a single console to deploy, manage, monitor, and scale your Galera setups and mixed environment. In addition to advanced monitoring, ClusterControl affords feature benefits like comprehensive security, automation, reporting, and point-and-click deployments.

Watch the video and learn more about the following topics:

  • Deploying a new Galera cluster in ClusterControl
  • Importing an existing Galera Cluster into ClusterControl
  • Navigating the Cluster Overview section in ClusterControl
  • Accessing your Galera monitoring dashboards in ClusterControl
  • Accessing your Galera node data tables in ClusterControl
  • Accessing server statistics in ClusterControl
  • Navigating the nodes section in ClusterControl
  • Enabling binary logging from your Galera nodes in ClusterControl
  • Using advisors in your Galera setup
  • Performing backups
  • Access log files for
  • Adding new nodes to your Galera Clusters
  • Adding Asynchronous slaves
  • Cloning Clusters in ClusterControl
  • Load balancing for HAproxy, ProxySQL, MaxScale
  • Galera arbitrator in ClusterControl

Video: ClusterControl for Galera Cluster

$
0
0

This video walks you through the features that ClusterControl offers for Galera Cluster and how you can use them to deploy, manage, monitor and scale your open source database environments.

ClusterControl and Galera Cluster

ClusterControl provides advanced deployment, management, monitoring, and scaling functionality to get your Galera clusters up-and-running using proven methodologies that you can depend on to work.

At the core of ClusterControl is it’s automation functionality that let’s you automate many of the database tasks you have to perform regularly like deploying new clusters, adding and scaling new nodes, running backups and upgrades, and more.

ClusterControl is cluster-aware, topology-aware and able to provision all members of the Galera Cluster, including the replication chain connected to it.

To learn more check out the following resources…

How to Set Up Asynchronous Replication from Galera Cluster to Standalone MySQL server with GTID

$
0
0

Hybrid replication, i.e. combining Galera and asynchronous MySQL replication in the same setup, became much easier since GTID got introduced in MySQL 5.6. Although it was fairly straightforward to replicate from a standalone MySQL server to a Galera Cluster, doing it the other way round (Galera → standalone MySQL) was a bit more challenging. At least until the arrival of GTID.

There are a few good reasons to attach an asynchronous slave to a Galera Cluster. For one, long-running reporting/OLAP type queries on a Galera node might slow down an entire cluster, if the reporting load is so intensive that the node has to spend considerable effort coping with it. So reporting queries can be sent to a standalone server, effectively isolating Galera from the reporting load. In a belts and suspenders approach, an asynchronous slave can also serve as a remote live backup.

In this blog post, we will show you how to replicate a Galera Cluster to a MySQL server with GTID, and how to failover the replication in case the master node fails.

Hybrid Replication in MySQL 5.5

In MySQL 5.5, resuming a broken replication requires you to determine the last binary log file and position, which are distinct on all Galera nodes if binary logging is enabled. We can illustrate this situation with the following figure:

Galera cluster asynchronous slave topology without GTID

If the MySQL master fails, replication breaks and the slave will need to switch over to another master. You will need pick a new Galera node, and manually determine a new binary log file and position of the last transaction executed by the slave. Another option is to dump the data from the new master node, restore it on slave and start replication with the new master node. These options are of course doable, but not very practical in production.

How GTID Solves the Problem

GTID (Global Transaction Identifier) provides a better transactions mapping across nodes, and is supported in MySQL 5.6. In Galera Cluster, all nodes will generate different binlog files. The binlog events are the same and in the same order, but the binlog file names and offsets may vary. With GTID, slaves can see a unique transaction coming in from several masters and this could easily being mapped into the slave execution list if it needs to restart or resume replication.

Galera cluster asynchronous slave topology with GTID failover

All necessary information for synchronizing with the master is obtained directly from the replication stream. This means that when you are using GTIDs for replication, you do not need to include MASTER_LOG_FILE or MASTER_LOG_POS options in the CHANGE MASTER TO statement. Instead it is necessary only to enable the MASTER_AUTO_POSITION option. You can find more details about the GTID in the MySQL Documentation page.

Setting Up Hybrid Replication by hand

Make sure the Galera nodes (masters) and slave(s) are running on MySQL 5.6 before proceeding with this setup. We have a database called sbtest in Galera, which we will replicate to the slave node.

1. Enable required replication options by specifying the following lines inside each DB node’s my.cnf (including the slave node):

For master (Galera) nodes:

gtid_mode=ON
log_bin=binlog
log_slave_updates=1
enforce_gtid_consistency
expire_logs_days=7
server_id=1         # 1 for master1, 2 for master2, 3 for master3
binlog_format=ROW

For slave node:

gtid_mode=ON
log_bin=binlog
log_slave_updates=1
enforce_gtid_consistency
expire_logs_days=7
server_id=101         # 101 for slave
binlog_format=ROW
replicate_do_db=sbtest
slave_net_timeout=60

2. Perform a cluster rolling restart of the Galera Cluster (from ClusterControl UI > Manage > Upgrade > Rolling Restart). This will reload each node with the new configurations, and enable GTID. Restart the slave as well.

3. Create a slave replication user and run following statement on one of the Galera nodes:

mysql> GRANT REPLICATION SLAVE ON *.* TO 'slave'@'%' IDENTIFIED BY 'slavepassword';

4. Log into the slave and dump database sbtest from one of the Galera nodes:

$ mysqldump -uroot -p -h192.168.0.201 --single-transaction --skip-add-locks --triggers --routines --events sbtest > sbtest.sql

5. Restore the dump file onto the slave server:

$ mysql -uroot -p < sbtest.sql

6. Start replication on the slave node:

mysql> STOP SLAVE;
mysql> CHANGE MASTER TO MASTER_HOST = '192.168.0.201', MASTER_PORT = 3306, MASTER_USER = 'slave', MASTER_PASSWORD = 'slavepassword', MASTER_AUTO_POSITION = 1;
mysql> START SLAVE;

To verify that replication is running correctly, examine the output of slave status:

mysql> SHOW SLAVE STATUS\G
       ...
       Slave_IO_Running: Yes
       Slave_SQL_Running: Yes
       ...

Setting up Hybrid Replication using ClusterControl

In the previous paragraph we described all the necessary steps to enable the binary logs, restart the cluster node by node, copy the data and then setup replication. The procedure is a tedious task and you can easily make errors in one of these steps. In ClusterControl we have automated all the necessary steps.

1. For ClusterControl users, you can go to the nodes in the Nodes page and enable binary logging.

Enable binary logging on Galera cluster using ClusterControl

This will open a dialogue that allows you to set the binary log expiration, enable GTID and auto restart.

Enable binary logging with GTID enabled

This initiates a job, that will safely write these changes to the configuration, create replication users with the proper grants and restart the node safely.

Photo description

Repeat this process for each Galera node in the cluster, until all nodes indicate they are master.

All Galera Cluster nodes are now master

2. Add the asynchronous replication slave to the cluster

Adding an asynchronous replication slave to Galera Cluster using ClusterControl

And this is all you have to do. The entire process described in the previous paragraph has been automated by ClusterControl.

Changing Master

If the designated master goes down, the slave will retry to reconnect again in slave_net_timeout value (our setup is 60 seconds - default is 1 hour). You should see following error on slave status:

       Last_IO_Errno: 2003
       Last_IO_Error: error reconnecting to master 'slave@192.168.0.201:3306' - retry-time: 60  retries: 1

Since we are using Galera with GTID enabled, master failover is supported via ClusterControl when Cluster and Node Auto Recovery has been enabled. Whether the master would fail due to network connectivity or any other reason, ClusterControl will automatically fail over to the most suitable other master node in the cluster.

If you wish to perform the failover manually, simply change the master node as follows:

mysql> STOP SLAVE;
mysql> CHANGE MASTER TO MASTER_HOST = '192.168.0.202', MASTER_PORT = 3306, MASTER_USER = 'slave', MASTER_PASSWORD = 'slavepassword', MASTER_AUTO_POSITION = 1;
mysql> START SLAVE;

In some cases, you might encounter a “Duplicate entry .. for key” error after the master node changed:

       Last_Errno: 1062
       Last_Error: Could not execute Write_rows event on table sbtest.sbtest; Duplicate entry '1089775' for key 'PRIMARY', Error_code: 1062; handler error HA_ERR_FOUND_DUPP_KEY; the event's master log mysqld-bin.000009, end_log_pos 85789000

In older versions of MySQL, you can just use SET GLOBAL SQL_SLAVE_SKIP_COUNTER = n to skip statements, but it does not work with GTID. Miguel from Percona wrote a great blog post on how to repair this by injecting empty transactions.

Another approach, for smaller databases, could also be to just get a fresh dump from any of the available Galera nodes, restore it and use RESET MASTER statement:

mysql> STOP SLAVE;
mysql> RESET MASTER;
mysql> DROP SCHEMA sbtest; CREATE SCHEMA sbtest; USE sbtest;
mysql> SOURCE /root/sbtest_from_galera2.sql; -- repeat step #4 above to get this dump
mysql> CHANGE MASTER TO MASTER_HOST = '192.168.0.202', MASTER_PORT = 3306, MASTER_USER = 'slave', MASTER_PASSWORD = 'slavepassword', MASTER_AUTO_POSITION = 1;
mysql> START SLAVE;

You may also use pt-table-checksum to verify the replication integrity, more information in this blog post.

Note: Since in MySQL replication the slave applier is by default still single-threaded, do not expect the async replication performance to be the same as Galera’s parallel replication. For MySQL 5.6 and 5.7 there are options to make the asynchronous replication executed in parallel on the slave nodes, but in principle this replication is still depending on the correct order of transactions inside the same schema to happen. If the replication load is intensive and continuous, the slave lag will just keep growing. We have seen cases where slave could never catch up with the master.


How to Deploy Asynchronous Replication Slave to MariaDB Galera Cluster 10.x using ClusterControl

$
0
0

Combining Galera and asynchronous replication in the same MariaDB setup, aka Hybrid Replication, can be useful - e.g. as a live backup node in a remote datacenter or reporting/analytics server. We already blogged about this setup for Codership/Galera or Percona XtraDB Cluster users, but a master failover as described in that post does not work for MariaDB because of its different GTID approach. In this post, we will show you how to deploy an asynchronous replication slave to MariaDB Galera Cluster 10.x (with master failover!), using GTID with ClusterControl.

Preparing the Master

First and foremost, you must ensure that the master and slave nodes are running on MariaDB Galera 10.0.2 or later. A MariaDB replication slave requires at least one master with GTID among the Galera nodes. However, we would recommend users to configure all the MariaDB Galera nodes as masters. GTID, which is automatically enabled in MariaDB, will be used to do master failover.The following must be true for the masters:

  • At least one master among the Galera nodes
  • All masters must be configured with the same domain ID
  • log_slave_updates must be enabled
  • All masters’ MariaDB port is accessible by ClusterControl and slaves
  • Must be running MariaDB version 10.0.2 or later

From ClusterControl this is easily done by selecting Enable Binary Logging in the drop down for each node.

Enabling binary logging through ClusterControl

And then enable GTID in the dialogue:

Once Proceed has been clicked, a job will automatically configure the Galera node according to the settings described earlier.

If you wish to perform this action by hand, you can configure a Galera node as master, by changing the MariaDB configuration file for that node as per below:

gtid_domain_id=<must be same across all mariadb servers participating in replication>
server_id=<must be unique>
binlog_format=ROW
log_slave_updates=1
log_bin=binlog

After making these changes, restart the nodes one by one or using a rolling restart (ClusterControl > Manage > Upgrades > Rolling Restart)

ClusterControl
Single Console for Your Entire Database Infrastructure
Find out what else is new in ClusterControl

Preparing the Slave

For the slave, you would need a separate host or VM with or without MariaDB installed. If you do not have MariaDB installed, you need to perform the following tasks; configure root password (based on monitored_mysql_root_password), create slave user (based on repl_user, repl_password), configure MariaDB, start the server and finally start replication.

Adding the slave using ClusterControl, all these steps will be automated in the Add Replication Slave job as described below.

Add replication slave to MariaDB Cluster

After adding our slave node, our deployment will look like this:

MariaDB Galera asynchronous slave topology

Master Failover and Recovery

Since we are using MariaDB with GTID enabled, master failover is supported via ClusterControl when Cluster and Node Auto Recovery has been enabled. Whether the master would fail due to network connectivity or any other reason, ClusterControl will automatically fail over to the most suitable other master node in the cluster.

Automatic slave failover to another master in Galera cluster

This way ClusterControl will add a robust asynchronous slave capability to your MariaDB Cluster!

MySQL on Docker: ClusterControl and Galera Cluster on Docker Swarm

$
0
0

Our journey in adopting MySQL and MariaDB in containerized environments continues, with ClusterControl coming into the picture to facilitate deployment and management. We already have our ClusterControl image hosted in Docker Hub, where it can deploy different replication/cluster topologies on multiple containers. With the introduction of Docker Swarm, a native orchestration tools embedded inside Docker Engine, scaling and provisioning containers has become much easier. It also has high availability covered by running services on multiple Docker hosts.

In this blog post, we’ll be experimenting with automatic provisioning of Galera Cluster on Docker Swarm with ClusterControl. ClusterControl would usually deploy database clusters on bare-metal, virtual machines and cloud instances. ClusterControl relies on SSH (through libssh) as core communication module to connect to the managed hosts, so these would not require any agents. The same rule can be applied to containers, and that’s what we are going to show in this blog post.

ClusterControl as Docker Swarm Service

We have built a Docker image with extended logic to handle deployment in container environments in a semi-automatic way. The image is now available on Docker Hub and the code is hosted in our Github repository. Please note that only this image is capable of deploying on containers, and is not available in the standard ClusterControl installation packages.

The extended logic is inside deploy-container.sh, a script that monitors a custom table inside CMON database called “cmon.containers”. The created database container shall report and register itself into this table and this script will look for new entries and perform the necessary action using a ClusterControl CLI. The deployment is automatic, and you can monitor the progress directly from the ClusterControl UI or using “docker logs” command.

Before we go further, take note of some prerequisites for running ClusterControl and Galera Cluster on Docker Swarm:

  • Docker Engine version 1.12 and later.
  • Docker Swarm Mode is initialized.
  • ClusterControl must be connected to the same overlay network as the database containers.

To run ClusterControl as a service using “docker stack”, the following definition should be enough:

 clustercontrol:
    deploy:
      replicas: 1
    image: severalnines/clustercontrol
    ports:
      - 5000:80
    networks:
      - galera_cc

Or, you can use the “docker service” command as per below:

$ docker service create --name cc_clustercontrol -p 5000:80 --replicas 1 severalnines/clustercontrol

Or, you can combine the ClusterControl service together with the database container service and form a “stack” in a compose file as shown in the next section.

Base Containers as Docker Swarm Service

The base container’s image called “centos-ssh” is based on CentOS 6 image. It comes with a couple of basic packages like SSH server, clients, curl and mysql client. The entrypoint script will download ClusterControl’s public key for passwordless SSH during startup. It will also register itself to the ClusterControl’s CMON database for automatic deployment.

Running this container requires a couple of environment variables to be set:

  • CC_HOST - Mandatory. By default it will try to connect to “cc_clustercontrol” service name. Otherwise, define its value in IP address, hostname or service name format. This container will download the SSH public key from ClusterControl node automatically for passwordless SSH.
  • CLUSTER_TYPE - Mandatory. Default to “galera”.
  • CLUSTER_NAME - Mandatory. This name distinguishes the cluster with others from ClusterControl perspective. No space allowed and it must be unique.
  • VENDOR - Default is “percona”. Other supported values are “mariadb”, “codership”.
  • DB_ROOT_PASSWORD - Mandatory. The database root password for the database server. In this case, it should be MySQL root password.
  • PROVIDER_VERSION - Default is 5.6. The database version by the chosen vendor.
  • INITIAL_CLUSTER_SIZE - Default is 3. This indicates how ClusterControl should treat newly registered containers, whether they are for new deployments or for scaling out. For example, if the value is 3, ClusterControl will wait for 3 containers to be running and registered into the CMON database before starting the cluster deployment job. Otherwise, it waits 30 seconds for the next cycle and retries. The next containers (4th, 5th and Nth) will fall under the “Add Node” job instead.

To run the container, simply use the following stack definition in a compose file:

  galera:
    deploy:
      replicas: 3
    image: severalnines/centos-ssh
    ports:
      - 3306:3306
    environment:
      CLUSTER_TYPE: "galera"
      CLUSTER_NAME: "PXC_Docker"
      INITIAL_CLUSTER_SIZE: 3
      DB_ROOT_PASSWORD: "mypassword123"
    networks:
      - galera_cc

By combining them both (ClusterControl and database base containers), we can just deploy them under a single stack as per below:

version: '3'

services:

  galera:
    deploy:
      replicas: 3
      restart_policy:
        condition: on-failure
        delay: 10s
    image: severalnines/centos-ssh
    ports:
      - 3306:3306
    environment:
      CLUSTER_TYPE: "galera"
      CLUSTER_NAME: "Galera_Docker"
      INITIAL_CLUSTER_SIZE: 3
      DB_ROOT_PASSWORD: "mypassword123"
    networks:
      - galera_cc

  clustercontrol:
    deploy:
      replicas: 1
    image: severalnines/clustercontrol
    ports:
      - 5000:80
    networks:
      - galera_cc

networks:
  galera_cc:
    driver: overlay

Save the above lines into a file, for example docker-compose.yml in the current directory. Then, start the deployment:

$ docker stack deploy --compose-file=docker-compose.yml cc
Creating network cc_galera_cc
Creating service cc_clustercontrol
Creating service cc_galera

Docker Swarm will deploy one container for ClusterControl (replicas:1) and another 3 containers for the database cluster containers (replicas:3). The database container will then register itself into the CMON database for deployment.

Wait for a Galera Cluster to be ready

The deployment will be automatically picked up by the ClusterControl CLI. So you basically don’t have to do anything but wait. The deployment usually takes around 10 to 20 minutes depending on the network connection.

Open the ClusterControl UI at http://{any_Docker_host}:5000/clustercontrol, fill in the default administrator user details and log in. Monitor the deployment progress under Activity -> Jobs, as shown in the following screenshot:

Or, you can look at the progress directly from the docker logs command of the ClusterControl container:

$ docker logs -f $(docker ps | grep clustercontrol | awk {'print $1'})>> Found the following cluster(s) is yet to deploy:
Galera_Docker>> Number of containers for Galera_Docker is lower than its initial size (3).>> Nothing to do. Will check again on the next loop.>> Found the following cluster(s) is yet to deploy:
Galera_Docker>> Found a new set of containers awaiting for deployment. Sending deployment command to CMON.>> Cluster name         : Galera_Docker>> Cluster type         : galera>> Vendor               : percona>> Provider version     : 5.7>> Nodes discovered     : 10.0.0.6 10.0.0.7 10.0.0.5>> Initial cluster size : 3>> Nodes to deploy      : 10.0.0.6;10.0.0.7;10.0.0.5>> Deploying Galera_Docker.. It's gonna take some time..>> You shall see a progress bar in a moment. You can also monitor>> the progress under Activity (top menu) on ClusterControl UI.
Create Galera Cluster
- Job  1 RUNNING    [██▊       ]  26% Installing MySQL on 10.0.0.6

That’s it. Wait until the deployment completes and you will then be all set with a three-node Galera Cluster running on Docker Swarm, as shown in the following screenshot:

In ClusterControl, it has the same look and feel as what you have seen with Galera running on standard hosts (non-container) environment.

ClusterControl
Single Console for Your Entire Database Infrastructure
Find out what else is new in ClusterControl

Management

Managing database containers is a bit different with Docker Swarm. This section provides an overview of how the database containers should be managed through ClusterControl.

Connecting to the Cluster

To verify the status of the replicas and service name, run the following command:

$ docker service ls
ID            NAME               MODE        REPLICAS  IMAGE
eb1izph5stt5  cc_clustercontrol  replicated  1/1       severalnines/clustercontrol:latest
ref1gbgne6my  cc_galera          replicated  3/3       severalnines/centos-ssh:latest

If the application/client is running on the same Swarm network space, you can connect to it directly via the service name endpoint. If not, use the routing mesh by connecting to the published port (3306) on any of the Docker Swarm nodes. The connection to these endpoints will be load balanced automatically by Docker Swarm in a round-robin fashion.

Scale up/down

Typically, when adding a new database, we need to prepare a new host with base operating system together with passwordless SSH. In Docker Swarm, you just need to scale out the service using the following command to the number of replicas that you desire:

$ docker service scale cc_galera=5
cc_galera scaled to 5

ClusterControl will then pick up the new containers registered inside cmon.containers table and trigger add node jobs, for one container at a time. You can look at the progress under Activity -> Jobs:

Scaling down is similar, by using the “service scale” command. However, ClusterControl doesn’t know whether the containers that have been removed by Docker Swarm were part of the auto-scheduling or just a scale down (which indicates that we deliberately wanted the containers to be removed). Thus, to scale down from 5 nodes to 3 nodes, one would:

$ docker service scale cc_galera=3
cc_galera scaled to 3

Then, remove the stopped hosts from the ClusterControl UI by going to Nodes -> rollover the removed container -> click on the ‘X’ icon on the top right -> Confirm & Remove Node:

ClusterControl will then execute a remove node job and bring back the cluster to the expected size.

Failover

In case of container failure, Docker Swarm automatic rescheduling will kick in and there will be a new replacement container with the same IP address as the old one (with different container ID). ClusterControl will then start to provision this node from scratch, by performing the installation process, configuration and getting it to rejoin the cluster. The old container will be removed automatically from ClusterControl before the deployment starts.

Go ahead and try to kill one of the database containers:

$ docker kill [container ID]

You’ll see the new containers that Swarm created will be provisioned automatically by ClusterControl.

Creating a new cluster

To create a new cluster, just create another service or stack with a different CLUSTER_NAME and service name. The following is an example that we want to create another Galera Cluster running on MariaDB 10.1 (some extra environment variables are required for MariaDB 10.1):

version: '3'
services:
  galera2:
    deploy:
      replicas: 3
    image: severalnines/centos-ssh
    ports:
      - 3306
    environment:
      CLUSTER_TYPE: "galera"
      CLUSTER_NAME: "MariaDB_Galera"
      VENDOR: "mariadb"
      PROVIDER_VERSION: "10.1"
      INITIAL_CLUSTER_SIZE: 3
      DB_ROOT_PASSWORD: "mypassword123"
    networks:
      - cc_galera_cc

networks:
  cc_galera_cc:
    external: true

Then, create the service:

$ docker stack deploy --compose-file=docker-compose.yml db2

Go back to ClusterControl UI -> Activity -> Jobs and you should see a new deployment has started. After a couple of minutes, you will see the new cluster will be listed inside ClusterControl dashboard:

Destroying everything

To remove everything (including the ClusterControl container), you just need to remove the stack created by Docker Swarm:

$ docker stack rm cc
Removing service cc_clustercontrol
Removing service cc_galera
Removing network cc_galera_cc

That’s it, the whole stack has been removed. Pretty neat huh? You can start all over again by running the “docker stack deploy” command and everything will be ready after a couple of minutes.

Summary

The flexibility you get by running a single command to deploy or destroy a whole environment can be useful in different types of use cases such as backup verification, DDL procedure testing, query performance tweaking, experimenting for proof-of-concepts and also for staging temporary data. These use cases are closer to developer environment. With this approach, you can now treat a stateful service “statelessly”.

Would you like to see ClusterControl manage the whole database container stack through the UI via point and click? Let us know your thoughts in the comments section below. In the next blog post, we are going to look at how to perform automatic backup verification on Galera Cluster using containers.

How Galera Cluster Enables High Availability for High Traffic Websites

$
0
0

In today’s competitive technology environment, high availability is a must. There is no way around it - if your website or service is not available, then most probably you are losing money. It could relate directly to money loss - your customers cannot access your e-commerce service and they cannot spend their money (in addition, they are likely to use your competitors instead). Or it can be less directly linked - your sales reps cannot reach your web-based CRM system and that seriously limits their productivity. No matter how, a website which cannot be reached can be more or less serious for any organization. The question is - how do we ensure that your website will stay available? Assuming you are using MySQL or MariaDB (not unlikely, if it is a website), one of the technologies that can be utilized is Galera Cluster. In this blog post, we’ll show you how to leverage a high availability database to improve the availability of your site.

High availability is hard with databases

Every website is different, but in general, we’ll see some frontend webservers, a database backend, load balancers, file system storage and additional components like caching systems. To make a website highly available, we would need each component to be highly available so we do not have any single point of failure (SPOF).

The webserver tier is usually relatively easy to scale, as it is possible to deploy multiple instances behind a load balancer. If you would want to preserve session state across all webservers, one would probably store it in a shared database (Memcached, or even MySQL Cluster for a pretty robust alternative). Load balancers can be made highly available (e.g. HAProxy/Keepalived/VIP). There are a number of clustered file systems that can be used for the storage layer, we have previously covered solutions like csync2 with lsyncd, GlusterFS, OCFS2. The database service can be made highly available with e.g. DRBD, so all storage is replicated to a standby server. This means the service can be started on another host that has access to the database files.

This might not work very well for a high traffic website though, as all webservers will still be hitting the primary database instance. Failover time also can take a while, since you are failing over to a cold standby server and MySQL has to perform crash recovery when starting up.

MySQL master-slave replication is another option, and there are different ways to make it highly available. There are inconveniences though, as not all nodes are the same - you need to ensure to just write to one master and avoid diverging datasets across the nodes.

Galera Cluster for MySQL/MariaDB

Let’s start with discussing what Galera Cluster is and what it is not. It is a virtually synchronous, multi-master cluster. You can access any of the nodes and issue reads and writes - this is a significant improvement compared to replication setups - no need for failovers and master promotions, if one node is down, usually you can just connect to another node and execute queries. Galera provides a self-healing mechanism through state transfers - State Snapshot Transfer (SST) and Incremental State Transfer (IST). What it means is that when a node joins a cluster, Galera will attempt to bring it back to sync. It may just copy missing data from other node’s gcache (IST) or, if none of nodes contain data in its gcache, it will copy all of the contents of one of nodes to the joining node (via SST). This also makes it very easy for a Galera Cluster to recover even from serious failure conditions. Galera Cluster is a method to scale reads - you can increase a size of the cluster and you can read from all of the slaves.

On the other hand, you have to keep in mind what Galera is not. Galera is not a solution which implements sharding (like NDB Cluster does) - it does not shard the data automatically, each and every Galera node contains the same full data set, just like a standalone MySQL node. Therefore, Galera is not a solution which can help you scale writes. It can help you squeeze more writes than standard, single-threaded replication as it can utilize multiple writers at once, but as of MySQL 5.7, you can use multithreaded replication for every workload so it’s not the same advantage it used to be. Galera is not a solution which can be left alone - even though it has some auto healing features, it still requires user supervision and it happens pretty often that Galera cannot recover on its own.

Having said that, Galera Cluster is still a great piece of software, which can be utilized to build highly available clusters. In the next section we’ll show you different deployment patterns for Galera. Before we get there, there is one more very important bit of information that is required to understand why we want to deploy Galera clusters the way we are about to describe - quorum calculations. Galera has a mechanism which prevents split brain scenarios from happening. It detects number of available nodes and checks if there is a quorum available - Galera has to see (50% + 1) nodes to accept traffic. Otherwise it assumes that a split brain happened and it is a part of a minority segment which does not contain current data nor it can accept writes. Ok, now let’s talk about different ways in which you can deploy Galera cluster.

Deploying Galera cluster

Basic deployment - three node cluster

The most common way in which Galera cluster is deployed is to use an odd number of nodes and just deploy them. The most basic setup for Galera is a three node cluster. This setup is enough to survive a loss of one node - it still can operate just fine even though its read capacity decreases and it cannot tolerate any more failures. Such setup is very common to be used as an entry level - you can always add more nodes in the future, keeping in mind that you should use an odd number of nodes. We have seen Galera clusters as big as 11 - 13 nodes.

Minimalistic approach - two nodes + garbd

If you want to do some testing with Galera, you can reduce the cluster size to two nodes. A 2-node cluster does not provide any fault tolerance but we can improve this by leveraging Galera Arbitrator (garbd) - a daemon which can be started on a third node. It will receive all of the Galera traffic and for the purpose of detecting failures and forming a quorum, it acts as a Galera node. Given that garbd doesn’t need to apply writesets (it just accepts them, no further action is taken), it doesn’t require beefy hardware, like database nodes would need. This reduce the cost of hardware that’s needed to build the cluster.

One step further - add asynchronous slave

At any point you can extend your Galera cluster by adding one or more asynchronous slaves. Ideally, your Galera cluster has GTID enabled - it makes adding and reslaving slaves so much easier. Even if not, it is still possible to create a slave, although replication is much less likely to survive a crash of the “master” galera node. Such asynchronous slave can be used for a variety of reasons. It can be used as a backup host - run your backups on it to minimize the impact on Galera cluster. It can also be used for heavier, OLAP queries - again, to remove load from the Galera cluster. Another reason why you may want to use asynchronous slave is to build a Disaster Recovery environment - set it up in a separate datacenter and, in case the location of your Galera Cluster would go up in flames, you will still have a copy of your data in a safe location.

Multi-datacenter Galera clusters

If you really care about availability of your data, you can improve it by spanning your Galera cluster across multiple datacenters. Galera can be used across the WAN - some reconfiguration may be needed to make it better adapted to higher latency of WAN connections but it is totally suitable to work in such environment. The only blocker would be if your application frequently modifies a very small subset of rows - this could significantly reduce number of queries per second it will be able to execute.

When talking about WAN-spanning Galera clusters it is important to mention segments. Segments are used in Galera to differentiate the nodes of the cluster which are collocated in the same DC. For example, you may want to configure all nodes in the datacenter “A” to use segment 1 and all nodes in the datacenter “B” to use segment 2. We won’t go into details here (we covered this bit extensively in one of our posts) but in short, using segments reduce inter-segment communication - something you definitely want if segments are connected using WAN.

Another important aspect of building a highly available Galera Cluster over multiple datacenters is to use an odd number of datacenters. Two is not enough to build a setup which would automatically tolerate a loss of a datacenter. Let’s analyze following setup.

As we mentioned earlier, Galera requires a quorum to operate. Let’s see what would happen if one datacenter is not available:

As you can clearly see, we ended up with 3 nodes up, so 50% only - not enough to form a quorum. Manual action is required to assess the situation and promote the remaining part of the cluster to form a “Primary Component” - this requires time and it prolongs downtime.

Let’s take a look at another option:

In this case we added one more node to the datacenter “B” to make sure it will take over the traffic when DC “A” is down. But what would happen if DC “B” goes down?

We have three nodes out of seven, less than 50%. The only way is to use a third datacenter. You can, of course, use one more segment of three nodes (or more, it’s important to have the same number of nodes in each datacenter) but you can minimize costs by utilizing Galera Arbitrator:

In this case, no matter which datacenter will stop operating, as long as it will be only one of them, with garbd we have a quorum:

In our example it is: seven nodes in total, three down, four (3 + garbd) up - enough to form a quorum.

Multiple Galera clusters connected using asynchronous replication

We mentioned that you can deploy an asynchronous slave to Galera cluster and use it, for example, as a DR host. You also have to keep in mind that Galera cluster, to some extent, can be treated as a single MySQL instance. This means there’s no reason why you couldn’t connect two separate Galera clusters using asynchronous replication. Such setup is pretty common. Again, as with regular slaves, it’s better to have GTID because it allows you to quickly reslave your “standby” Galera cluster to another Galera node in the “active” cluster. Without GTID this is also possible but it’s so much more time-consuming and error-prone. Of course, such setup does work together as the multi-DC Galera cluster would - there’s no automated recovery of the replication link between datacenters, there’s no automated reslaving if a “master” Galera node goes down. You may need to build your own tools to automate this process.

Proxy layer

There is no high availability without a proxy layer (unless you have built-in HA in your application). Static connections to a single host does not scale. What you need is a middleman - something that will sit between your application and your database tier and mask the complexity of your database setup. Ideally, your application will have just a single point of access to your databases - connect to a given host and port - that’s it.

You can choose between different proxies - HAProxy, MaxScale, ProxySQL - all of them can work with Galera Cluster. Some of them, though, may require additional configuration - you need to know what and how it needs to be done. Additionally, it’s extremely important so you won’t end up with a proxy as a single point of failure. Each of those proxies can be deployed in a highly available fashion, and you will need to have a few components work together.

How ClusterControl can help you to build highly available Galera Clusters?

ClusterControl can help deploy Galera using all the vendors that are available: Codership, Percona XtraDB Cluster and MariaDB Cluster.

When you deployed a cluster, you can easily scale it up. If needed, you can define different segments for WAN-spanning cluster.

You can also, if you want, deploy an asynchronous slave to the Galera Cluster.

You can use ClusterControl to deploy Galera Arbitrator, which can be very helpful (as we shown previously) in multi-datacenter deployments.

Proxy layer

ClusterControl gives you ability to deploy different proxies with your Galera Cluster. It support deployments of HAProxy, MaxScale and ProxySQL. For HAProxy and ProxySQL, there are additional options to deploy redundant instances with Keepalived and VirtualIP.

For HAProxy, ClusterControl has a statistics page. You can also set a node to maintenance state:

For MaxScale, using ClusterControl, you have access to MaxScale’s CLI and you can perform any actions that are possible from it. Please note we deploy MaxScale version 1.4.3 - more recent versions introduced licensing limitations.

ClusterControl provides quite a bit of functionality for managing ProxySQL, including creating query rules and query caching, including creating query rules and query caching. If you are interested in more details, we encourage you to watch the replay of one of our webinars in which we demoed this UI.

As mentioned previously, ClusterControl can also deploy HAProxy and ProxySQL in a highly available setup. We use virtual IP and Keepalived to track the state of services and perform a failover if needed.

As we have seen in this blog, Galera Cluster can be used in a number of ways to provide high availability of your database, which is a key part of the web infrastructure. You are welcome to download ClusterControl and try the different topologies we discussed above.

ClusterControl for Galera Cluster for MySQL

$
0
0

ClusterControl allows you to easily manage your database infrastructure on premise or in the cloud. With in-depth support for technologies like Galera Cluster for MySQL and MariaDB setups, you can truly automate mixed environments for next-level applications.

Since the launch of ClusterControl in 2012, we’ve experienced growth in new industries with customers who are benefiting from the advancements ClusterControl has to offer - in particular when it comes to Galera Cluster for MySQL.

In addition to reaching new highs in ClusterControl demand, this past year we’ve doubled the size of our team allowing us to continue to provide even more improvements to ClusterControl.

Take a look at this infographic for our top Galera Cluster for MySQL resources and information about how ClusterControl works with Galera Cluster.

How to use s9s -The Command Line Interface to ClusterControl

$
0
0

s9s is our official command line tool to interact with ClusterControl. We’re pretty excited about this, as we believe its ease of use and script-ability will make our users even more productive. Let’s have a look at how to use it. In this blog, we’ll show you how to use s9s to deploy and manage your database clusters.

ClusterControl v1.4.1 comes with an optional package called s9s-tools, which contains a binary called "s9s". As most of you already know, ClusterControl provides a graphical user interface from where you can deploy, monitor and manage your databases. The GUI interacts with the ClusterControl Controller (cmon) via an RPC interface. The new CLI client is another way to interact with the RPC interface, by using a collection of command line options and arguments. At the time of writing, the CLI has support for a big chunk of the ClusterControl functionality and the plan is to continue to build it out. Please refer to ClusterControl CLI documentation page for more details. It is worth mentioning that the CLI is open source, so it is possible for anybody to add functionality to it.

As a side note, s9s is the backbone that drives the automatic deployment when running ClusterControl and Galera Cluster on Docker Swarm as shown in this blog post. You should take note that this tool is relatively new and comes with some limitations like different user management module and no support for Role Based Access Control.

Setting up the Client

Starting from version 1.4.1, the installer script will automatically install this package on the ClusterControl node. You can also install it on another computer or workstation to manage the database cluster remotely. All communication is encrypted and secure through SSH.

In this example, the client will be installed on another workstation running on Ubuntu. We are going to connect to the ClusterControl server remotely. Here is the diagram to illustrate this:

We have covered the installation and configuration steps in the documentation. Ensure you perform the following steps:

  1. On the ClusterControl host, ensure it runs on ClusterControl Controller 1.4.1 and later.
  2. On the ClusterControl host, ensure CMON RPC interface (port 9500 and 9501) is listening to an IP address that is routable to external network. Follow these steps.
  3. Install s9s-tools package on the workstation. Follow these installation steps.
  4. Configure the Remote Access. Follow these steps.

Take note that it is also possible to build the s9s command line client on other Linux distribution and Mac OS/X as described here. The command line client installs manual pages and can be viewed by entering the command:

$ man s9s

Deploy Everything through CLI

In this example, we are going to perform the following operations with the CLI:

  1. Deploy a three-node Galera Cluster
  2. Monitor state and process
  3. Create schema and user
  4. Take backups
  5. Cluster and node operations
  6. Scaling up/down

Deploy a three-node Galera Cluster

First, on the ClusterControl host, ensure we have setup passwordless SSH to all the target hosts:

(root@clustercontrol)$ ssh-copy-id 10.0.0.3
(root@clustercontrol)$ ssh-copy-id 10.0.0.4
(root@clustercontrol)$ ssh-copy-id 10.0.0.5

Then, from the client workstation:

(client)$ s9s cluster --create --cluster-type=galera --nodes="10.0.0.3;10.0.0.4;10.0.0.5"  --vendor=percona --provider-version=5.7 --db-admin-passwd="mySecr3t" --os-user=root --cluster-name="PXC_Cluster_57" --wait

We defined “--wait” which means the job will run in the foreground and wait for the job to complete. It will return 0 for a successful job or non-zero if the job fails. To let this process run as a background job, just omit this flag.

Then, you should see the progress bar:

Create Galera Cluster
\ Job  1 RUNNING    [▊       ]  26% Installing MySQL on 10.0.0.3

The same progress can be monitored under Activity (top menu) of the ClusterControl UI:

Notice that the job was initiated by user 'dba', which is our command line remote user.

Monitor state and process

There are several ways to look for the cluster. You can simply list out the cluster with --list:

$ s9s cluster --list --long
ID STATE   TYPE   OWNER GROUP NAME           COMMENT
 1 STARTED galera dba   users PXC_Cluster_57 All nodes are operational.
Total: 1

Also, there is another flag called --stat for a more detailed summary:

$ s9s cluster --stat
    Name: PXC_Cluster_57                      Owner: dba/users
      ID: 1                                   State: STARTED
    Type: GALERA                             Vendor: percona 5.7
  Status: All nodes are operational.
  Alarms:  0 crit   1 warn
    Jobs:  0 abort  0 defnd  0 dequd  0 faild  2 finsd  0 runng
  Config: '/etc/cmon.d/cmon_1.cnf'

Take note that you can use cluster ID or name value as the identifier when manipulating our Galera Cluster. More examples further down.

To get an overview of all nodes, we can simply use the “node” command option:

$ s9s node --list --long
ST  VERSION         CID CLUSTER        HOST      PORT COMMENT
go- 5.7.17-13-57      1 PXC_Cluster_57 10.0.0.3  3306 Up and running
go- 5.7.17-13-57      1 PXC_Cluster_57 10.0.0.4  3306 Up and running
go- 5.7.17-13-57      1 PXC_Cluster_57 10.0.0.5  3306 Up and running
co- 1.4.1.1834        1 PXC_Cluster_57 10.0.0.7  9500 Up and running
go- 10.1.23-MariaDB   2 MariaDB_10.1   10.0.0.10 3306 Up and running
go- 10.1.23-MariaDB   2 MariaDB_10.1   10.0.0.11 3306 Up and running
co- 1.4.1.1834        2 MariaDB_10.1   10.0.0.7  9500 Up and running
gr- 10.1.23-MariaDB   2 MariaDB_10.1   10.0.0.9  3306 Failed
Total: 8

s9s allows you to have an aggregated view of all processes running on all nodes. It can be represented in a real-time format (similar to ‘top’ output) or one-time format (similar to ‘ps’ output). To monitor live processes, you can do:

$ s9s process --top --cluster-id=1
PXC_Cluster_57 - 04:27:12                                           All nodes are operational.
4 hosts, 16 cores,  6.3 us,  0.7 sy, 93.0 id,  0.0 wa,  0.0 st,
GiB Mem : 14.8 total, 2.9 free, 4.6 used, 0.0 buffers, 7.2 cached
GiB Swap: 7 total, 0 used, 7 free,

PID   USER   HOST     PR  VIRT      RES    S   %CPU   %MEM COMMAND
 4623 dba    10.0.0.5 20  5700352   434852 S  20.27  11.24 mysqld
 4772 dba    10.0.0.4 20  5634564   430864 S  19.99  11.14 mysqld
 2061 dba    10.0.0.3 20  5780688   459160 S  19.91  11.87 mysqld
  602 root   10.0.0.7 20  2331624    38636 S   8.26   1.00 cmon
  509 mysql  10.0.0.7 20  2613836   163124 S   0.66   4.22 mysqld
...

Similar to top command, you can get a real-time summary for all nodes under this cluster. The first line tells us the cluster name, current time and the cluster state. The second, third and fourth lines are accumulated resources of all nodes in the cluster combined. In this example, we used 4 hosts (1 ClusterControl + 3 Galera), each has 4 cores, ~4 GB RAM and around 2GB swap.

To list out processes (similar to ps output) of all nodes for cluster ID 1, you can do:

$ s9s process --list --cluster-id=1
PID   USER   HOST     PR  VIRT      RES    S   %CPU   %MEM COMMAND
 2061 dba    10.0.0.3 20  5780688   459160 S  25.03  11.87 mysqld
 4623 dba    10.0.0.5 20  5700352   434852 S  23.87  11.24 mysqld
 4772 dba    10.0.0.4 20  5634564   430864 S  20.86  11.14 mysqld
  602 root   10.0.0.7 20  2331624    42436 S   8.73   1.10 cmon
  509 mysql  10.0.0.7 20  2613836   173688 S   0.66   4.49 mysqld
...

You can see there is another column called “HOST”, which represents the host where the process is running. This centralized view approach will surely save you time, so you do not have to get individual outputs for each node and then compare them.

Create database schema and user

Now we know our cluster is ready and healthy. We can then create a database schema:

$ s9s cluster --create-database --cluster-name='PXC_Cluster_57' --db-name=db1
Database 'db1' created.

The command below does the same thing but using the cluster ID as the cluster identifier instead:

$ s9s cluster --create-database --cluster-id=1 --db-name=db2
Database 'db2' created.

Then, create a database user associated with this database together with proper privileges:

$ s9s cluster --create-account --cluster-name='PXC_Cluster_57' --account='userdb1:password@10.0.0.%' --privileges='db1.*:SELECT,INSERT,UPDATE,DELETE,INDEX,CREATE'
Account 'userdb1' created.
Grant processed: GRANT SELECT, INSERT, UPDATE, DELETE, INDEX, CREATE ON db1.* TO 'userdb1'@'10.0.0.%'

You can now import or start to work with the database.

Take backups with mysqldump and Xtrabackup

Creating a backup is simple. You just need to decide which node to backup and the backup method. The storage location by default will be located on the controller node, unless you specify the --on-node flag. If the backup destination directory does not exist, ClusterControl will create it for you.

Backup completion time varies depending on the database size. It’s good to let the backup job run in the background:

$ s9s backup --create --backup-method=mysqldump --cluster-id=1 --nodes=10.0.0.5:3306 --backup-directory=/storage/backups
Job with ID 4 registered.

The ID for the backup job is 4. We can list all jobs by simply listing them out:

$ s9s job --list
ID CID STATE    OWNER  GROUP  CREATED  RDY  COMMENT
 1   0 FINISHED dba    users  06:19:33 100% Create Galera Cluster
 2   1 FINISHED system admins 06:33:48 100% Galera Node Recovery
 3   1 FINISHED system admins 06:36:04 100% Galera Node Recovery
 4   1 RUNNING3 dba    users  07:21:30   0% Create Backup
Total: 4

The job list tells us that there is a running job with state RUNNING3 (job is running on thread #3). You can then attach to this job if you would like to monitor the progress:

$ s9s job --wait --job-id=4
Create Backup
\ Job  4 RUNNING3   [    █     ] ---% Job is running

Or, inspect the job messages using the --log flag:

$ s9s job --log --job-id=4
10.0.0.5:3306: Preparing for backup - host state (MYSQL_OK) is acceptable.
10.0.0.7: creating backup dir: /storage/backups/BACKUP-1
10.0.0.5:3306: detected version 5.7.17-13-57.
Extra-arguments be passed to mysqldump:  --set-gtid-purged=OFF
10.0.0.7: Starting nc -dl 9999 > /storage/backups/BACKUP-1/mysqldump_2017-05-09_072135_mysqldb.sql.gz 2>/tmp/netcat.log.
10.0.0.7: nc started, error log: 10.0.0.7:/tmp/netcat.log.
Backup (mysqldump, storage controller): '10.0.0.5: /usr/bin/mysqldump --defaults-file=/etc/my.cnf --flush-privileges --hex-blob --opt   --set-gtid-purged=OFF  --single-transaction --skip-comments --skip-lock-tables --skip-add-locks --databases mysql |gzip  - | nc 10.0.0.7 9999'.
10.0.0.5: MySQL >= 5.7.6 detected, enabling 'show_compatibility_56'
A progress message will be written every 1 minutes
...

The same applies to xtrabackup. Just change the backup method accordingly. The supported values are xtrabackupfull (full backup) and xtrabackupincr (incremental backup):

$ s9s backup --create --backup-method=xtrabackupfull --cluster-id=1 --nodes=10.0.0.5:3306 --backup-directory=/storage/backups
Job with ID 6 registered.

Take note that an incremental backup requires that there is already a full backup made of the same databases (all or individually specified), else the incremental backup will be upgraded to a full backup.

You can then list out the backups created for this cluster:

$ s9s backup --list --cluster-id=1 --long --human-readable
ID CID STATE     OWNER HOSTNAME CREATED  SIZE FILENAME
 1   1 COMPLETED dba   10.0.0.5 07:21:39 252K mysqldump_2017-05-09_072135_mysqldb.sql.gz
 1   1 COMPLETED dba   10.0.0.5 07:21:43 1014 mysqldump_2017-05-09_072135_schema.sql.gz
 1   1 COMPLETED dba   10.0.0.5 07:22:03 109M mysqldump_2017-05-09_072135_data.sql.gz
 1   1 COMPLETED dba   10.0.0.5 07:22:07  679 mysqldump_2017-05-09_072135_triggerseventsroutines.sql.gz
 2   1 COMPLETED dba   10.0.0.5 07:30:20 252K mysqldump_2017-05-09_073016_mysqldb.sql.gz
 2   1 COMPLETED dba   10.0.0.5 07:30:24 1014 mysqldump_2017-05-09_073016_schema.sql.gz
 2   1 COMPLETED dba   10.0.0.5 07:30:44 109M mysqldump_2017-05-09_073016_data.sql.gz
 2   1 COMPLETED dba   10.0.0.5 07:30:49  679 mysqldump_2017-05-09_073016_triggerseventsroutines.sql.gz

Omit the “--cluster-id=1” option and to see the backup records for all your clusters.

Cluster and node operations

Performing a rolling restart (one node at a time) can be done with a single command line:

$ s9s cluster --rolling-restart --cluster-id=1 --wait
Rolling Restart
| Job  9 RUNNING    [███       ]  31% Stopping 10.0.0.4

For configuration management, we can get a list of configuration options defined inside a node’s my.cnf, and pipe the stdout to grep for filtering:

$ s9s node --list-config --nodes=10.0.0.3 | grep max_
MYSQLD      max_heap_table_size                    64M
MYSQLD      max_allowed_packet                     512M
MYSQLD      max_connections                        500
MYSQLD      wsrep_max_ws_rows                      131072
MYSQLD      wsrep_max_ws_size                      1073741824
mysqldump   max_allowed_packet                     512M

Let’s say we would like to reduce the max_connections. Then, we can use the “node” command option to perform the configuration update as shown in the following example:

$ s9s node --change-config --nodes=10.0.0.3 --opt-group=mysqld --opt-name=max_connections --opt-value=200
Variable 'max_connections' set to '200' and effective immediately.
Persisted change to configuration file /etc/my.cnf.
$ s9s node --change-config --nodes=10.0.0.4 --opt-group=mysqld --opt-name=max_connections --opt-value=200
Variable 'max_connections' set to '200' and effective immediately.
Persisted change to configuration file /etc/my.cnf.
$ s9s node --change-config --nodes=10.0.0.5 --opt-group=mysqld --opt-name=max_connections --opt-value=200
Variable 'max_connections' set to '200' and effective immediately.
Persisted change to configuration file /etc/my.cnf.

As stated in the job response, the changes are effective immediately. So it is not necessary to perform a node restart.

Scaling up and down

Adding a new database node is simple. First, setup a passwordless SSH to the new node:

(clustercontrol)$ ssh-copy-id 10.0.0.9

Then, specify the node’s IP address or hostname together with the cluster identifier (assume we want to add the node into a cluster with ID=2):

(client)$ s9s cluster --add-node --nodes=10.0.0.9 --cluster-id=2 --wait
Add Node to Cluster
| Job  9 FINISHED   [██████████] 100% Job finished.

To remove a node, one would do:

$ s9s cluster --remove-node --nodes=10.0.0.9 --cluster-id=2
Job with ID 10 registered.

Summary

ClusterControl CLI can be nicely integrated with your infrastructure automation tools. It opens a new way to interact and manipulate your databases. It is completely open source and available on GitHub. Go check it out!

Viewing all 210 articles
Browse latest View live