MariaDB Server and MariaDB Cluster are open source products powered by the MariaDB Corporation. MariaDB Server is one of the most popular relational databases, it was originally forked from MySQL server.
MariaDB Cluster is a high availability solution built from MariaDB Server, using a Galera Cluster wsrep library to synchronize the data between nodes. The replication method of Galera is synchronous (or ‘virtually synchronous’), ensuring the data will be the same on all the nodes.
MariaDB server can also be made highly available via standard replication. Replication can be asynchronous or semi-synchronous.
So how does the MariaDB server with standard replication differ from MariaDB Cluster with Galera Cluster? In this blog, we will compare those two. We will be using ClusterControl to illustrate some of the differences.
MariaDB Server Architecture
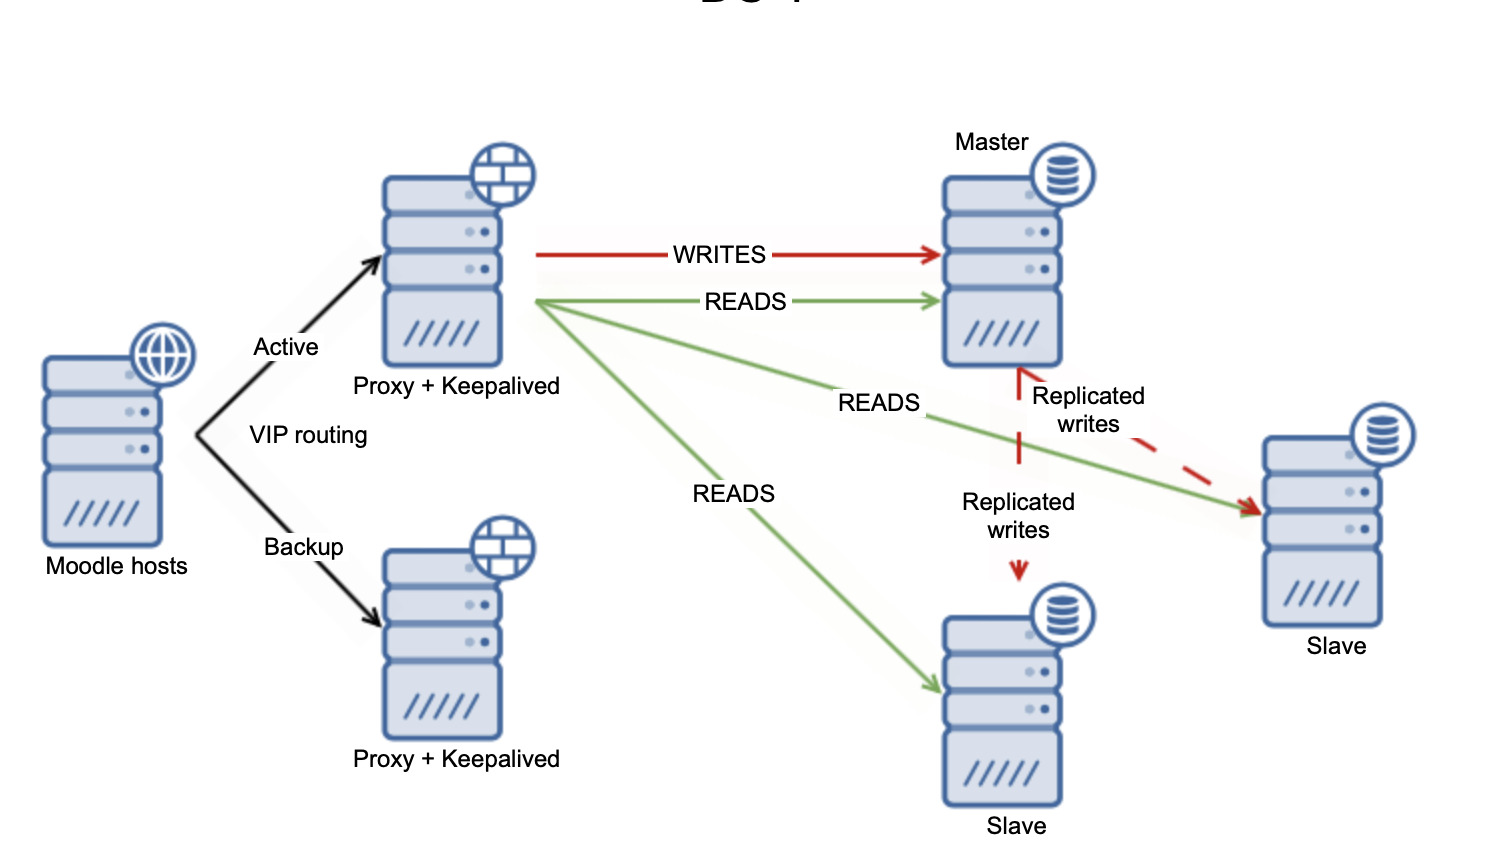
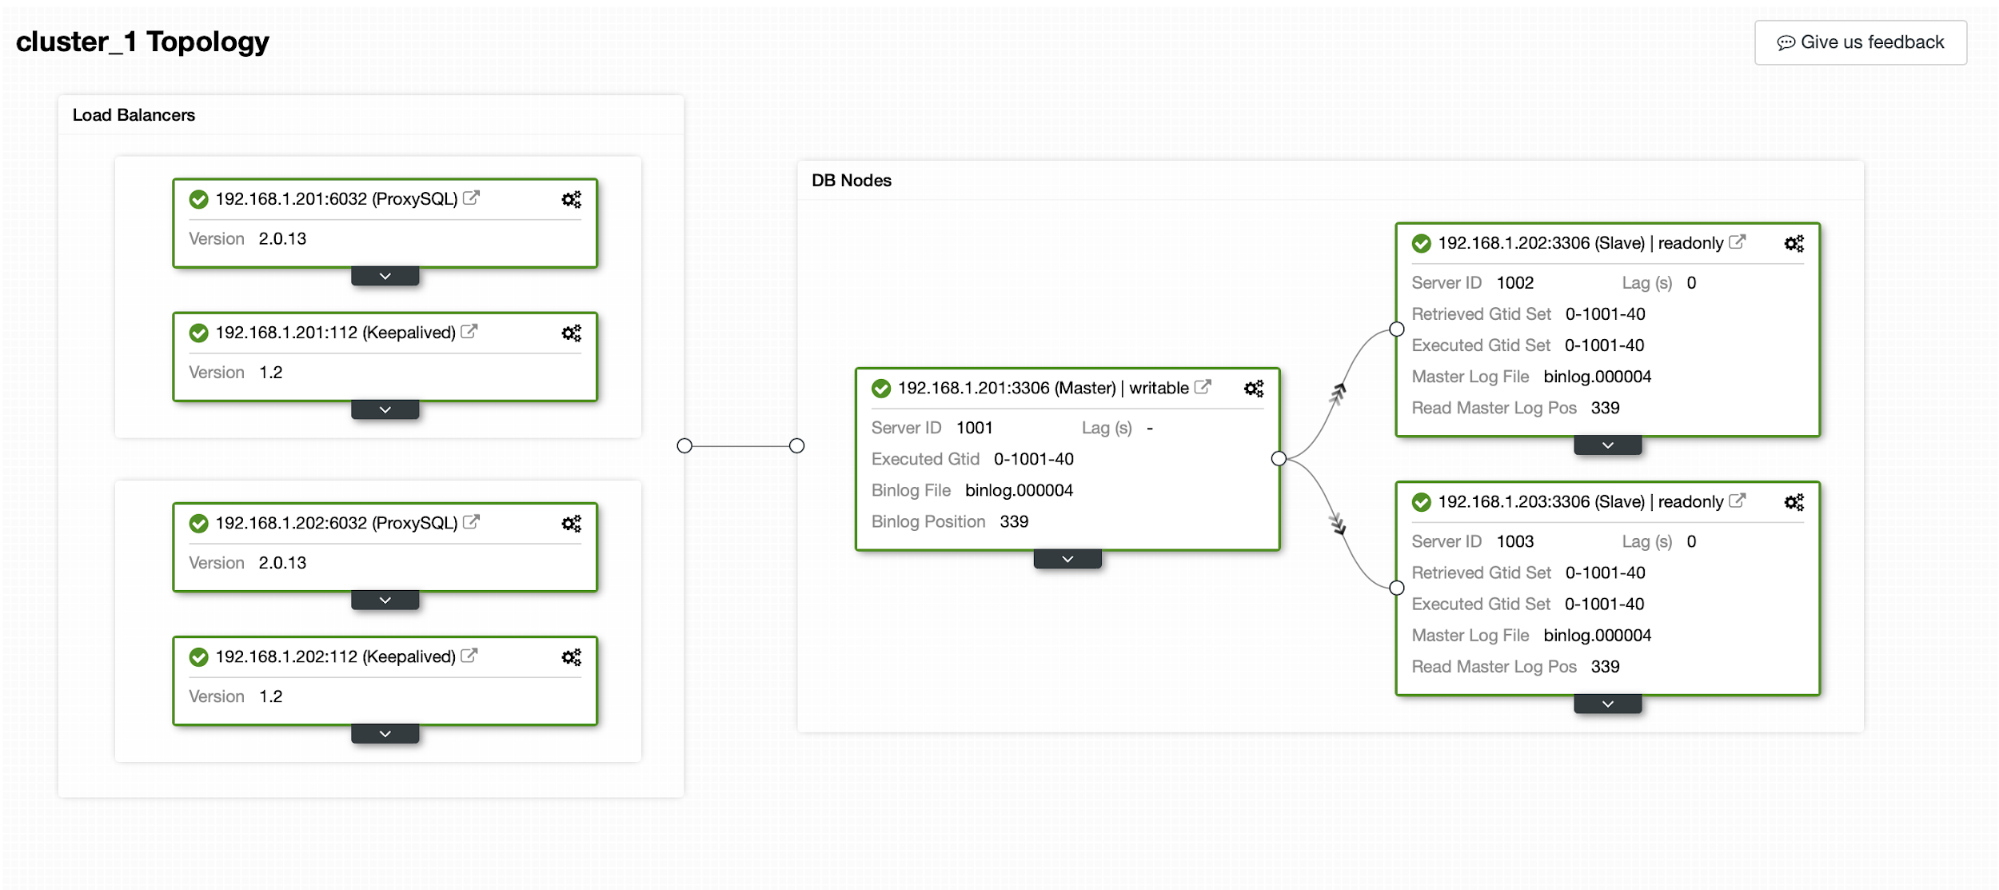
The architecture of MariaDB Server can be a single/standalone instance or master/slave replication as shown in the diagram below.

The MariaDB Server single instance architecture stands for one node only. The drawback of having a single instance is a single point of failure for the database. If your database crashes and does not come back up, you do not have any failover mechanism, and you need to do a restore to recover your database from the last backup.
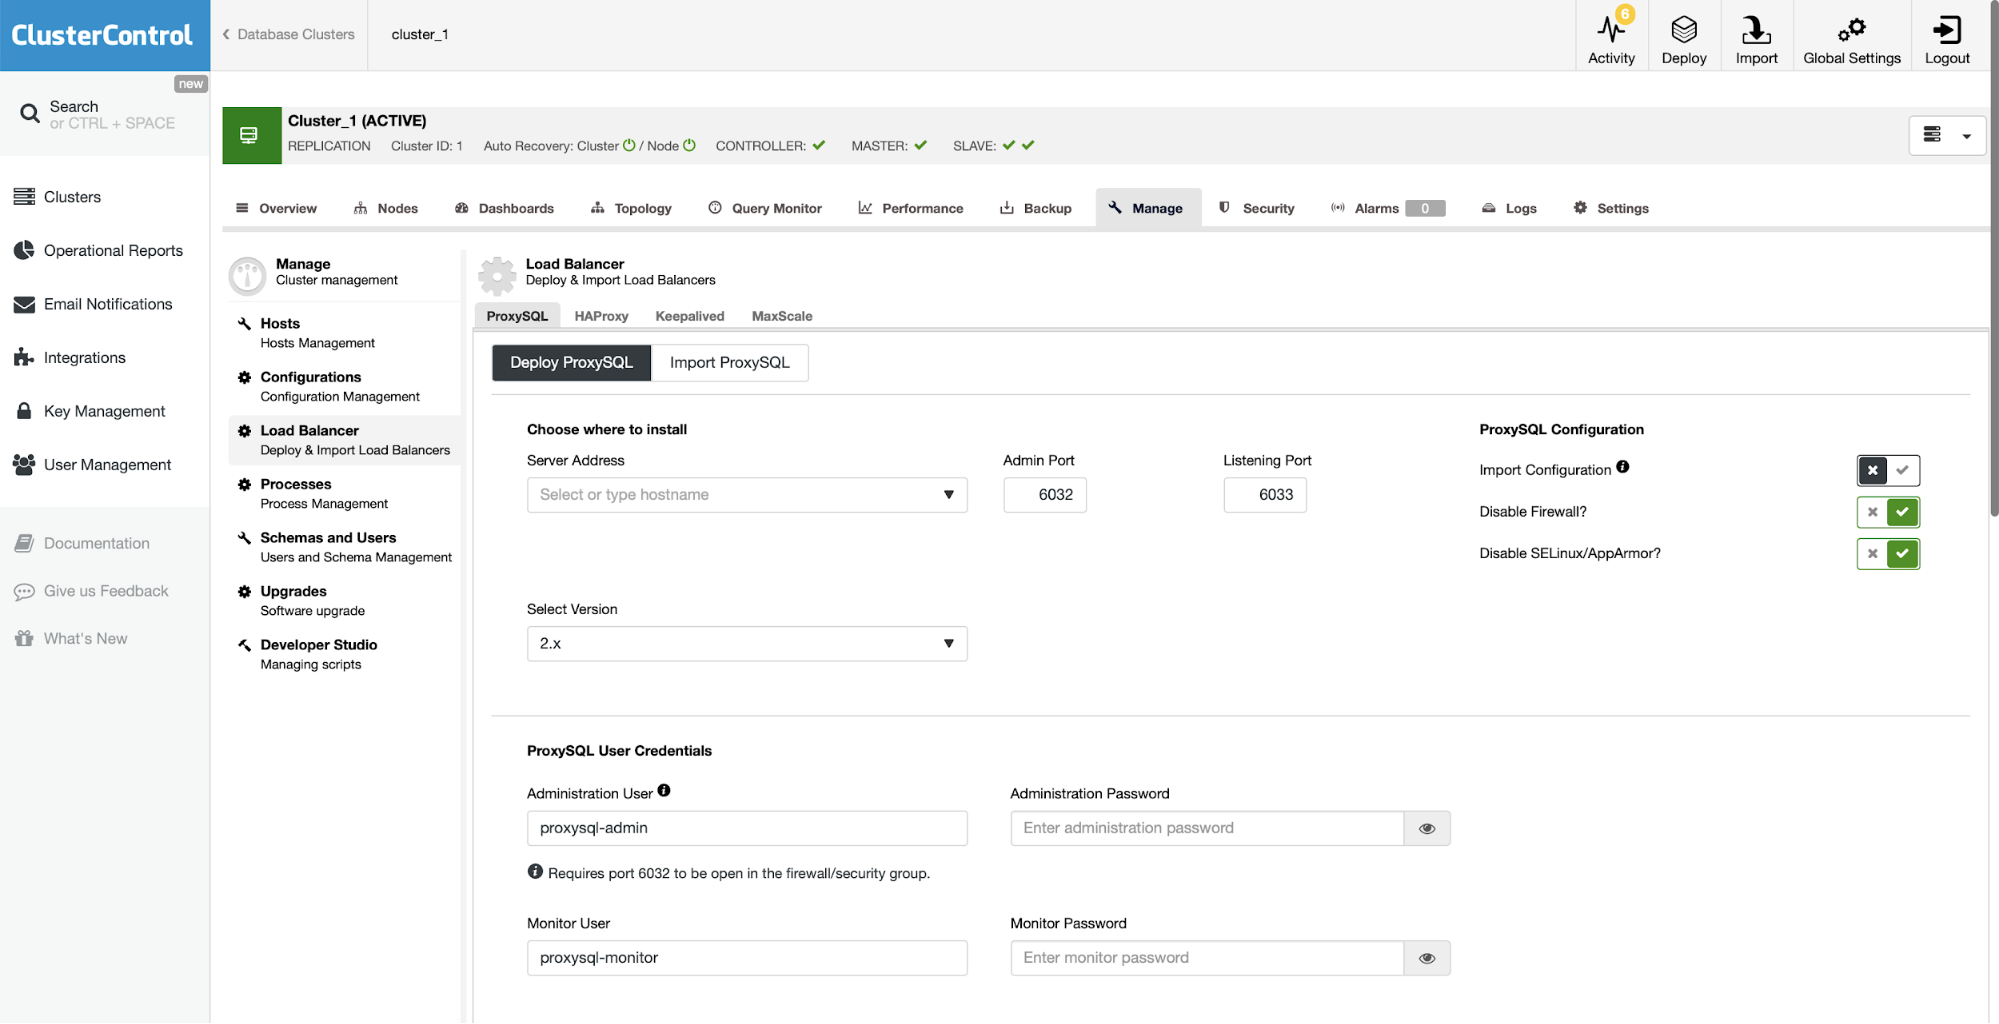
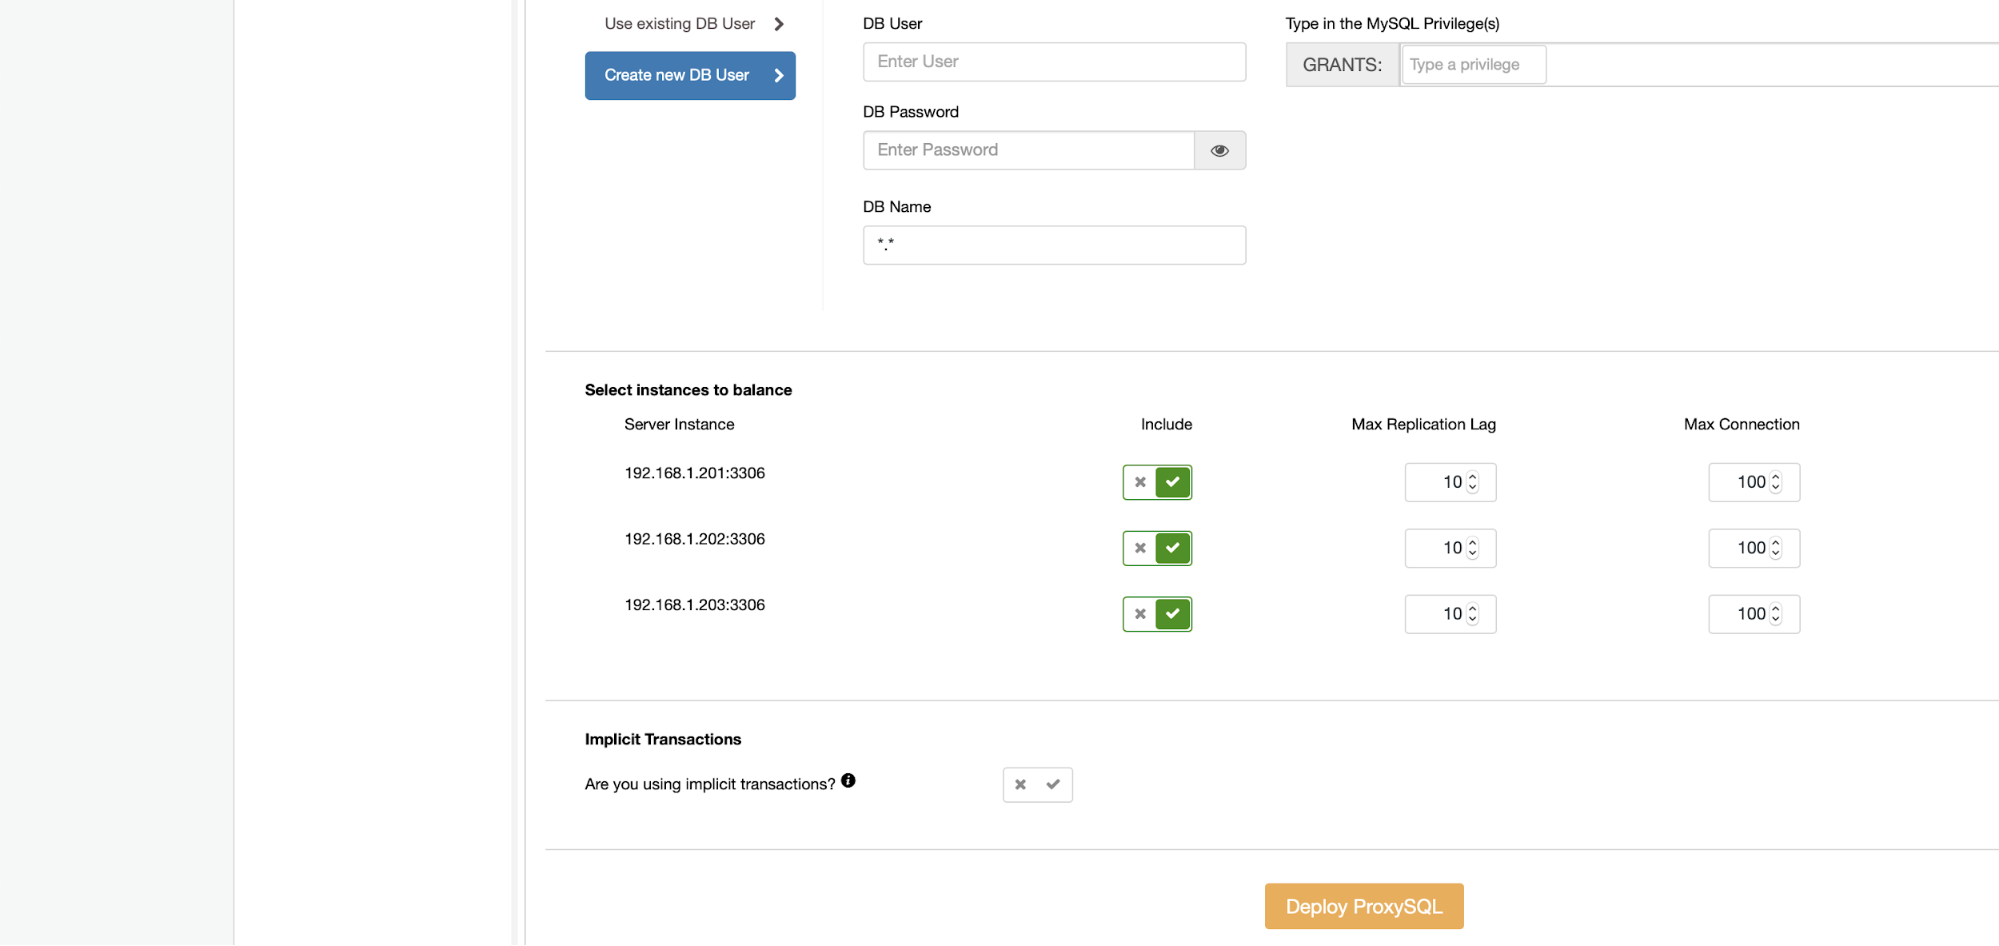
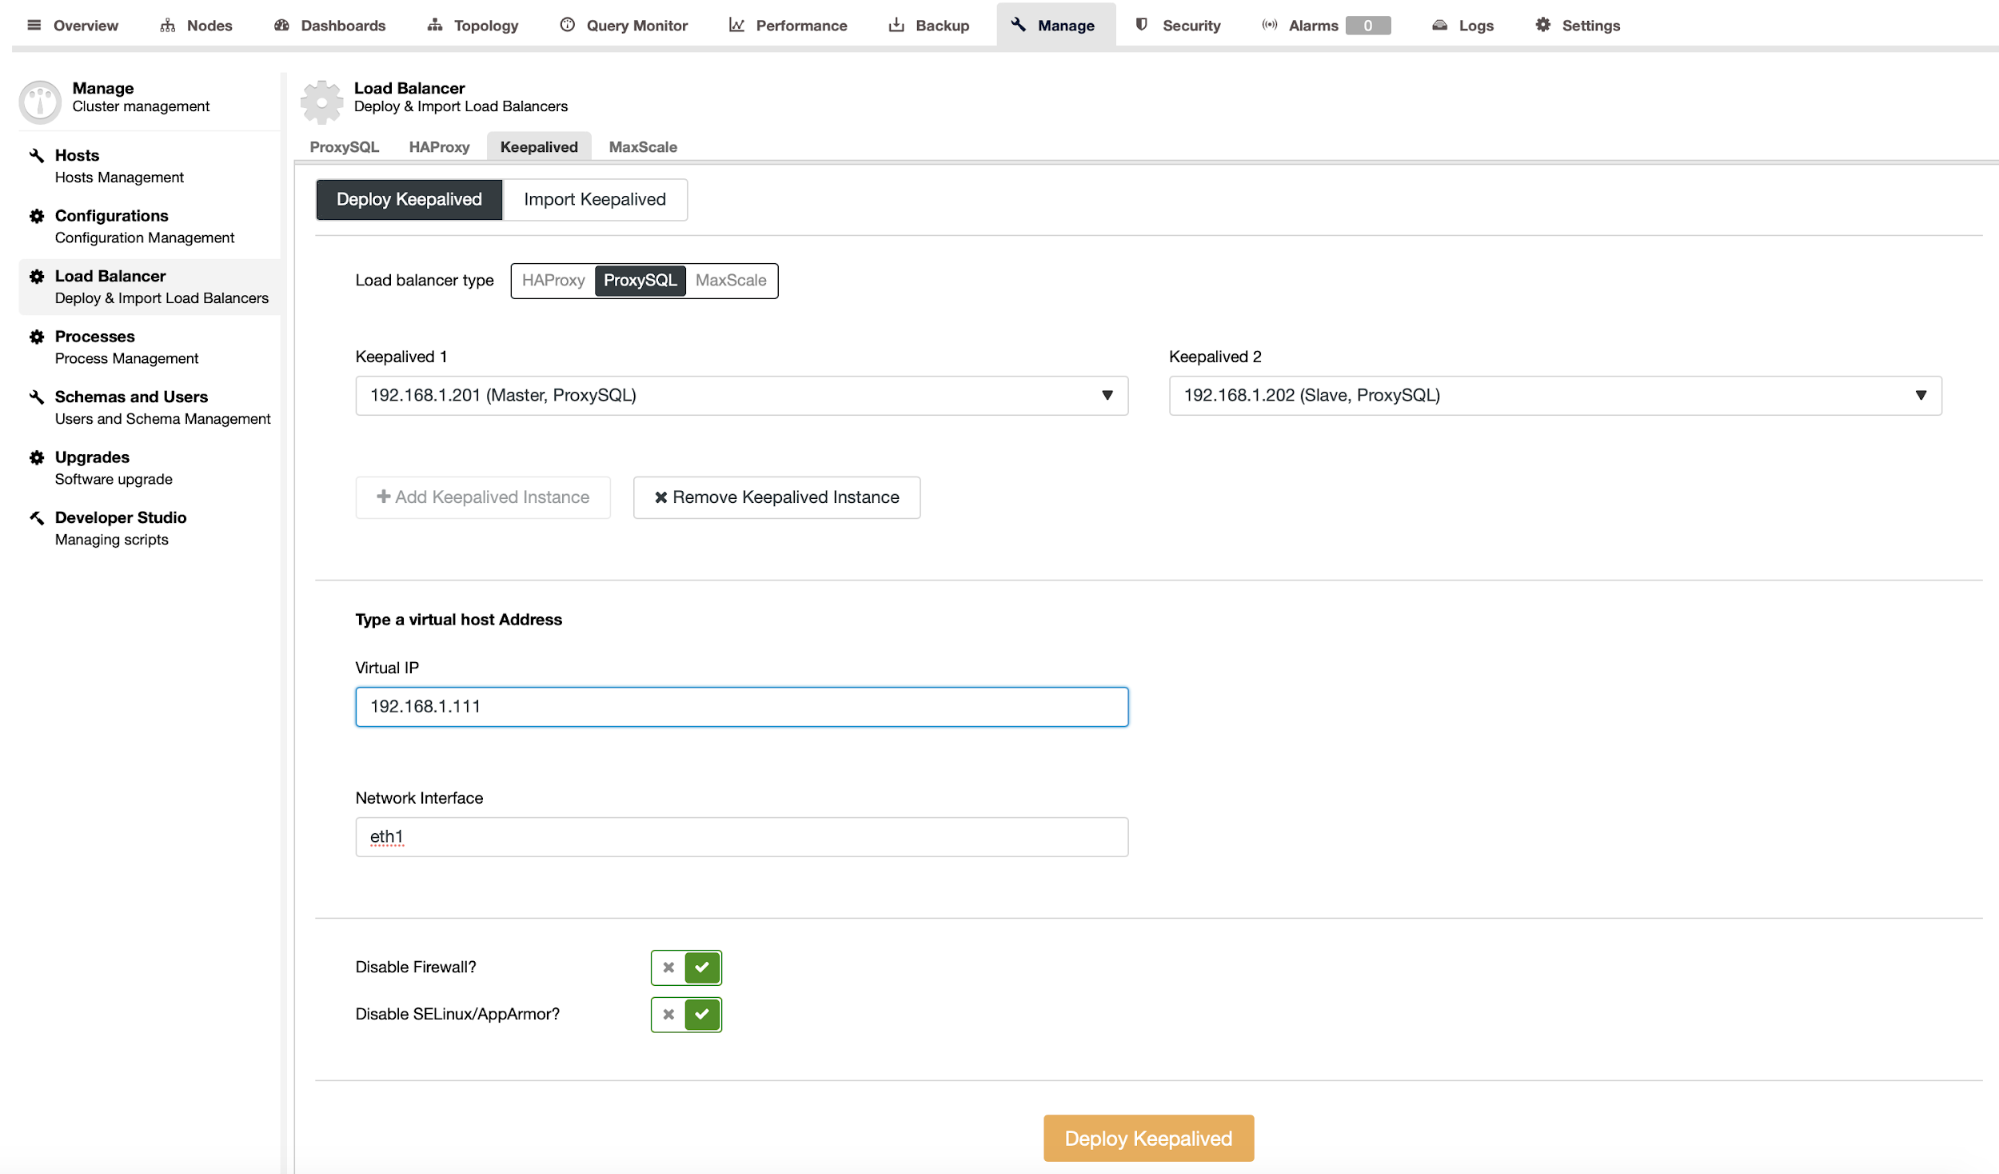
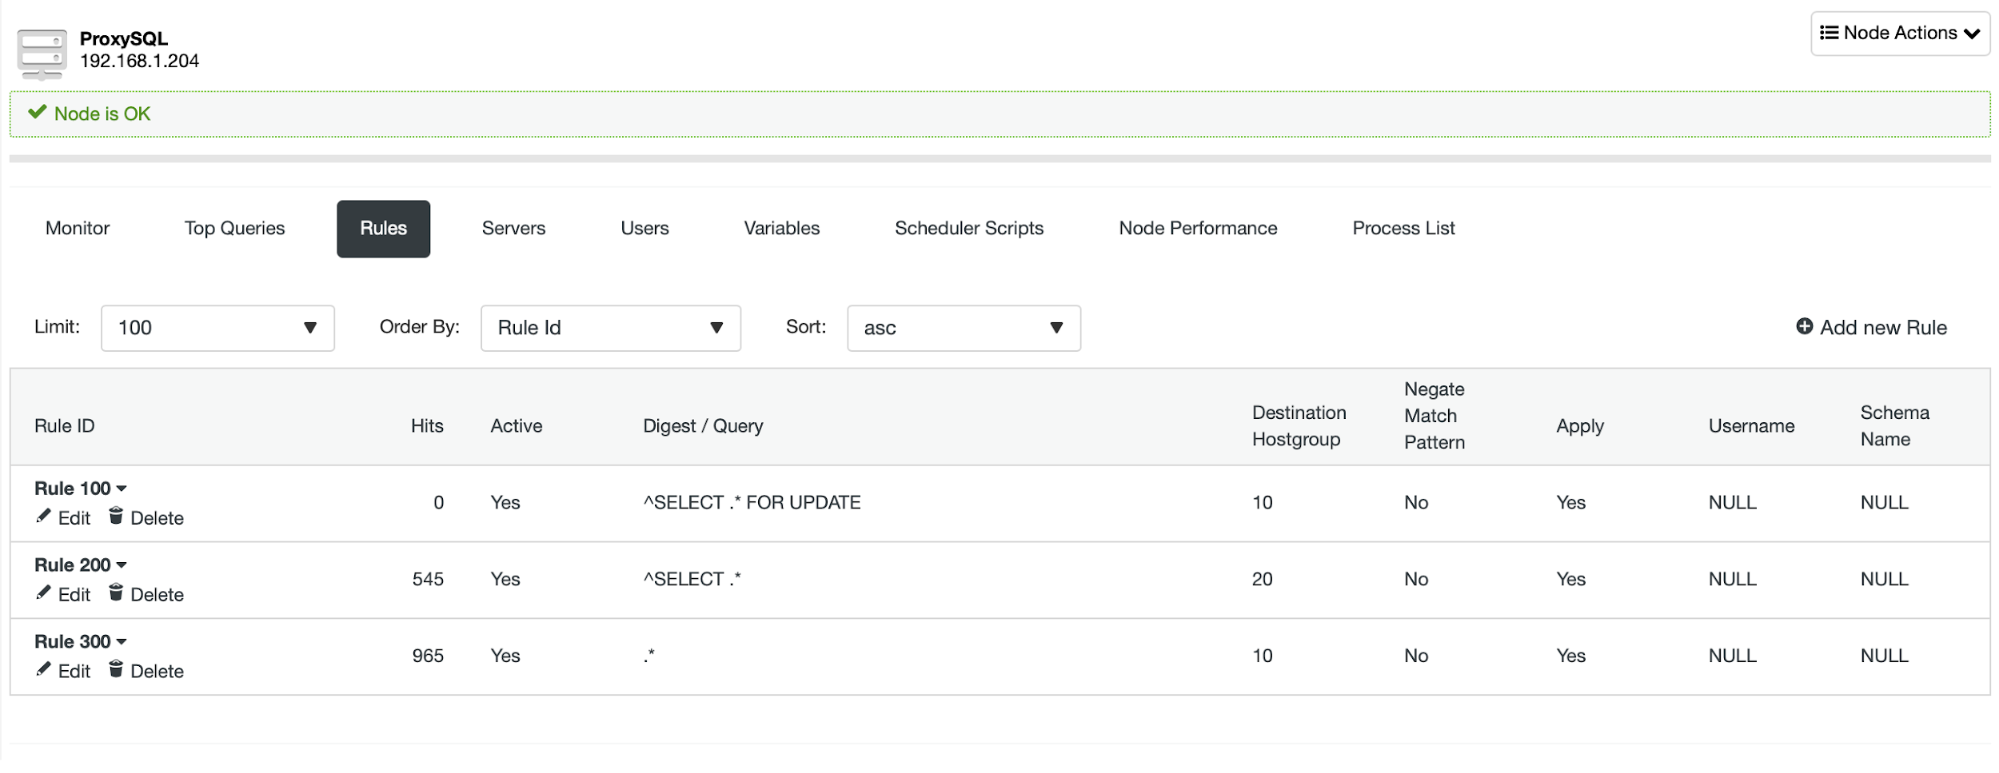
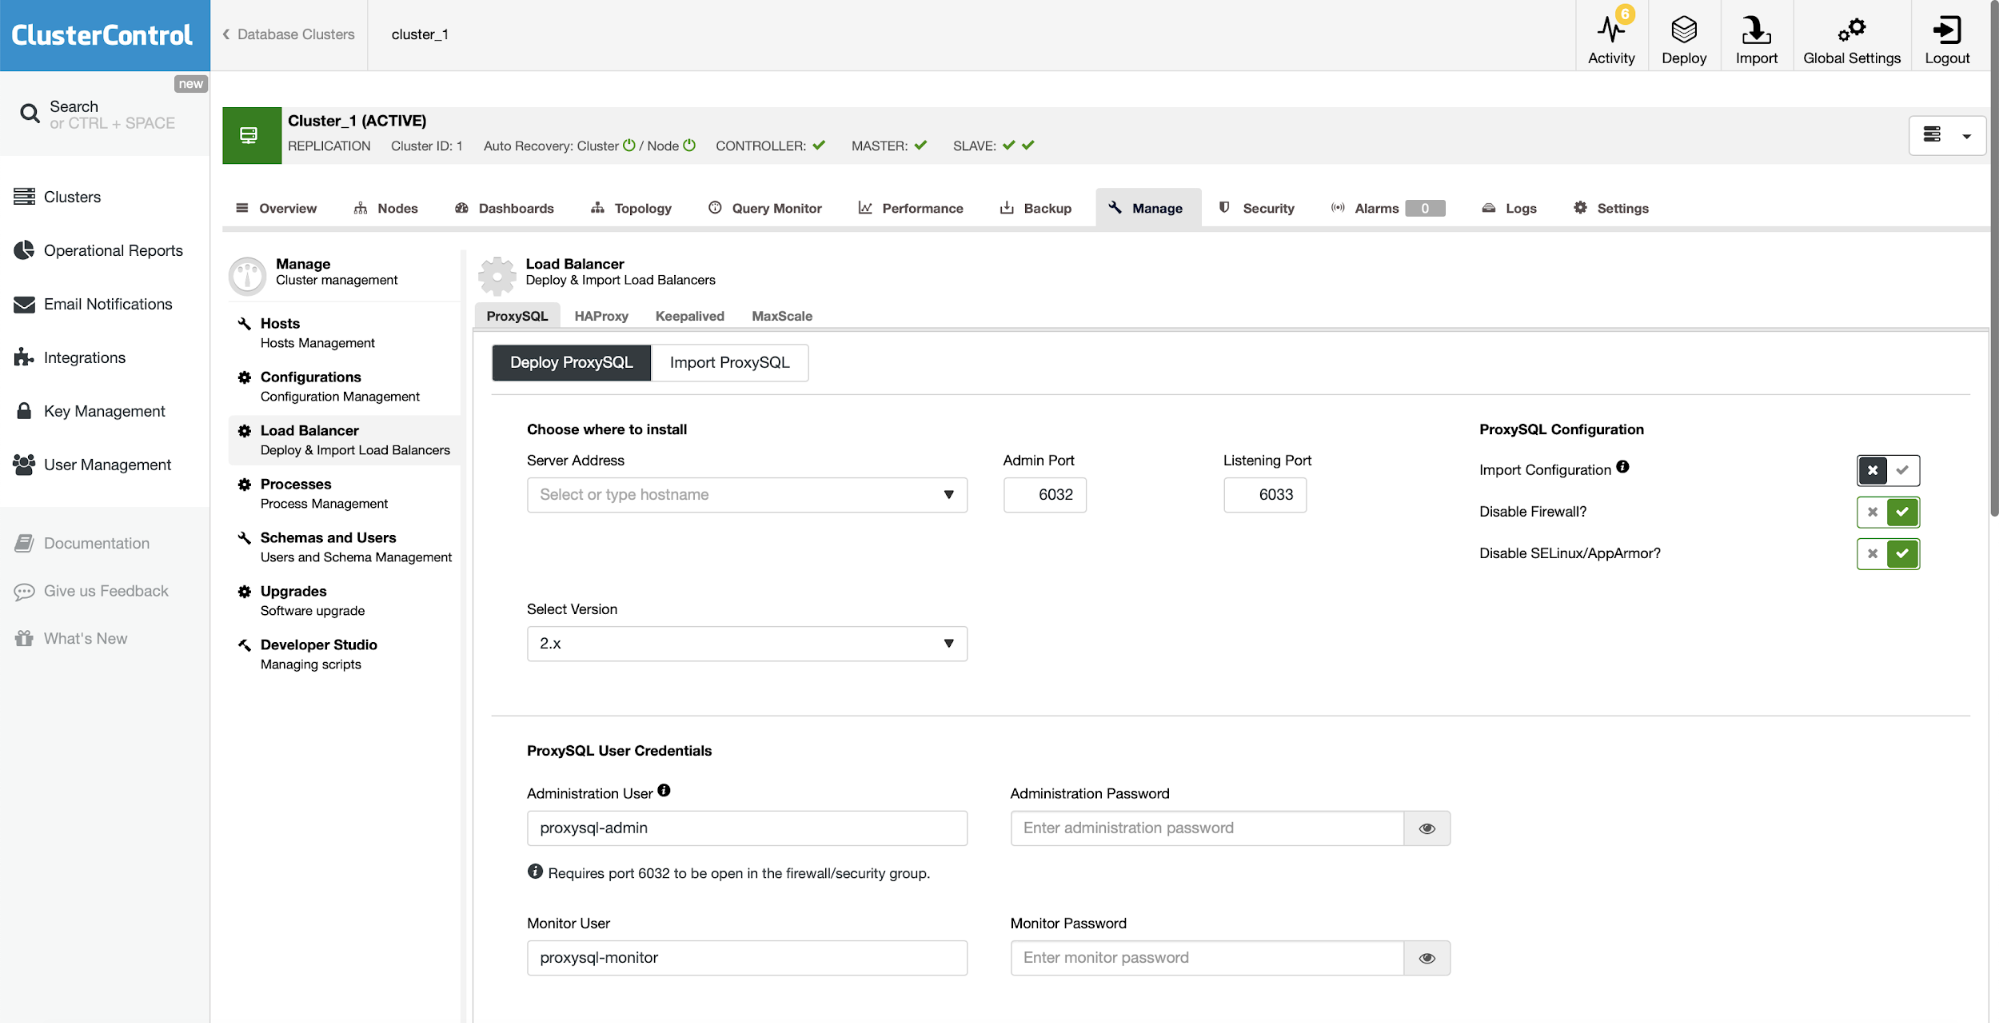
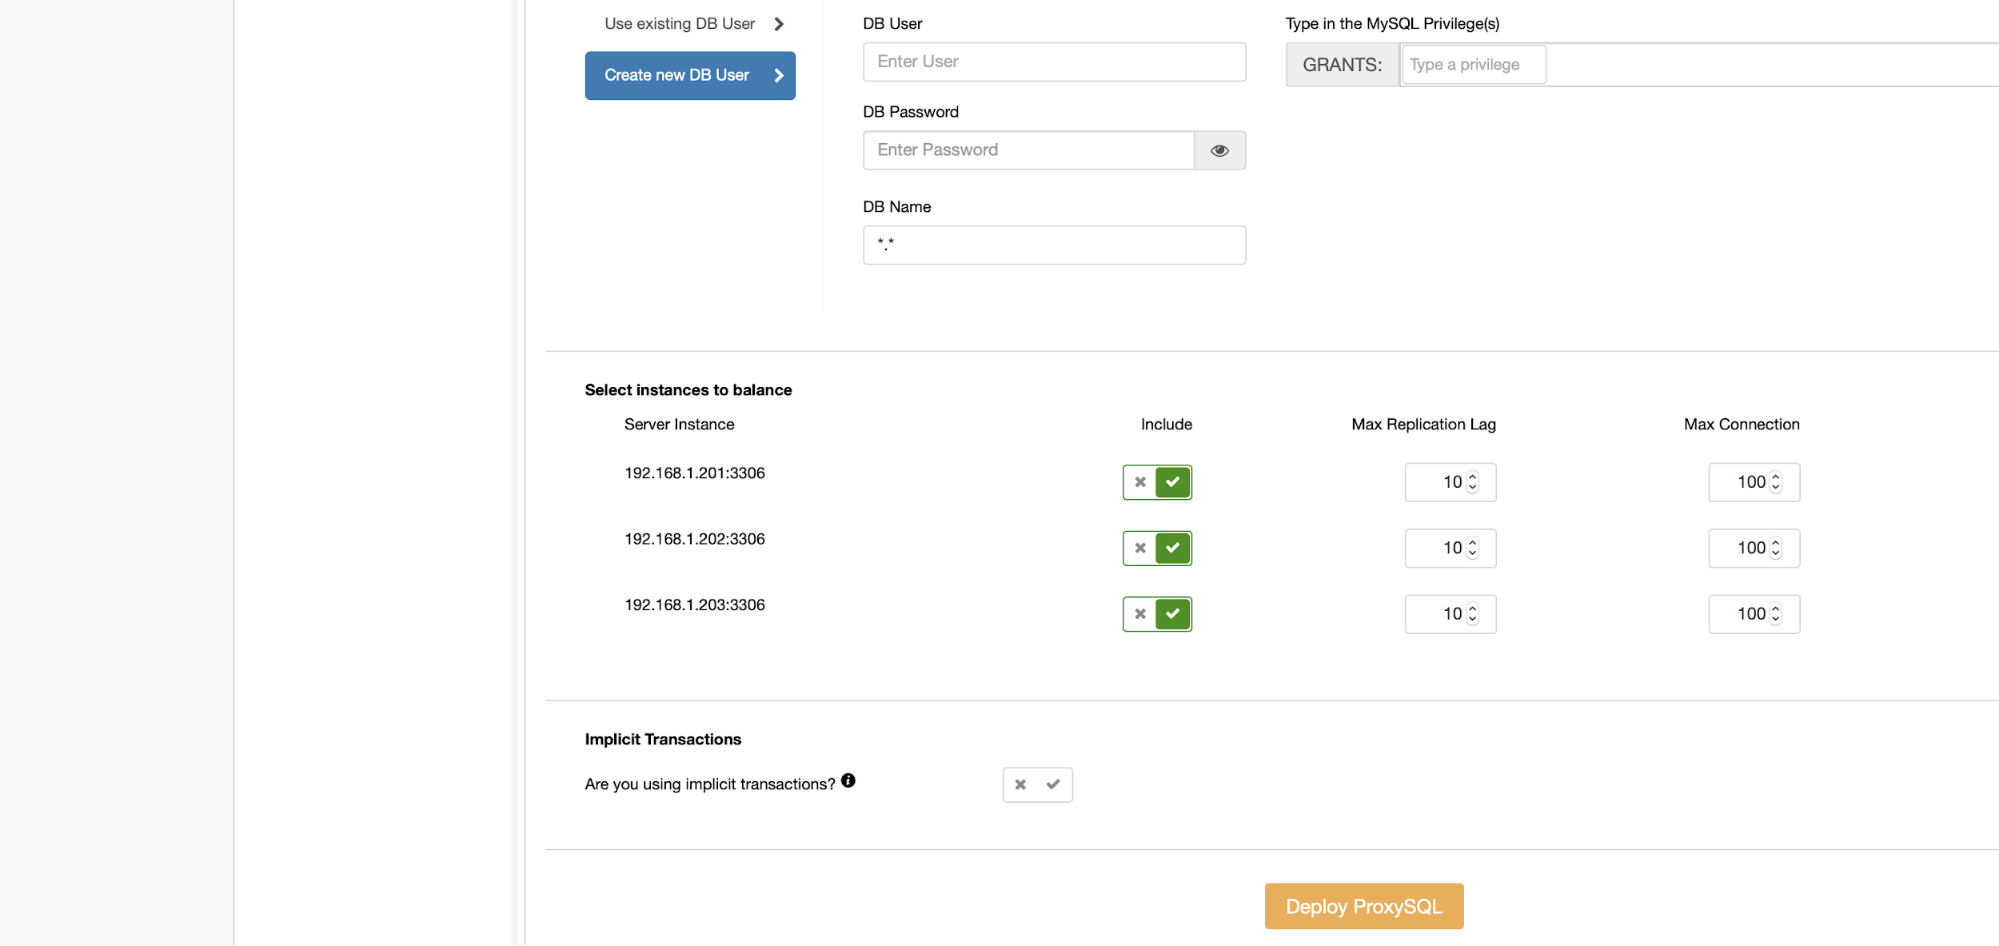
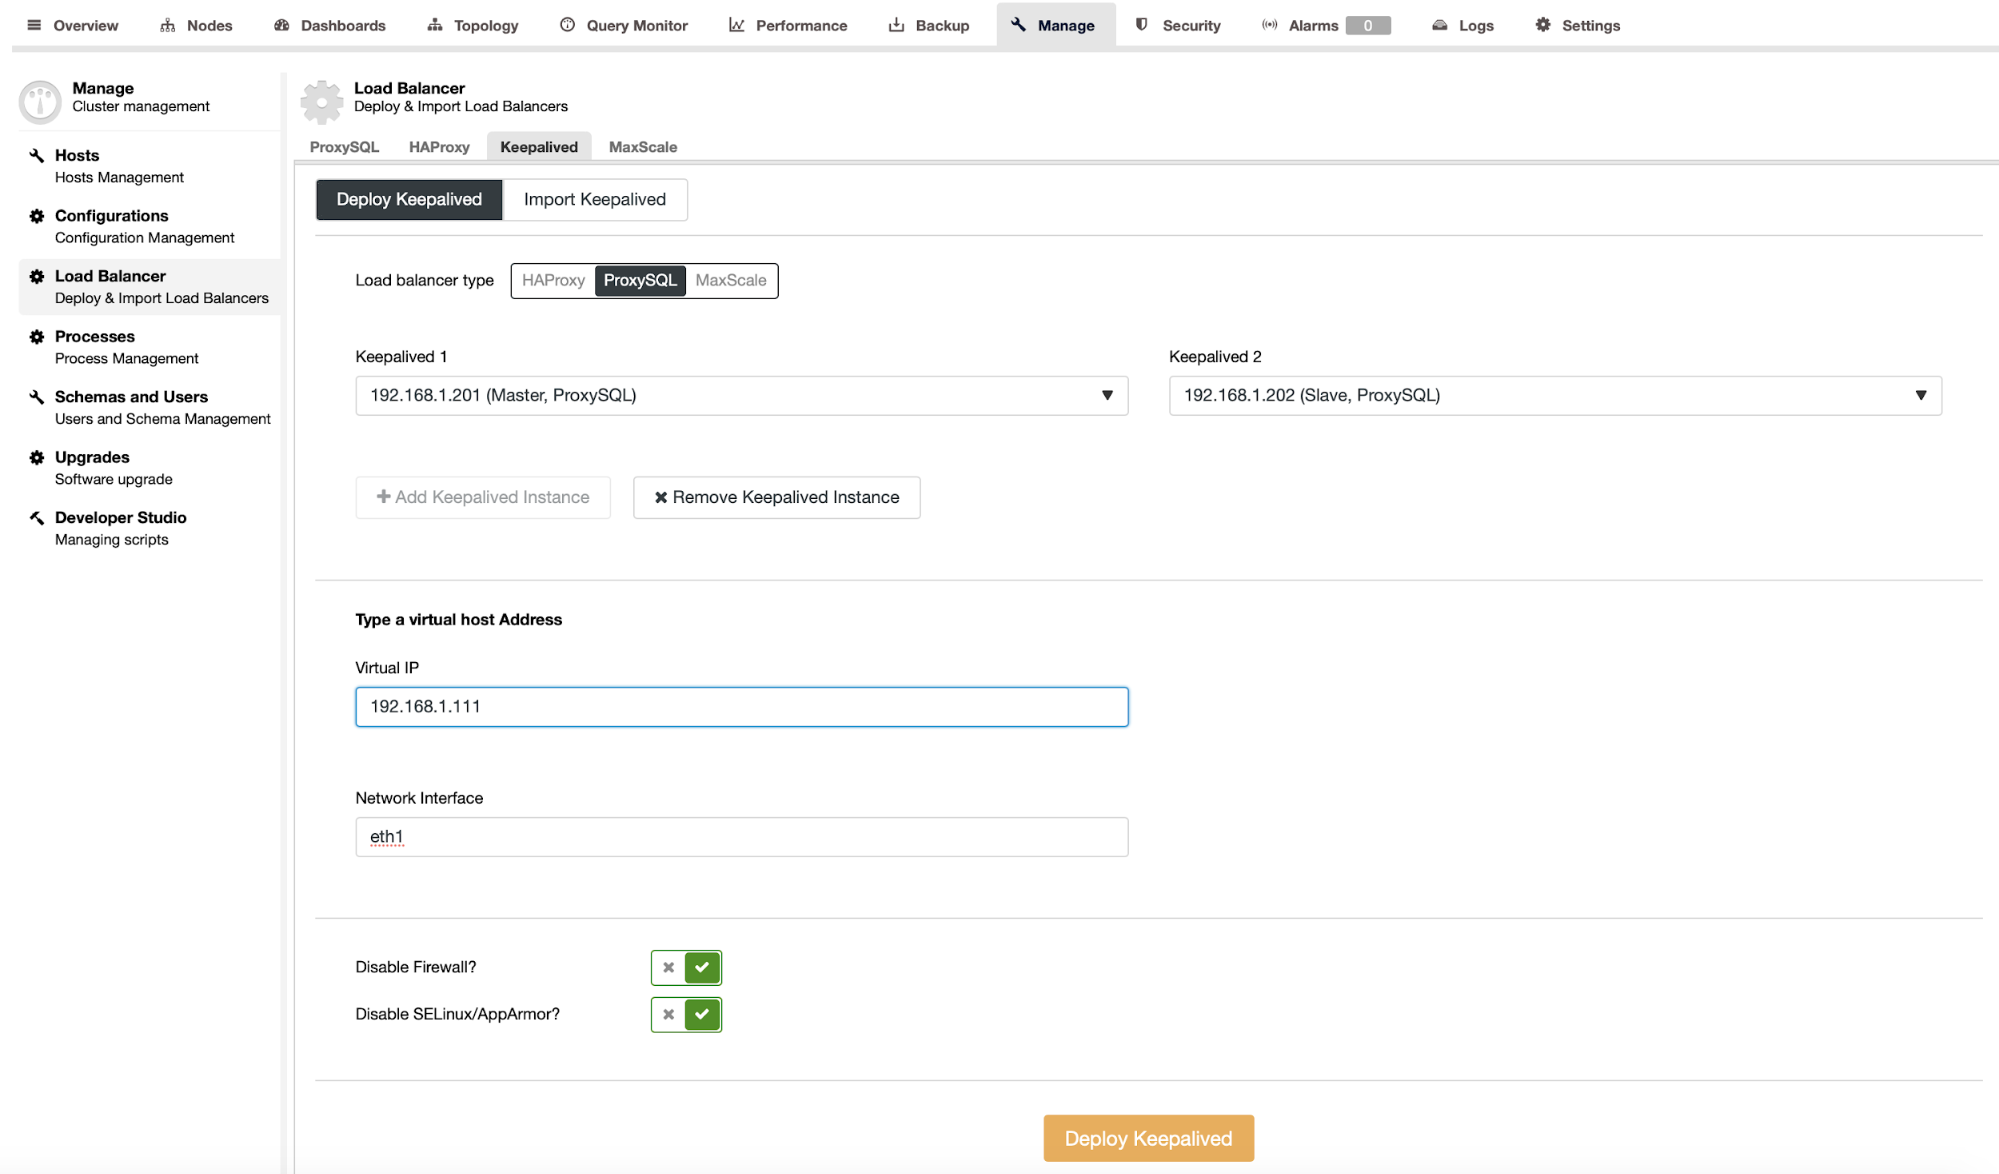
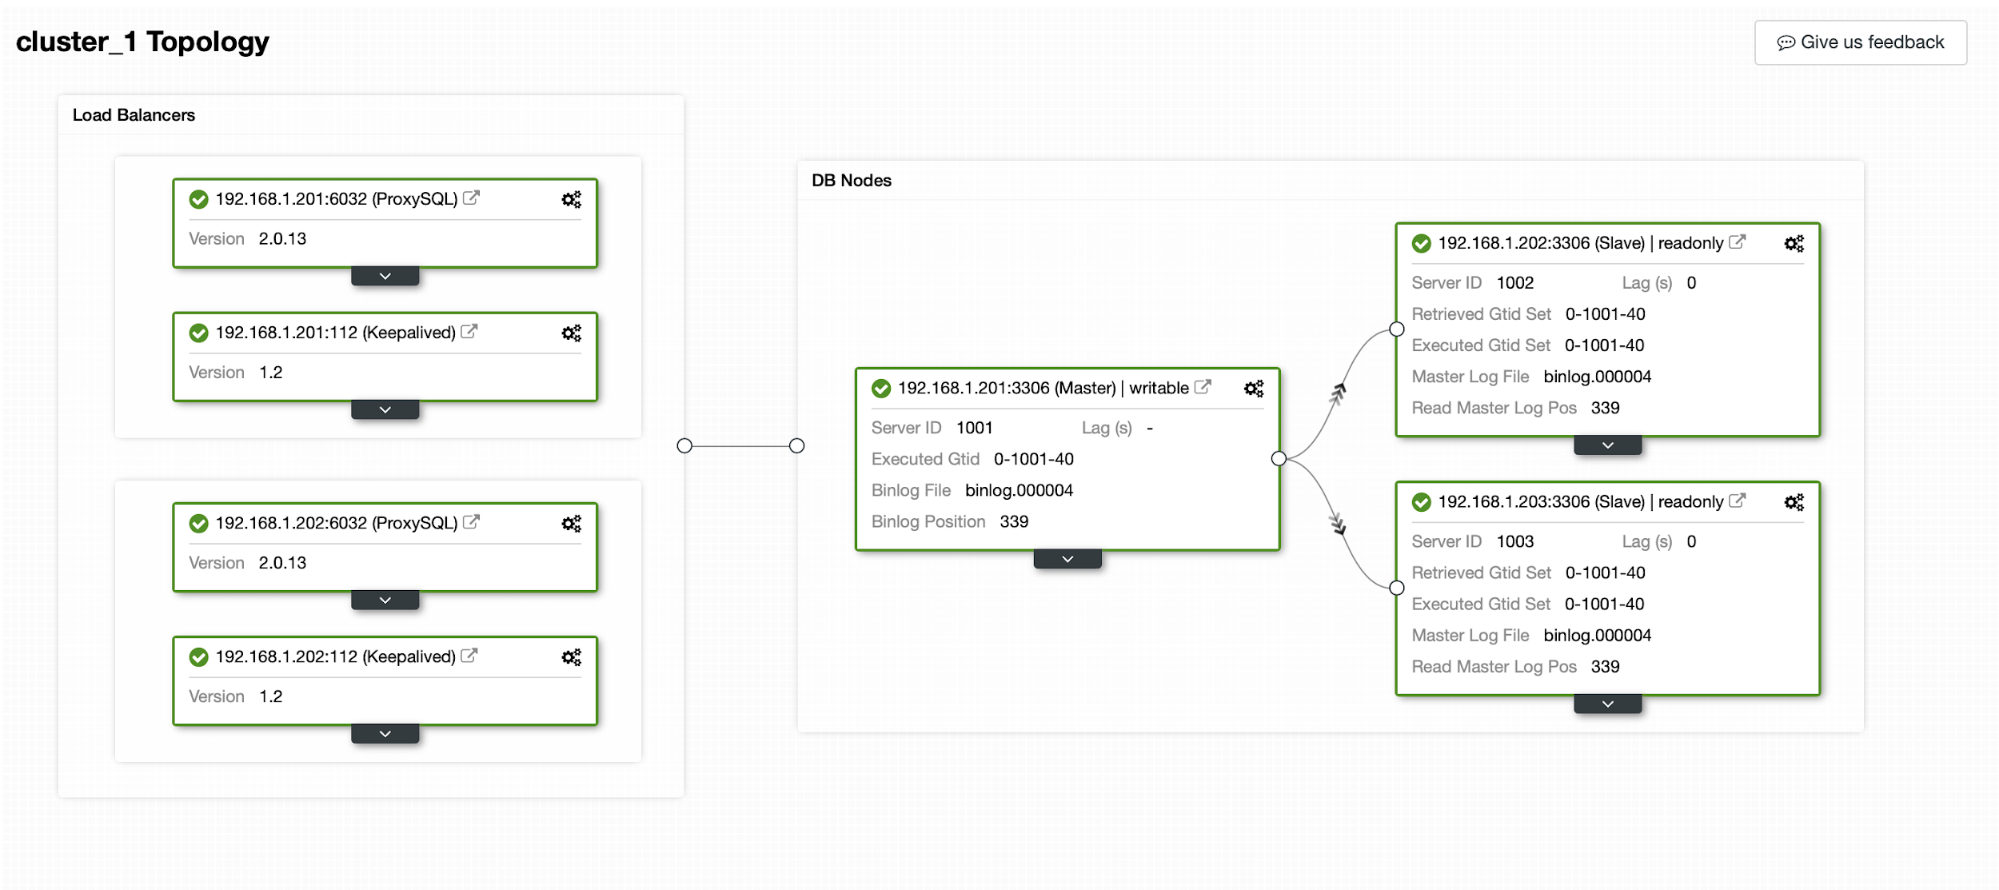
The master/slave architecture is a distributed setup, with the master acting as writer and the slave(s) as reader(s). Using a load balancer like Maxscale or ProxySQL, you can split the database traffic so that writes are sent to the master and reads to the slave(s). Having a replication setup will eliminate a single point of failure for the database, but you need to be able to failover automatically if the master fails. Or else, applications will not be able to write to the database and they will be affected. ClusterControl can be configured to provide automatic failover and recovery for MariaDB replication.
MariaDB Cluster Architecture
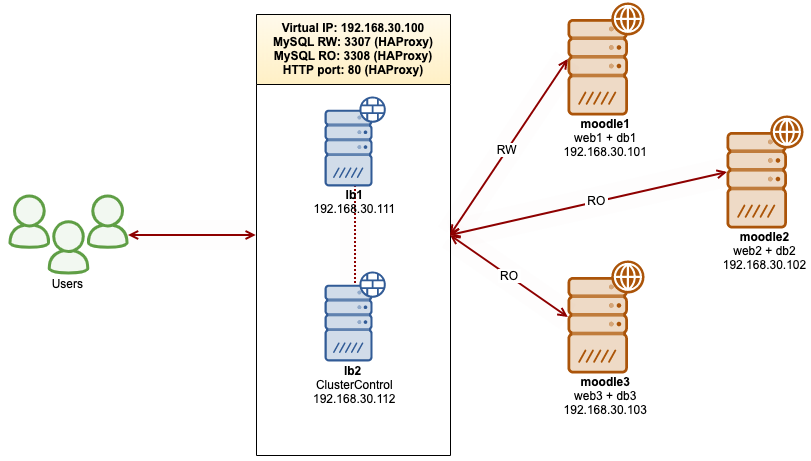
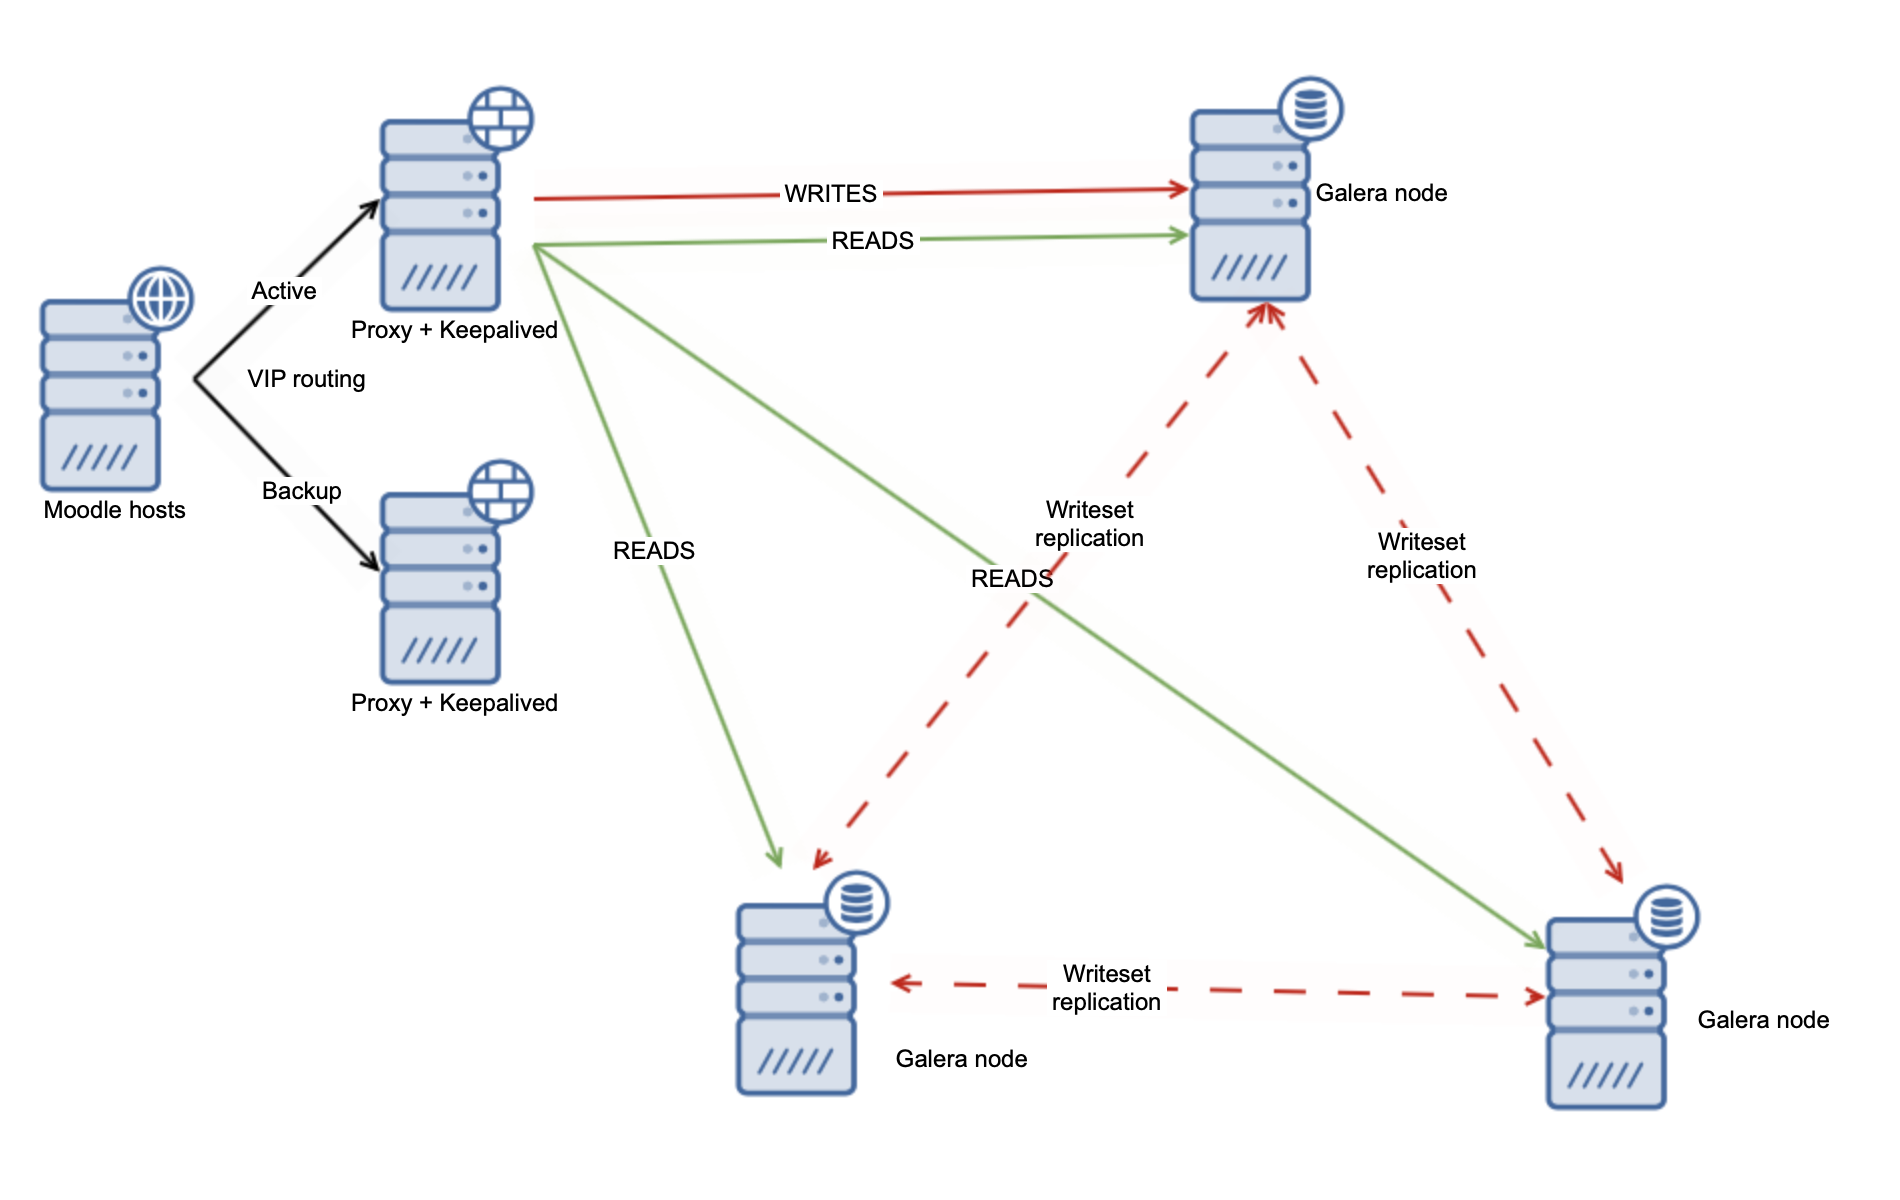
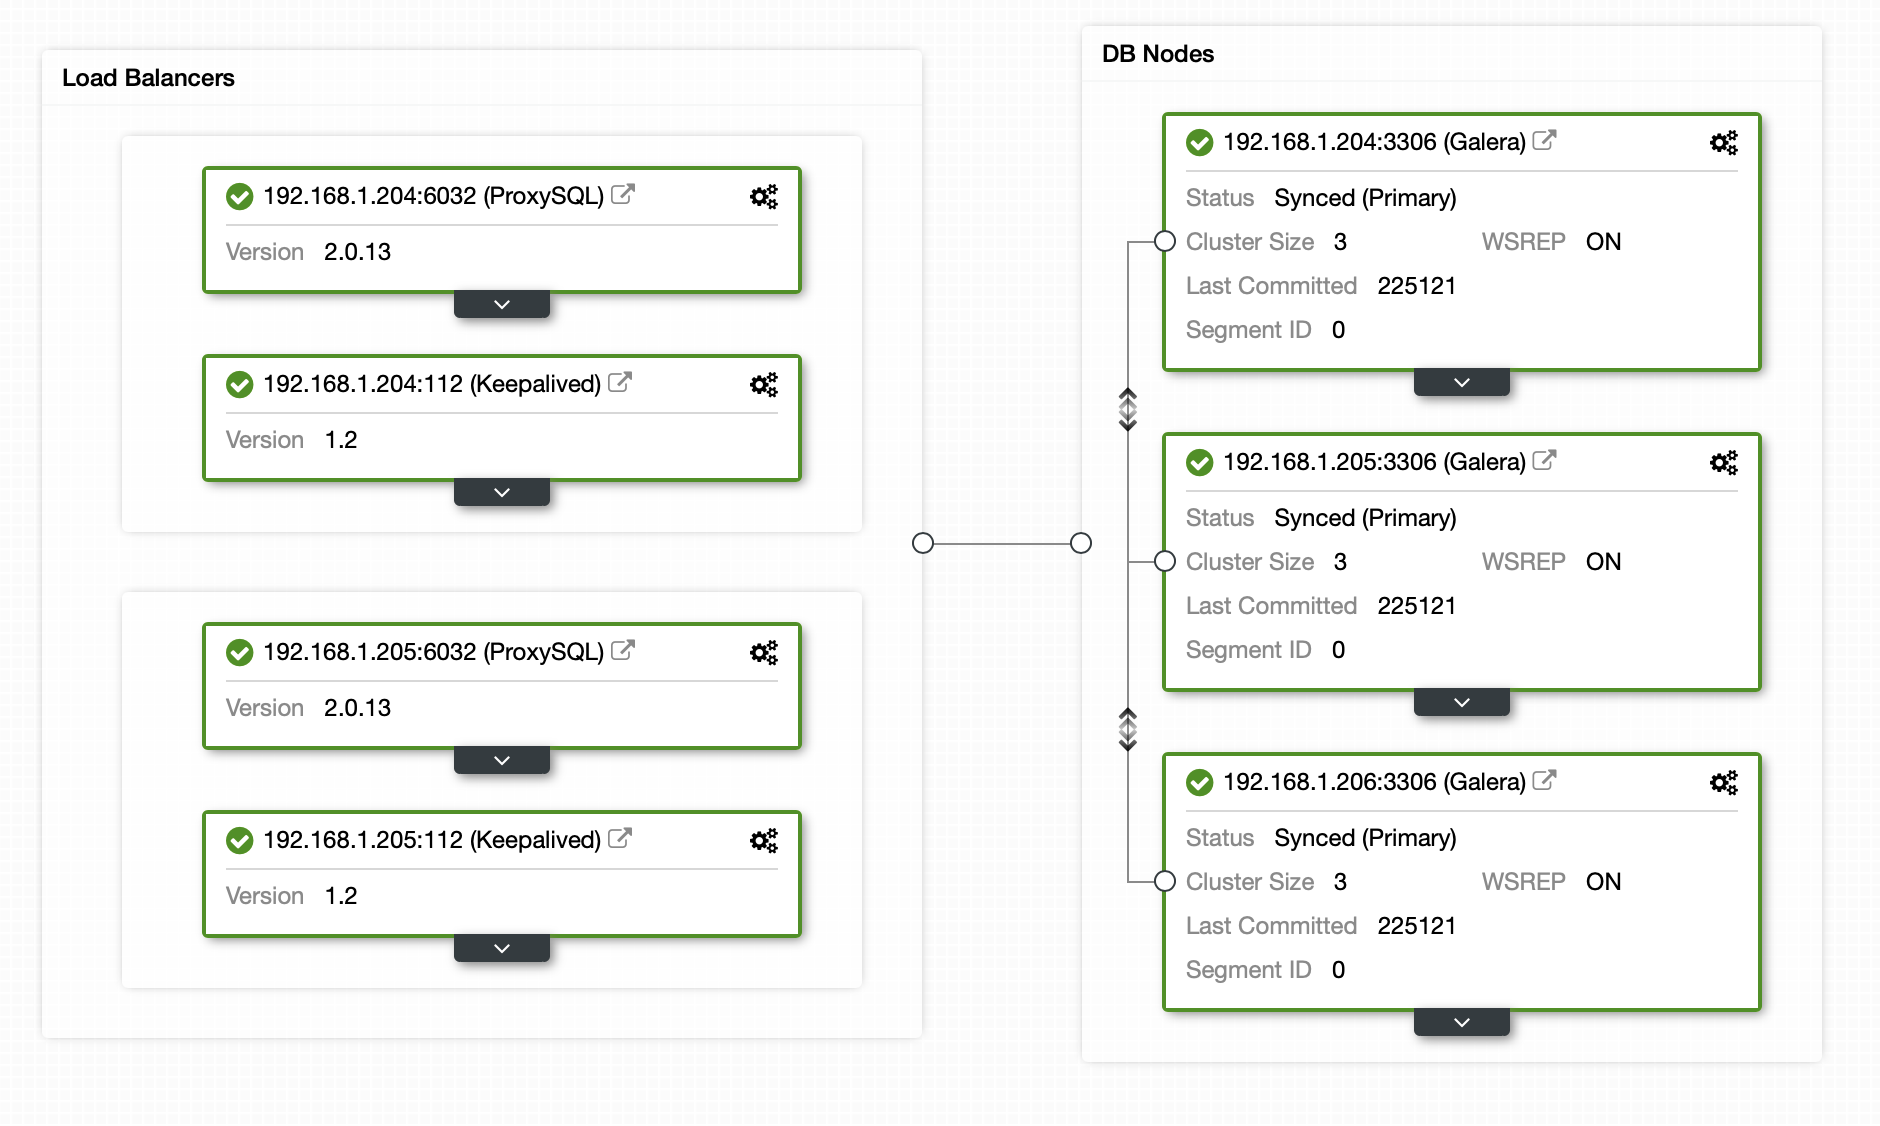
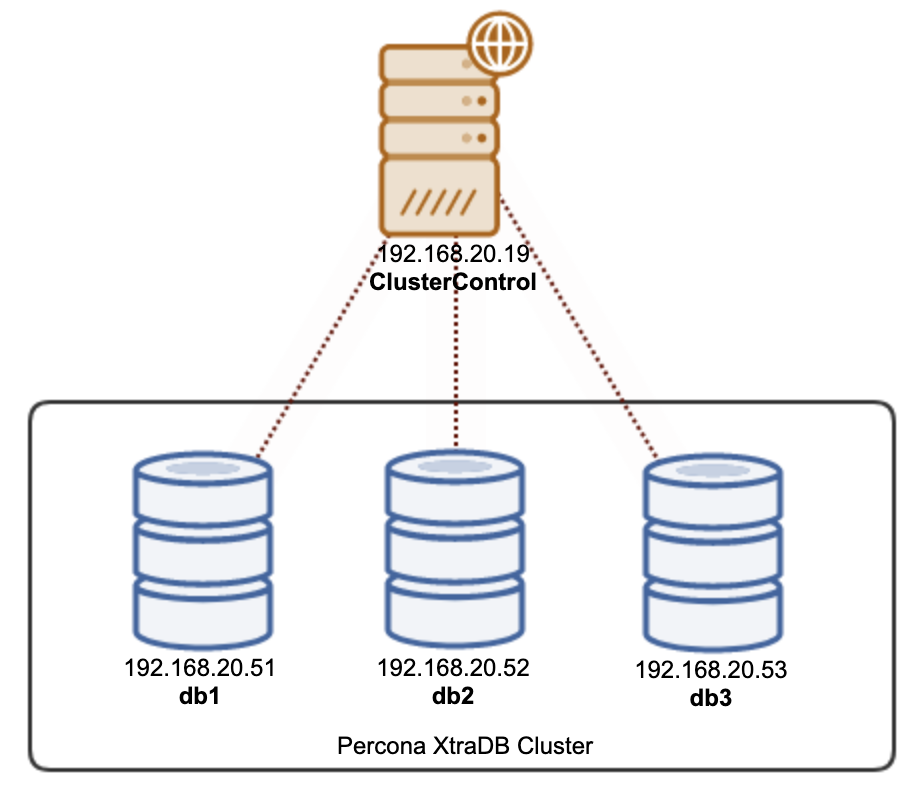
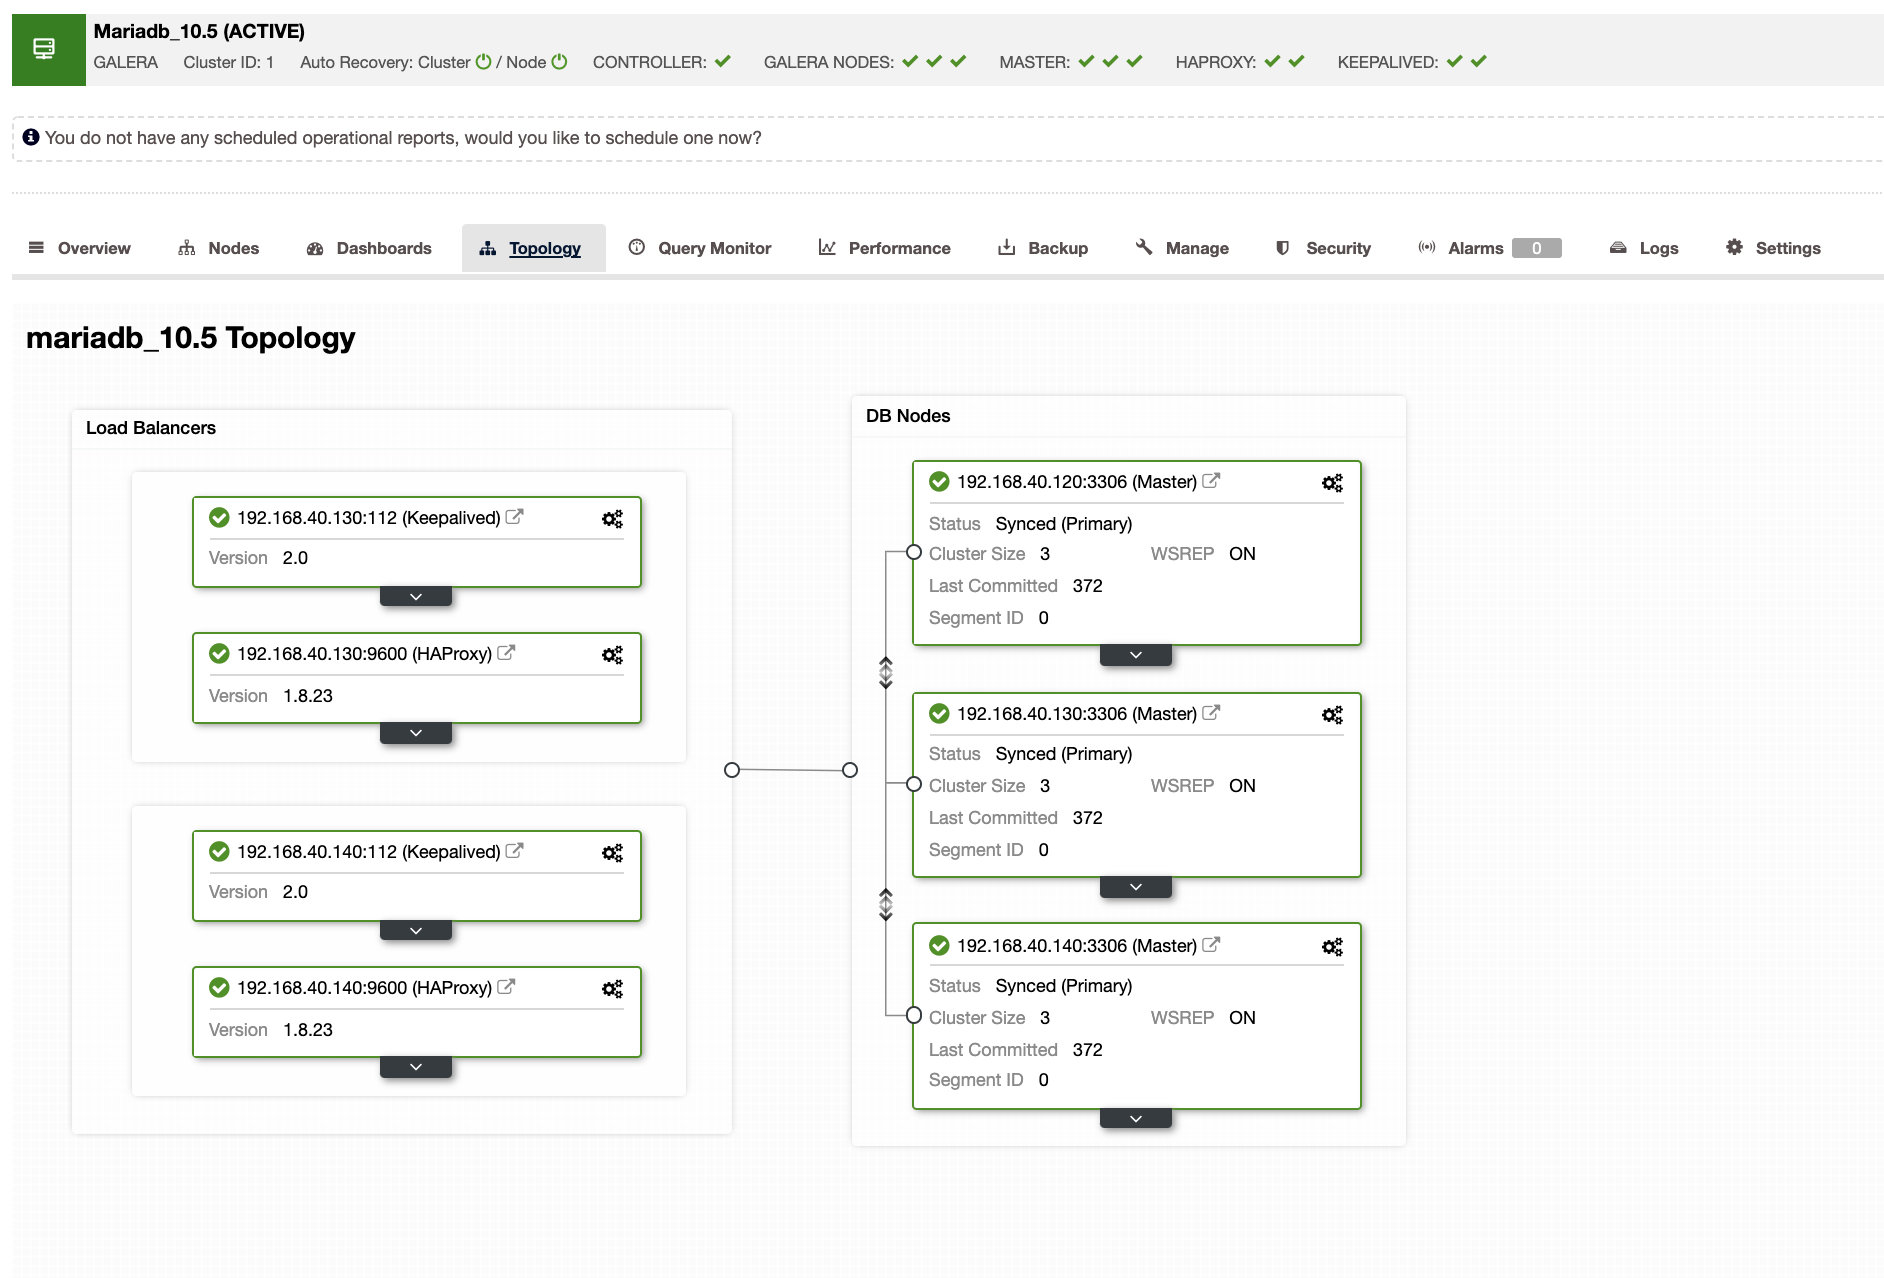
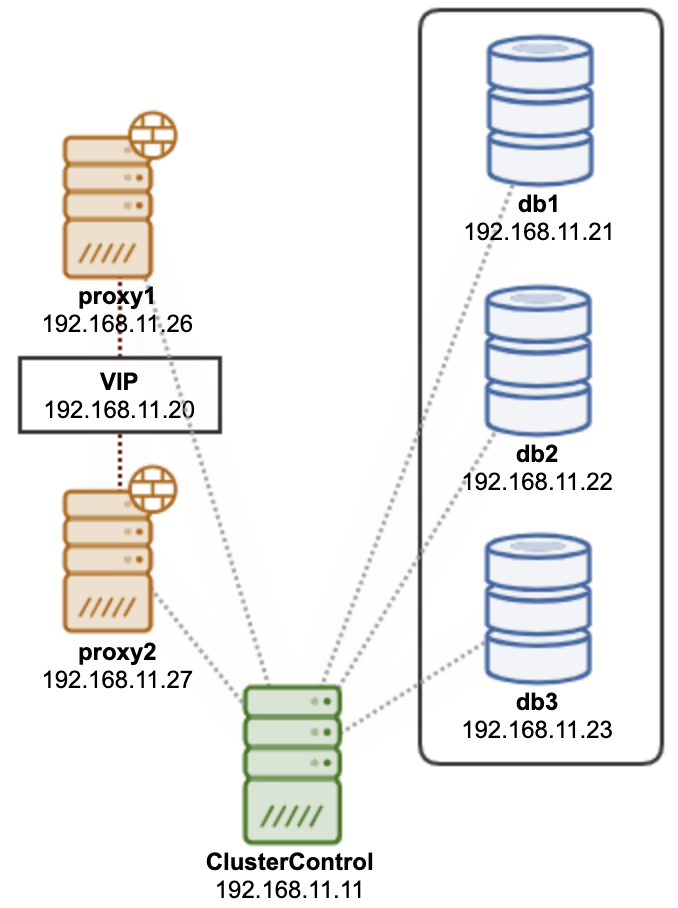
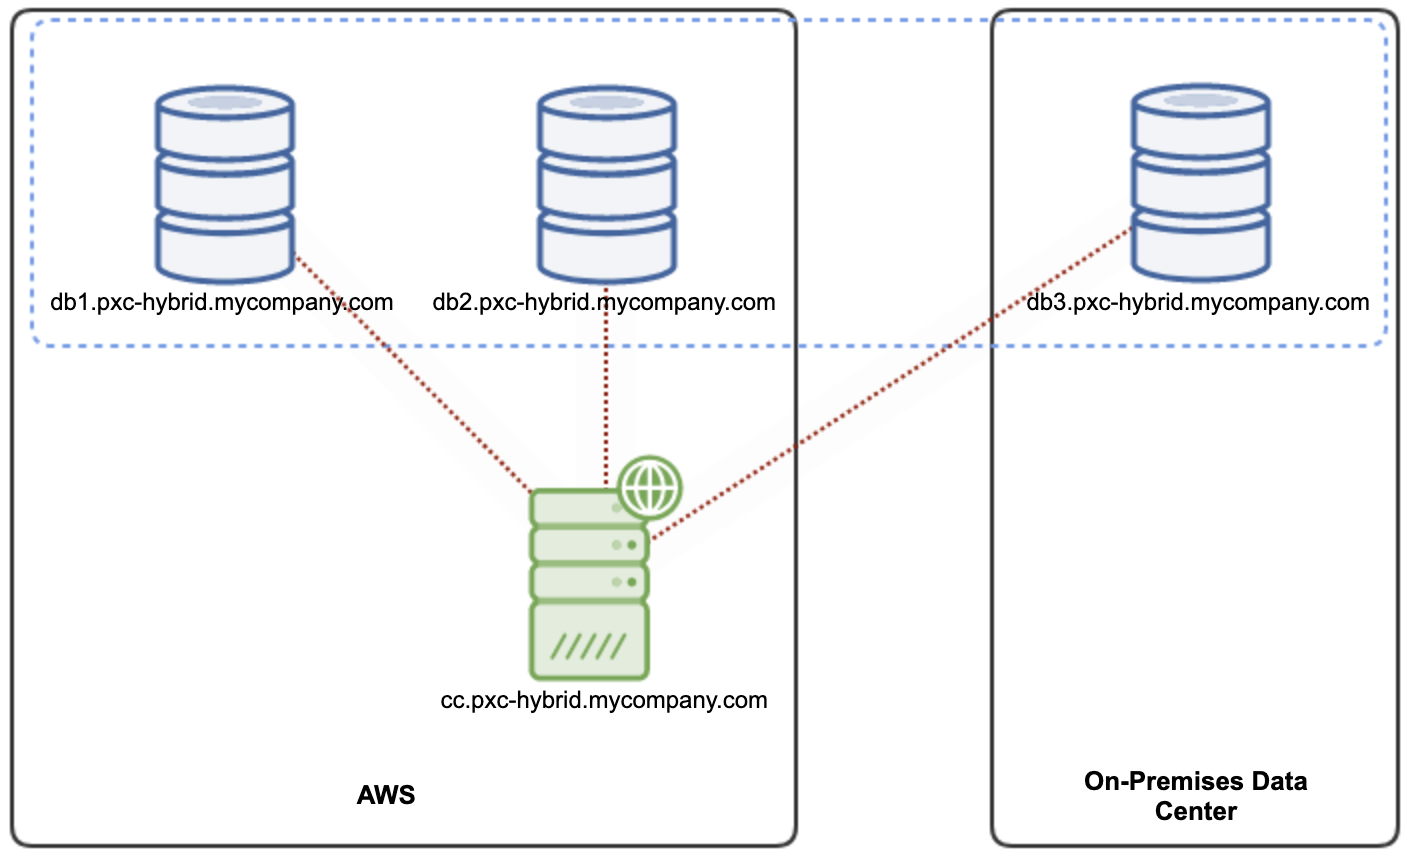
MariaDB Cluster is a high availability solution consisting of MariaDB Server and Galera Replication as shown in the architecture diagram below :

It is synchronous (“virtually synchronous”) replication, all of the nodes are writable. The synchronous replication guarantees if the changes happen in one of the galera nodes, it will be available on all the other nodes in the cluster before being committed.
The big difference is that all the nodes are equal from the application point of view, they can send write traffic to any of the database instances. Also, all nodes should have exactly the same data so there is no data loss in case of node failure.
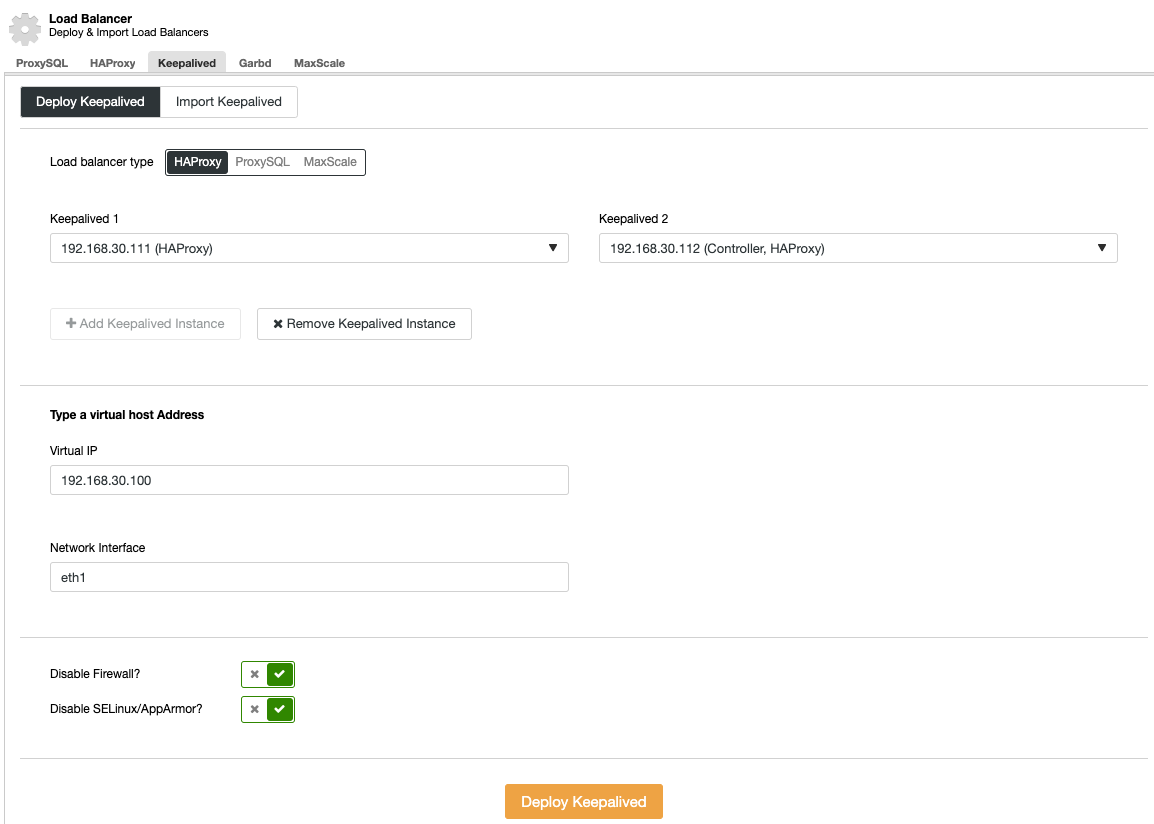
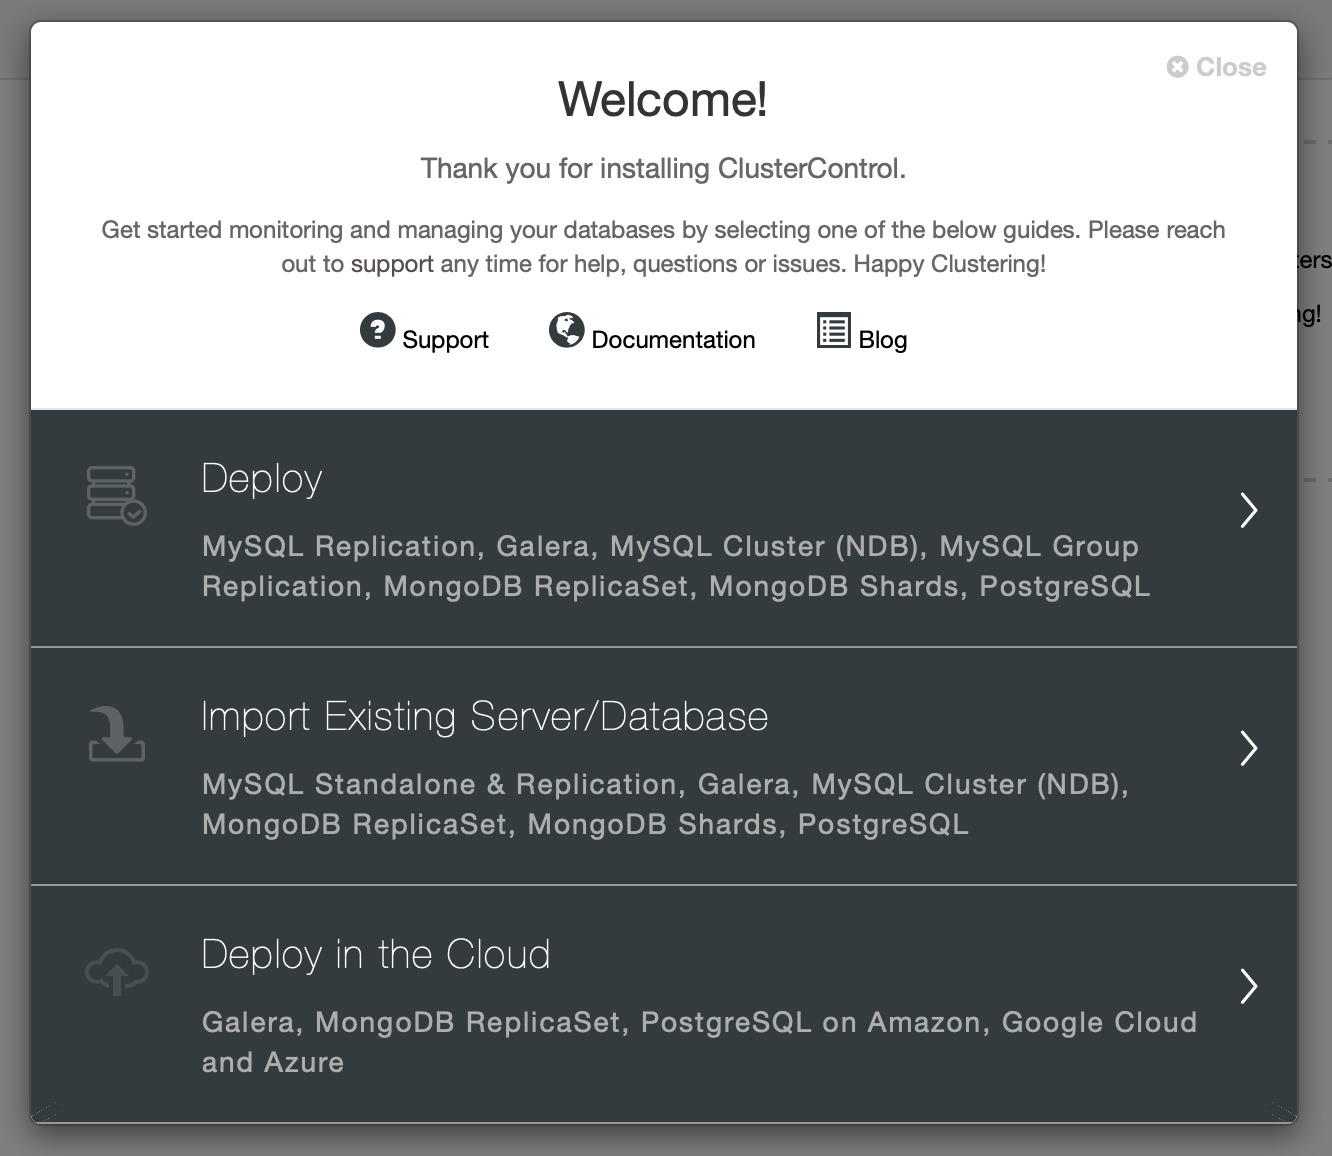
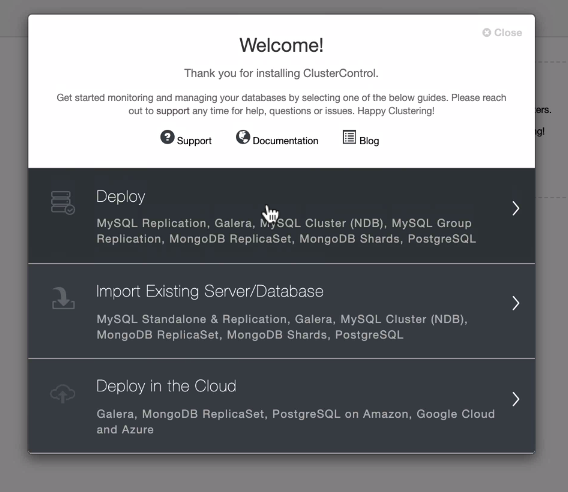
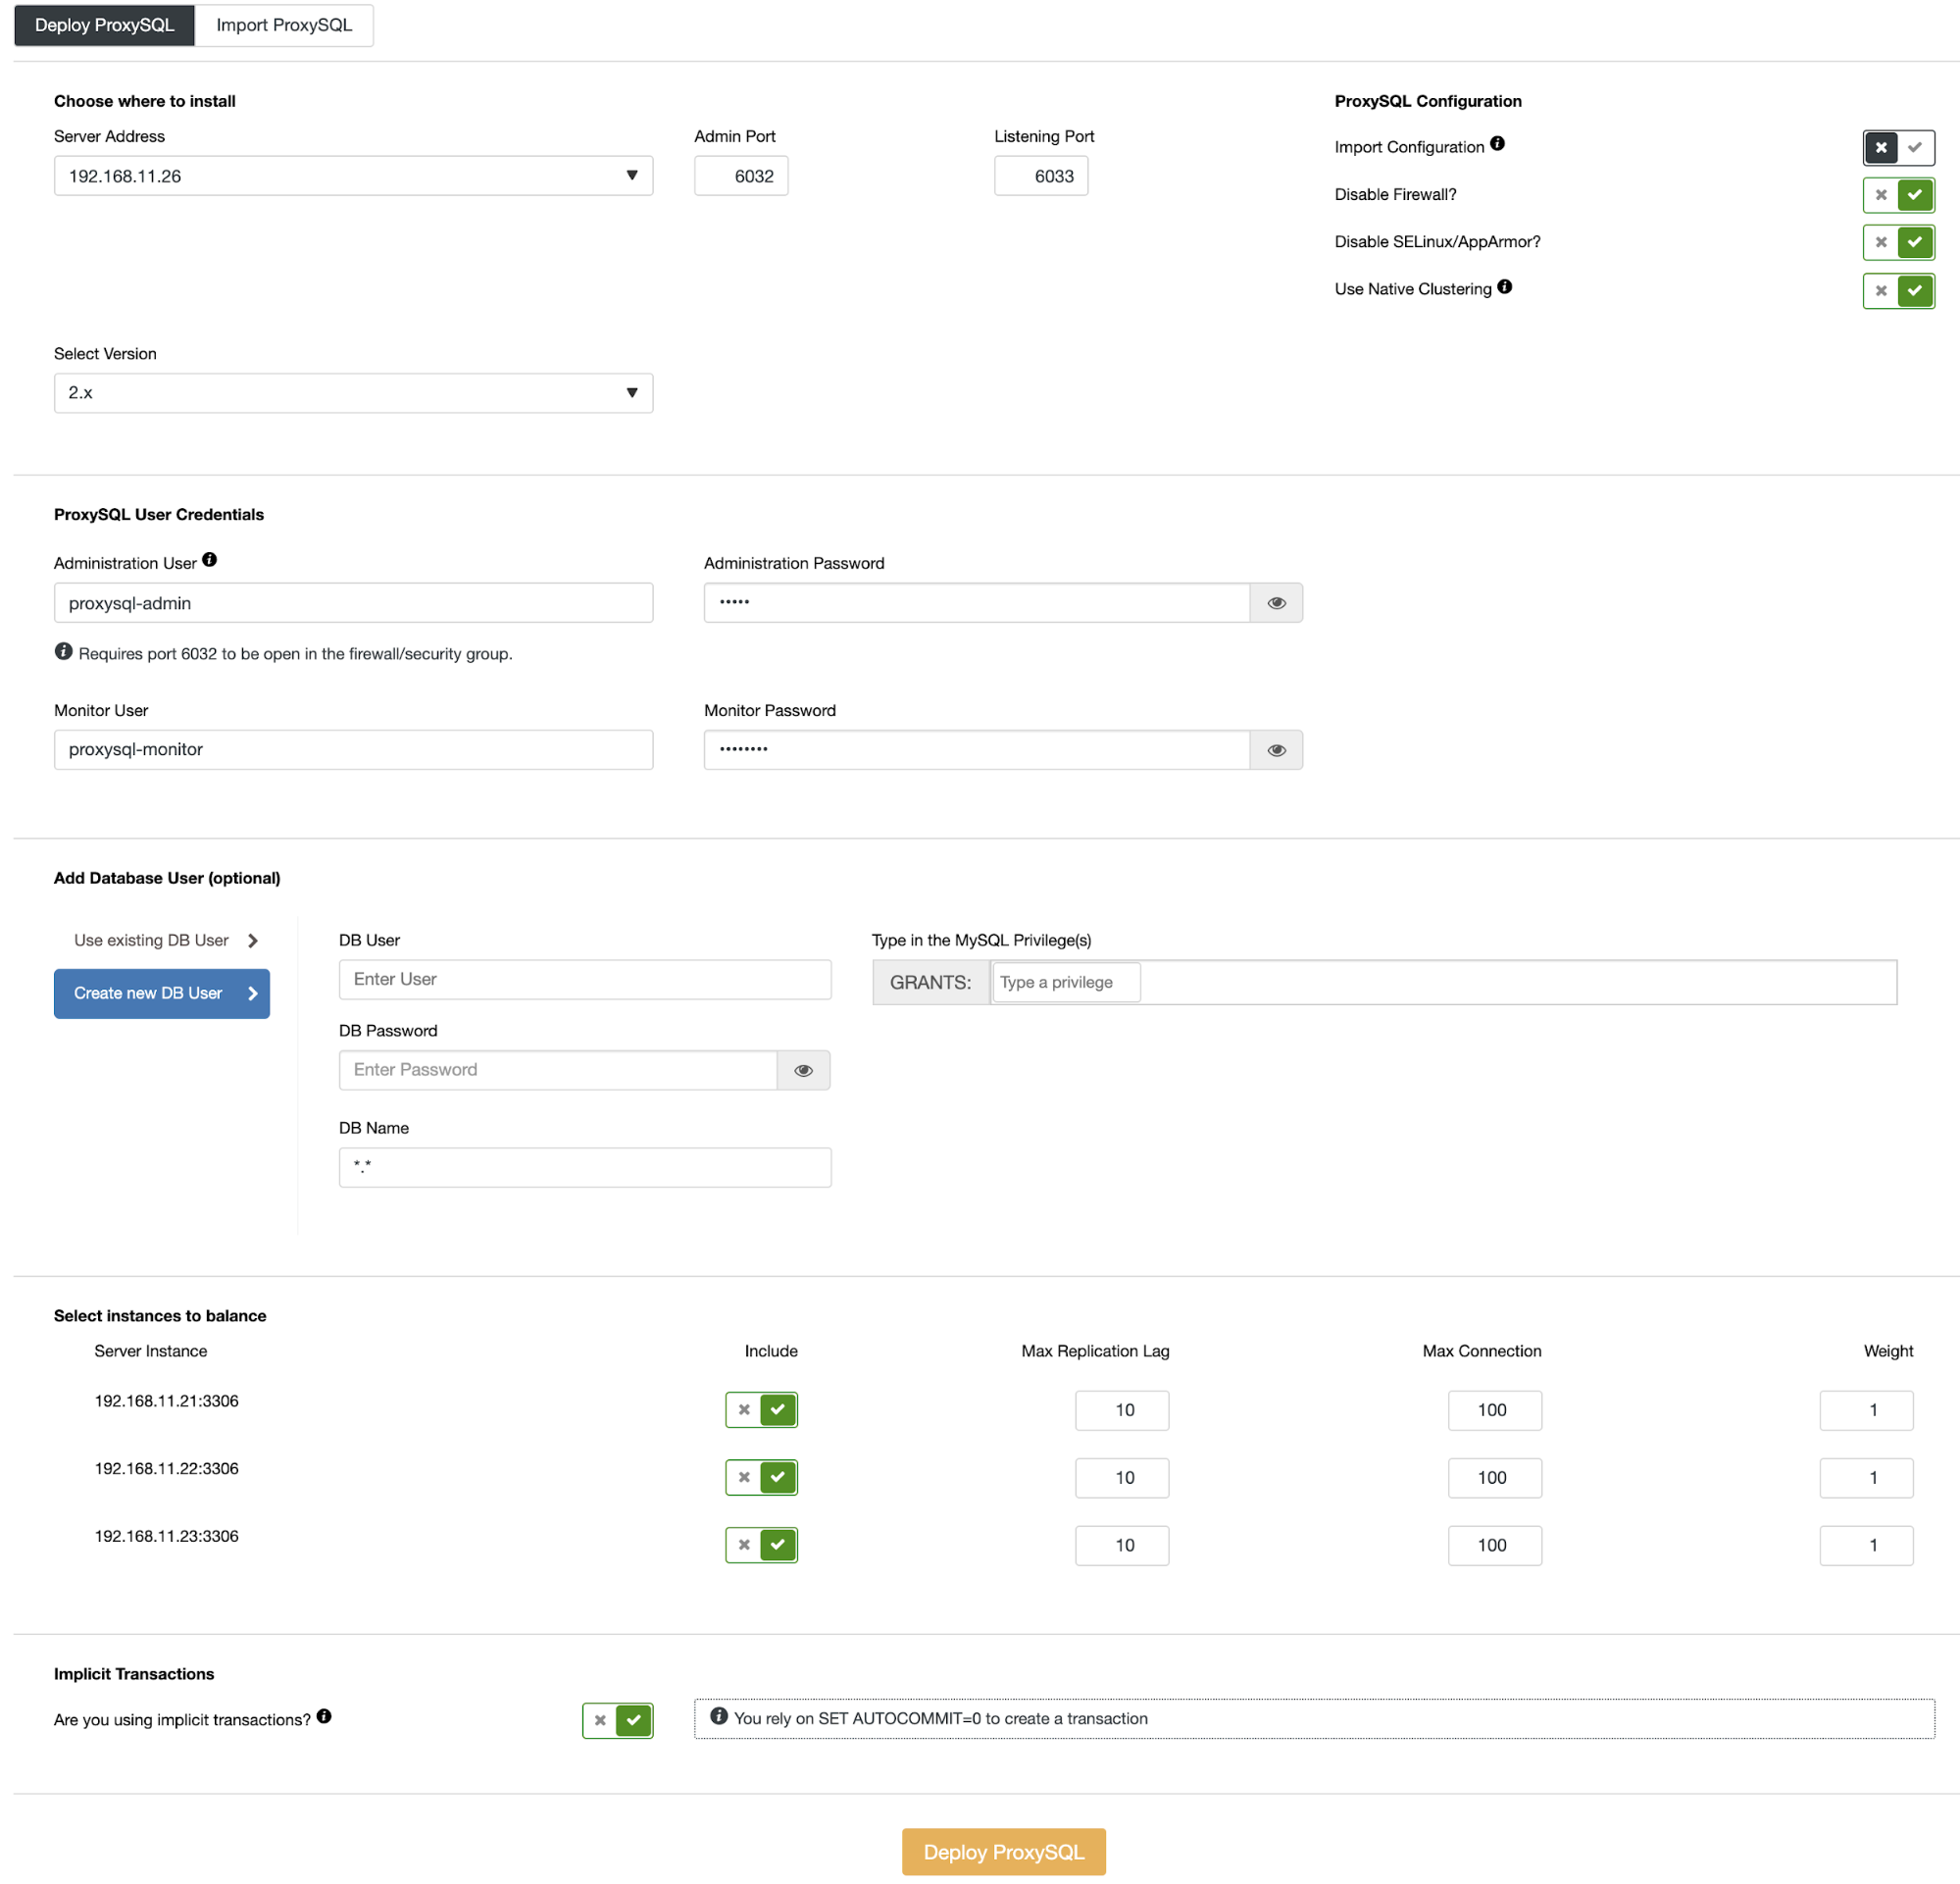
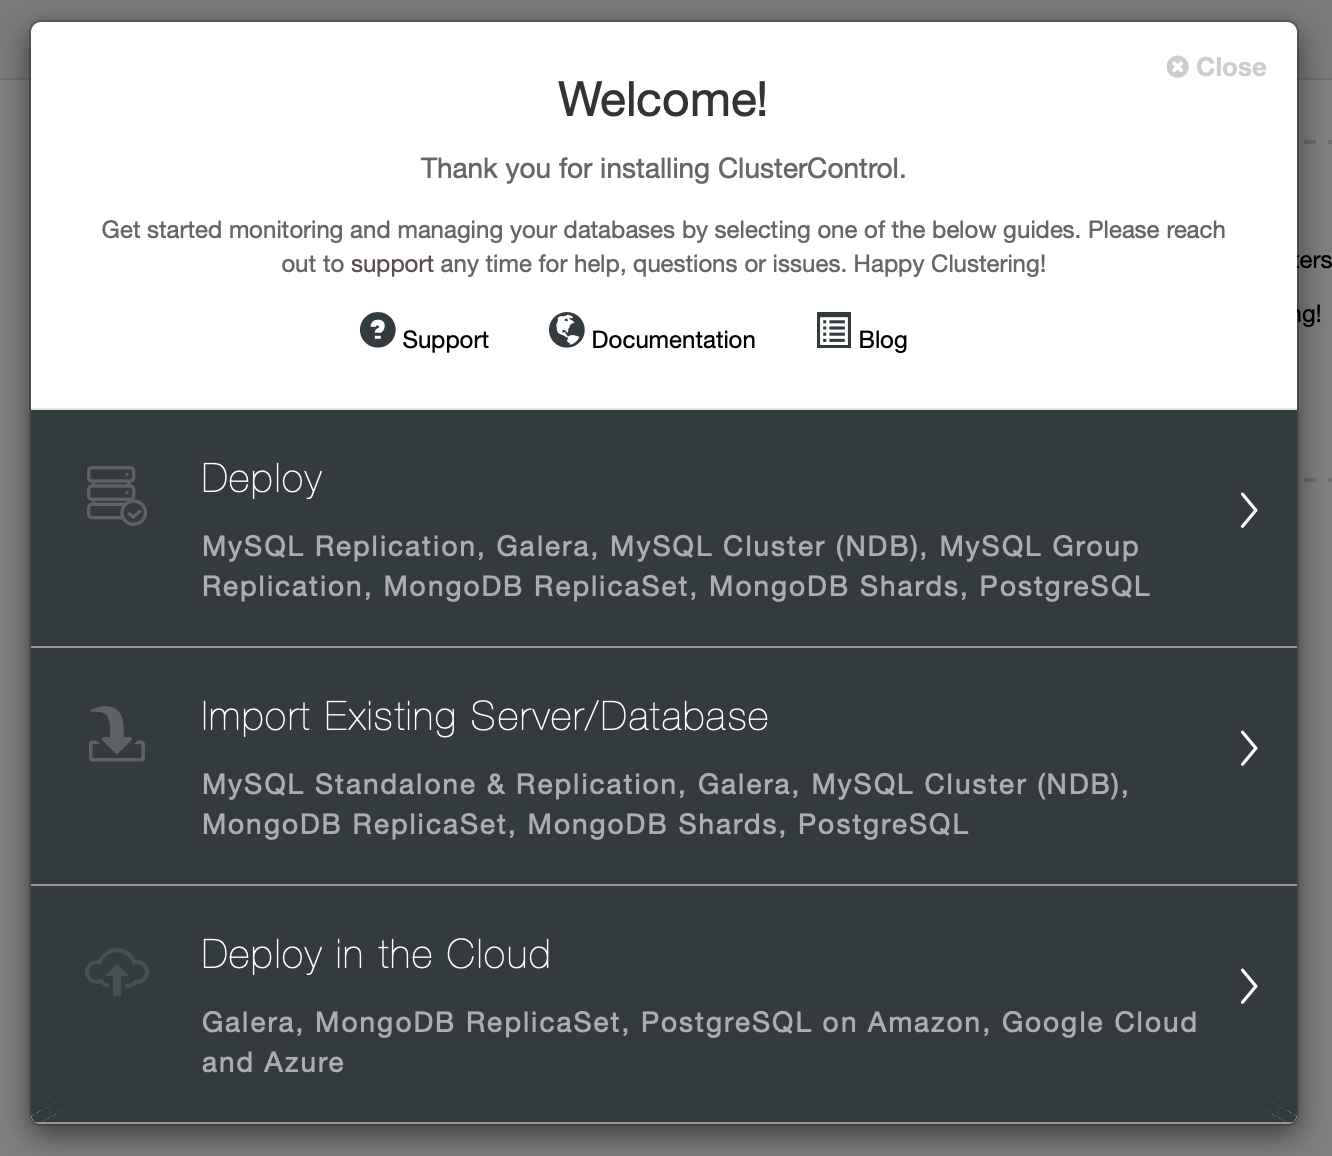
MariaDB Deployment
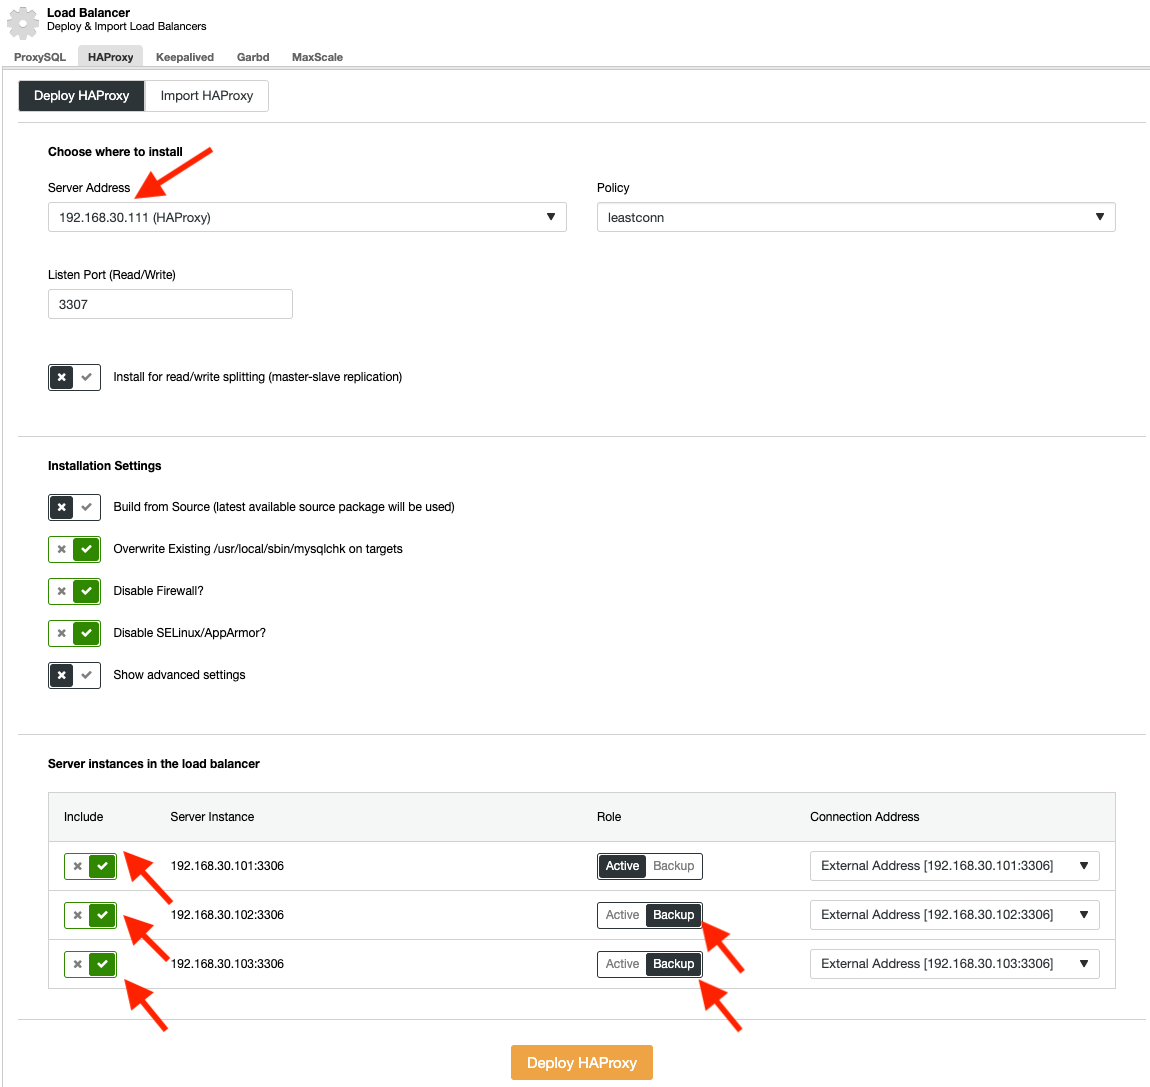
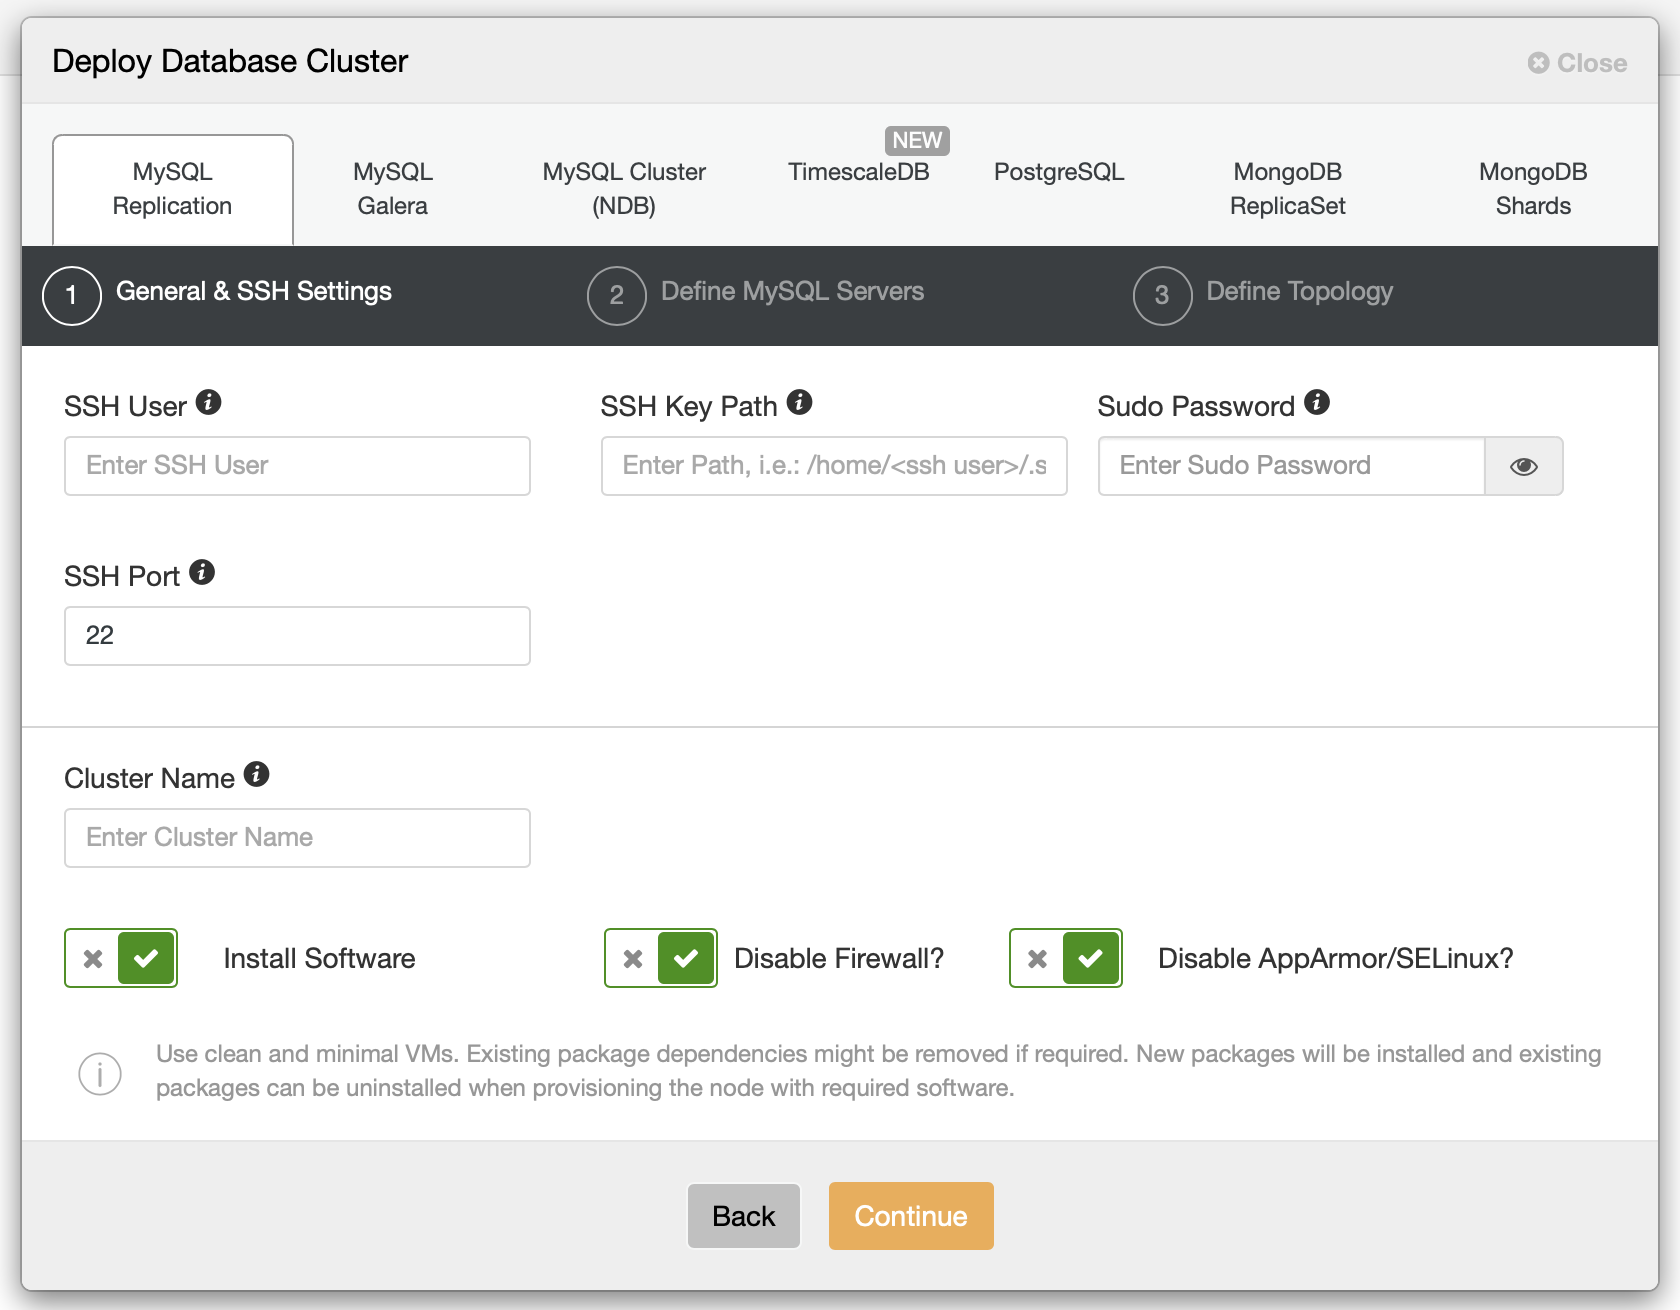
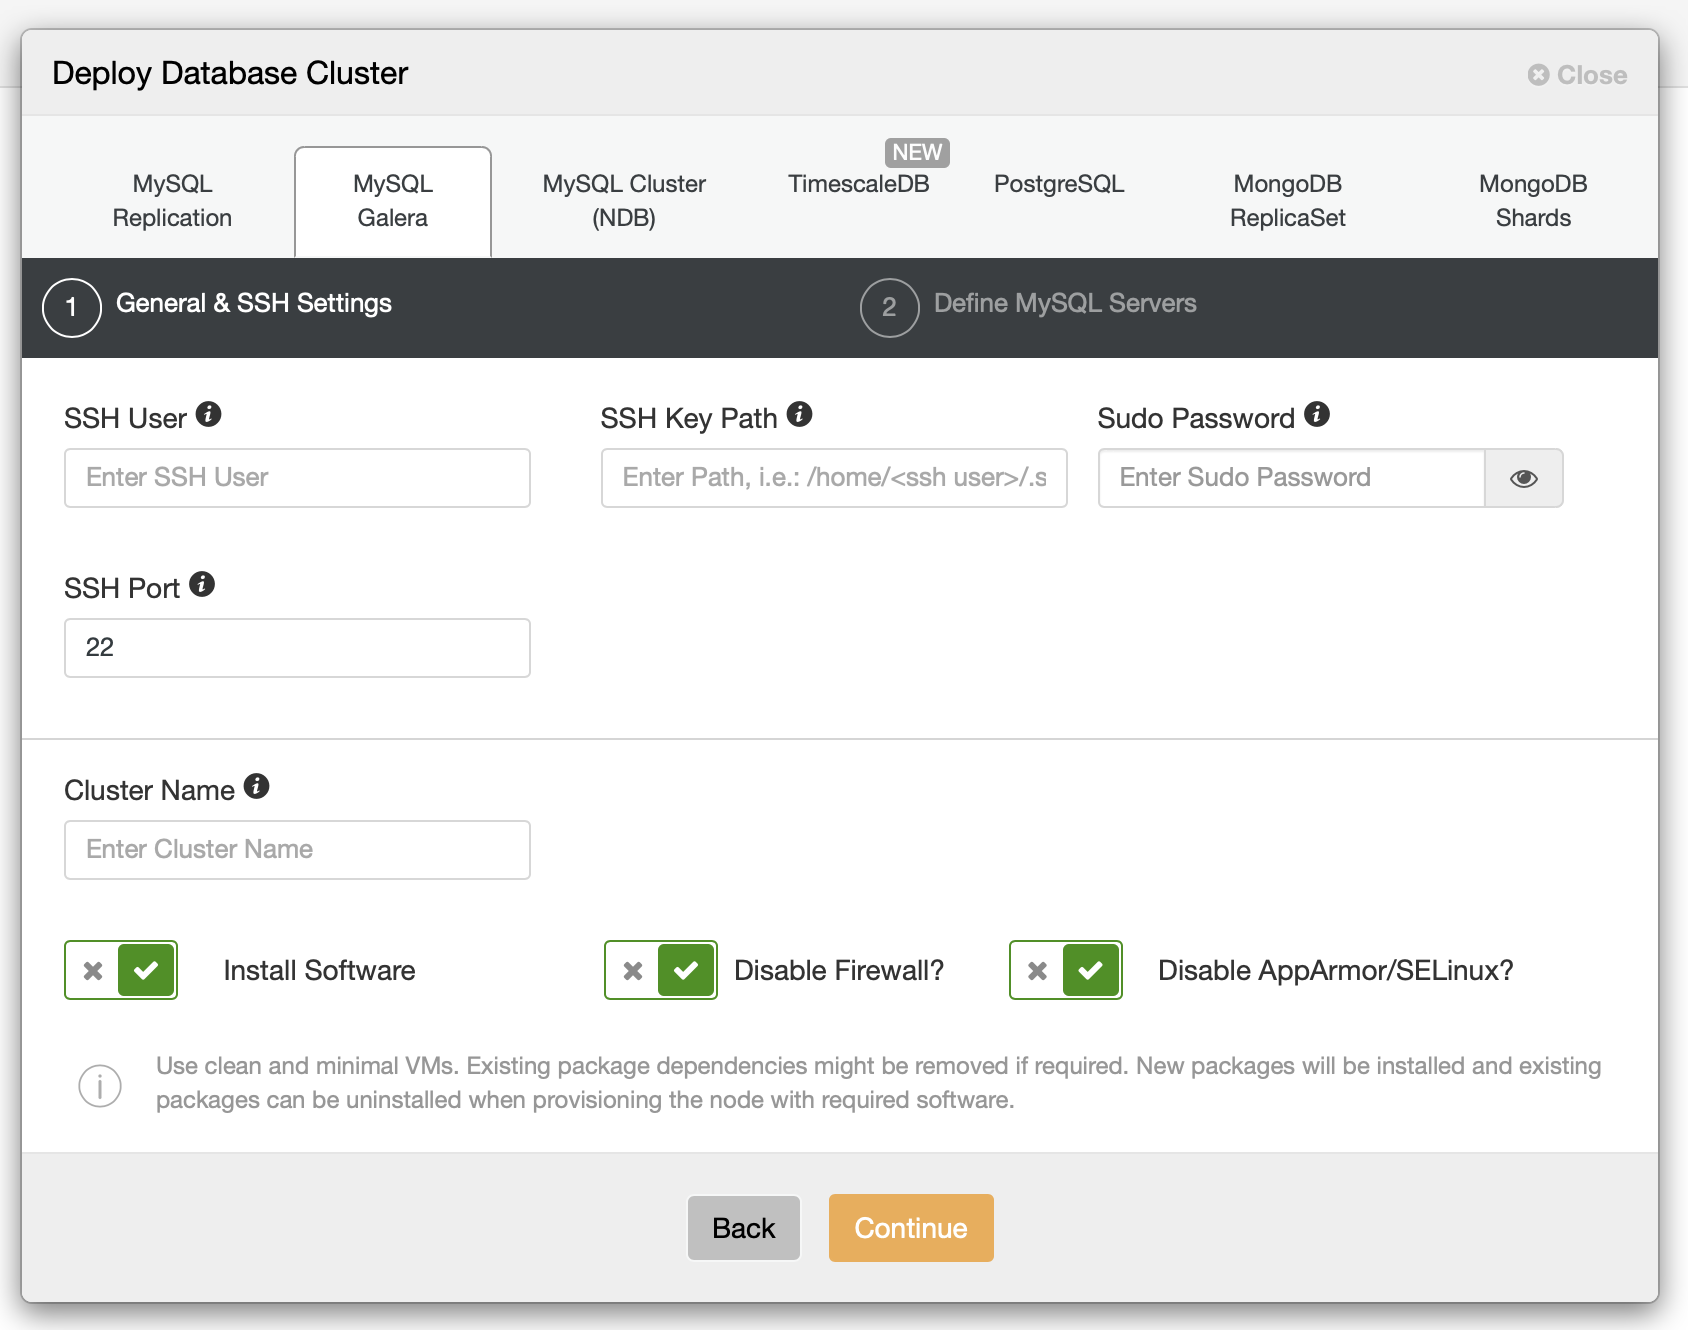
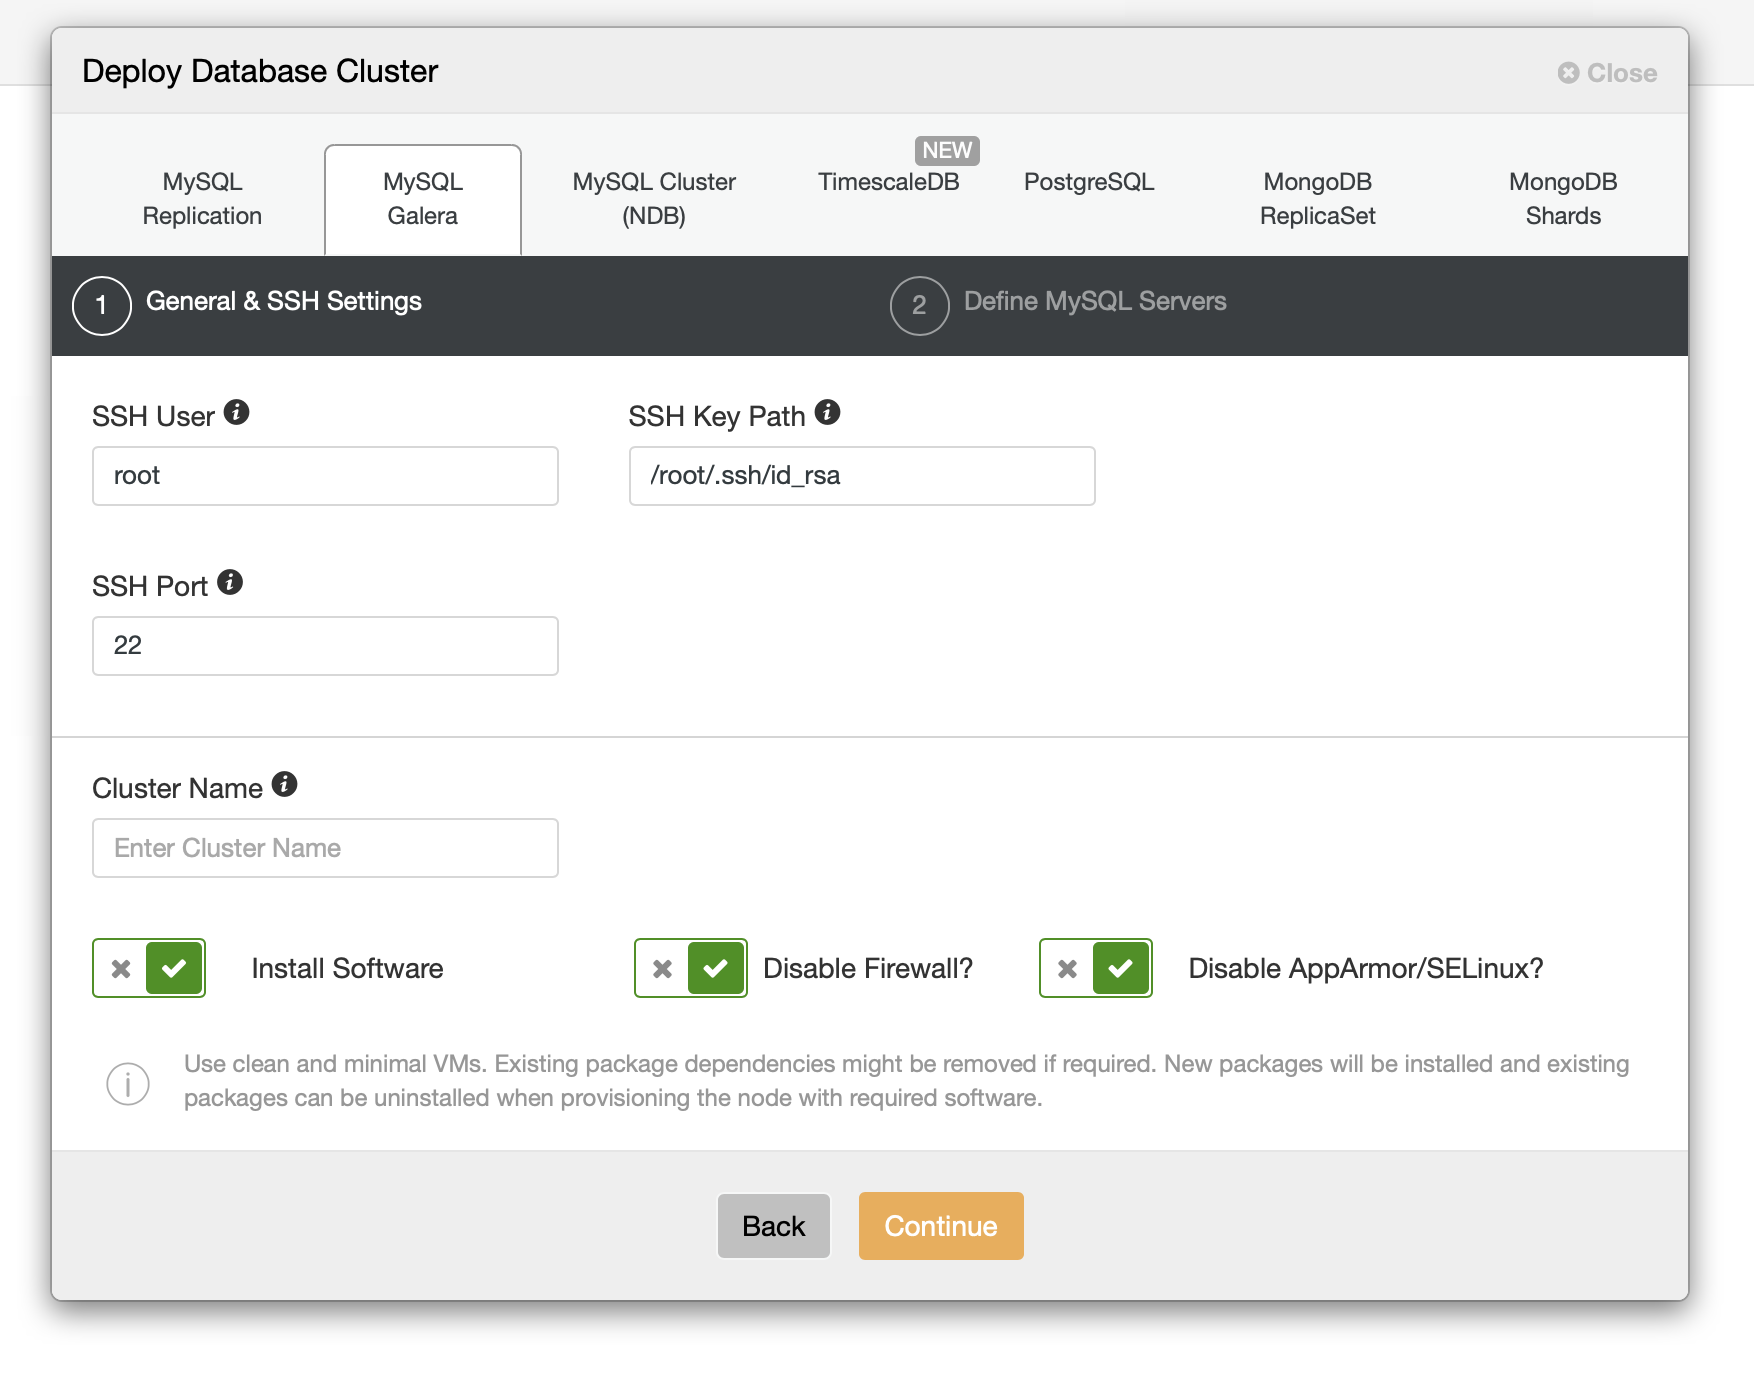
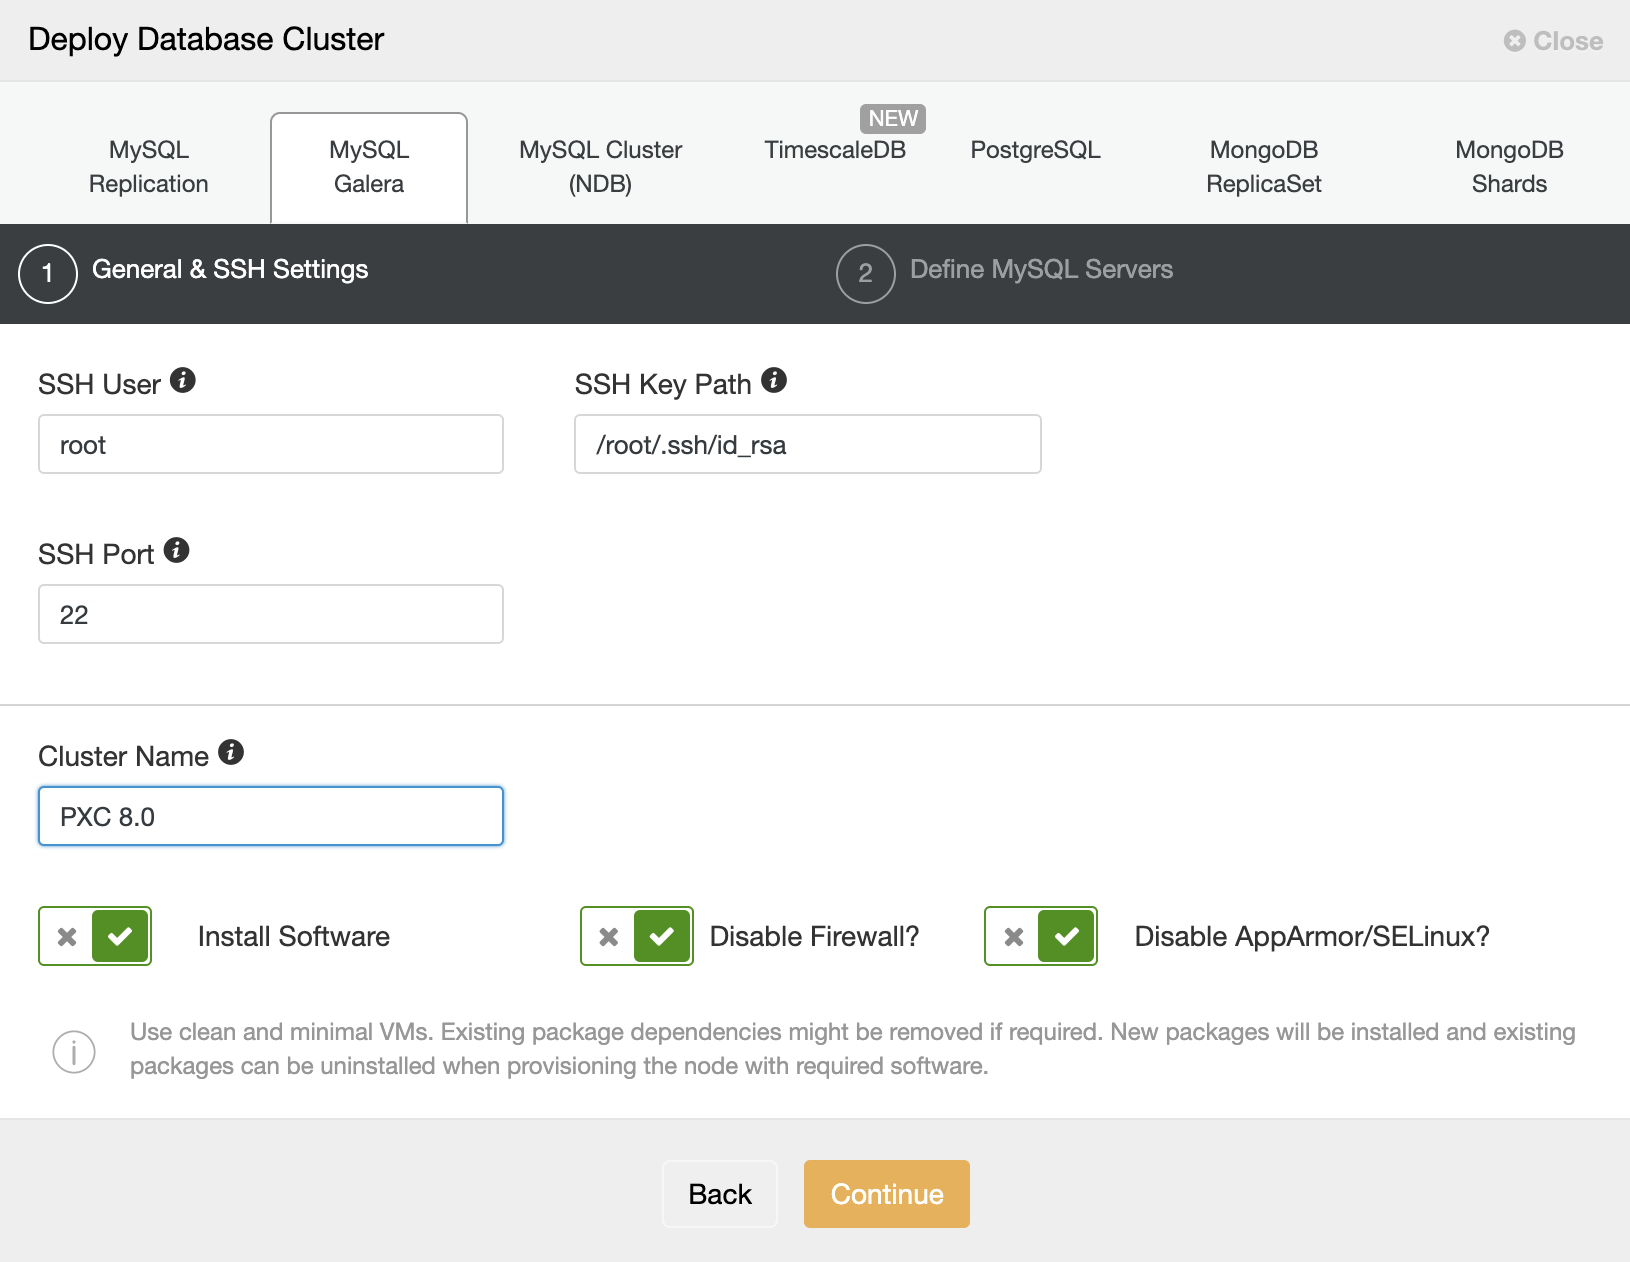
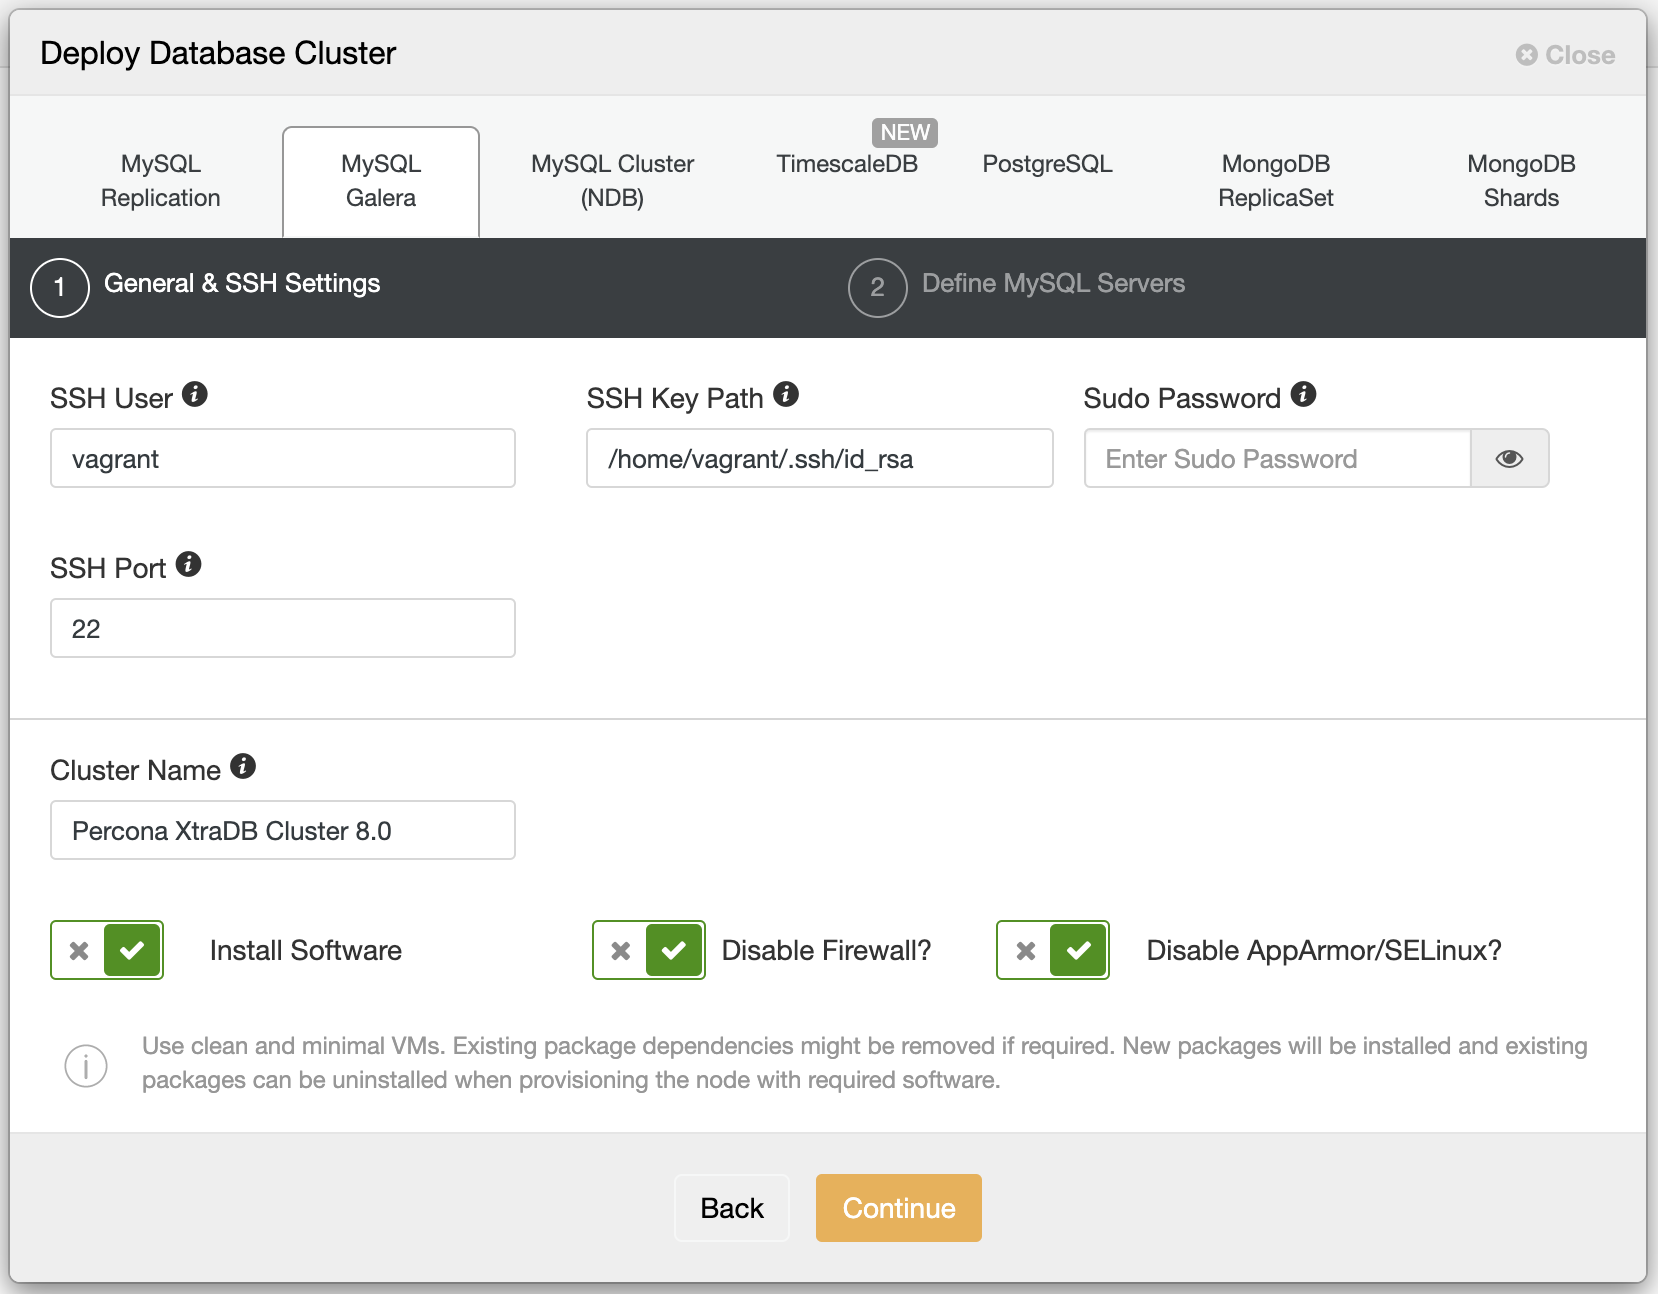
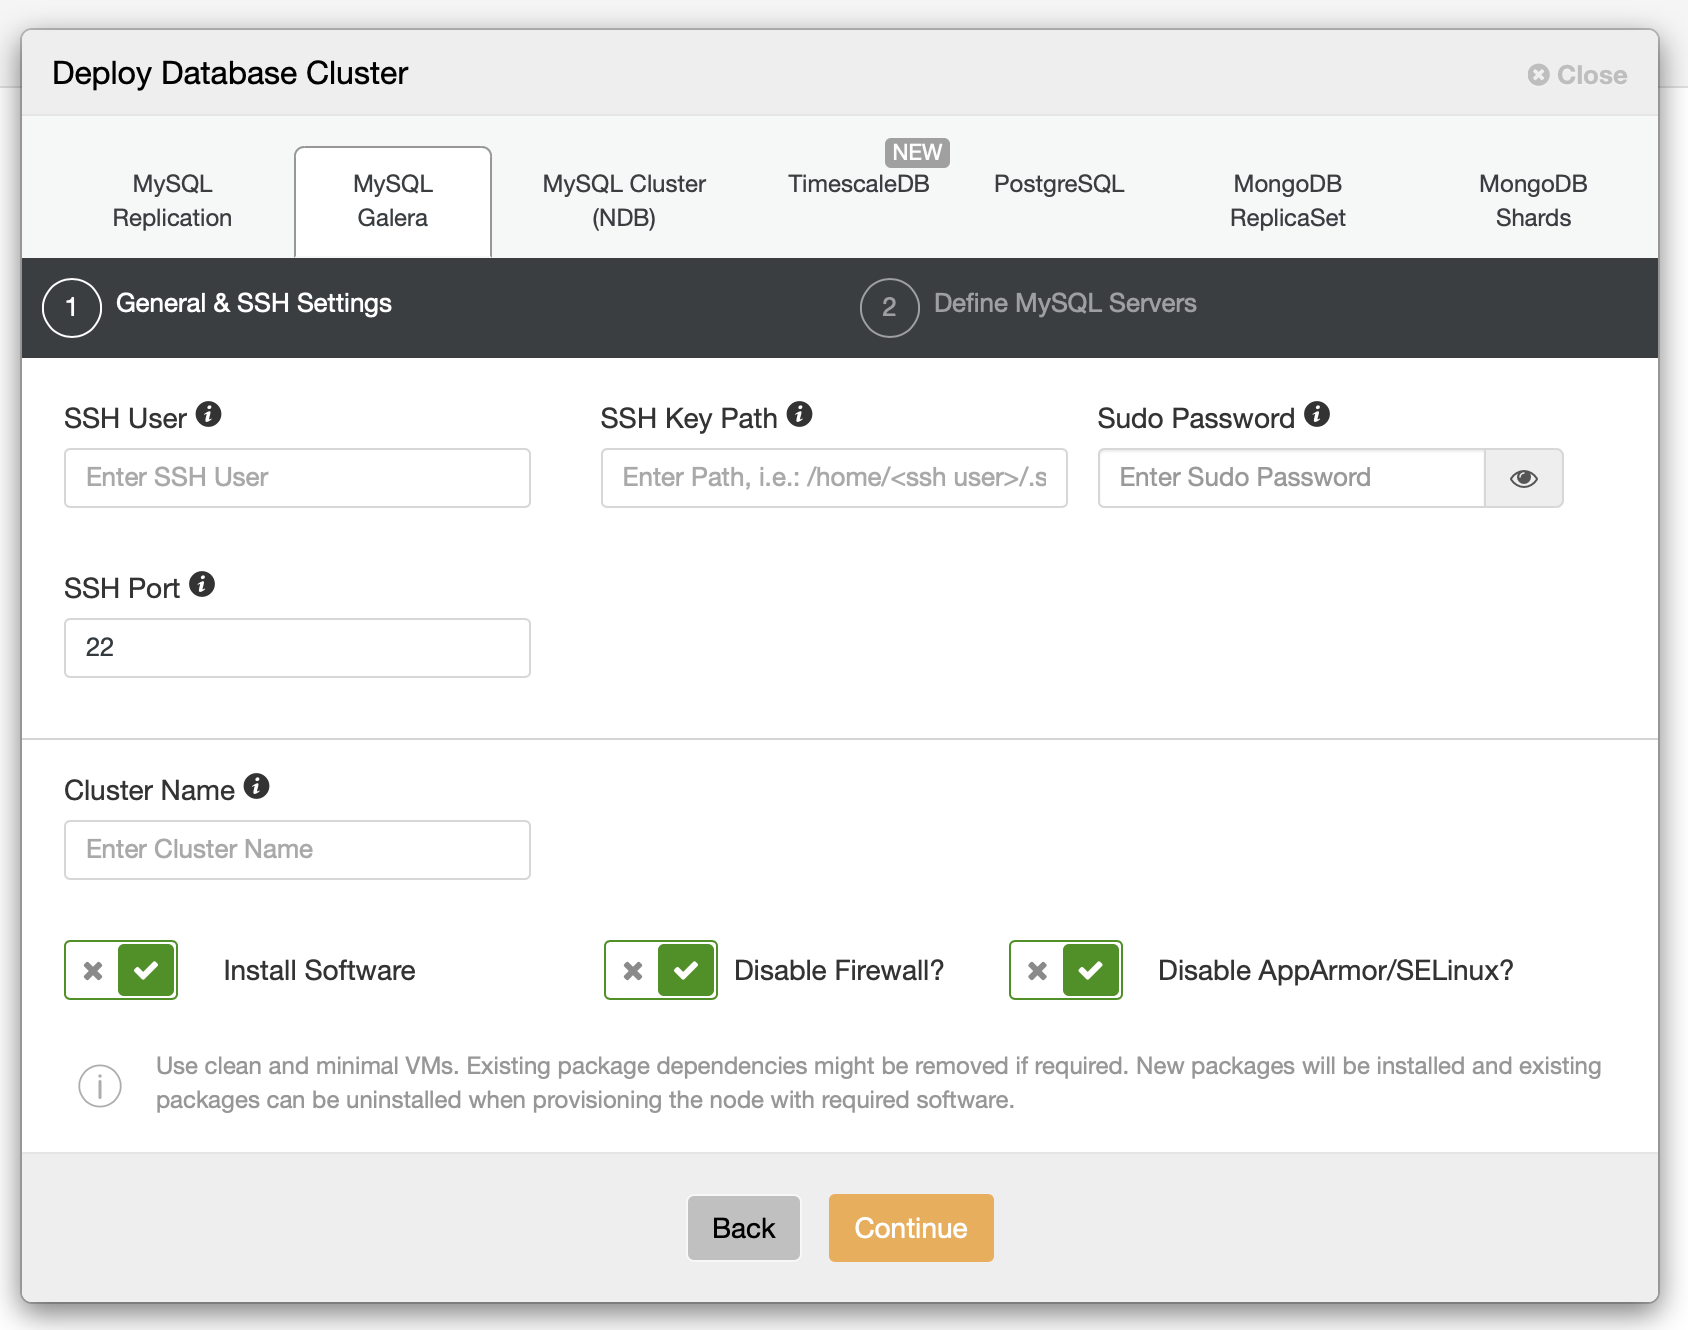
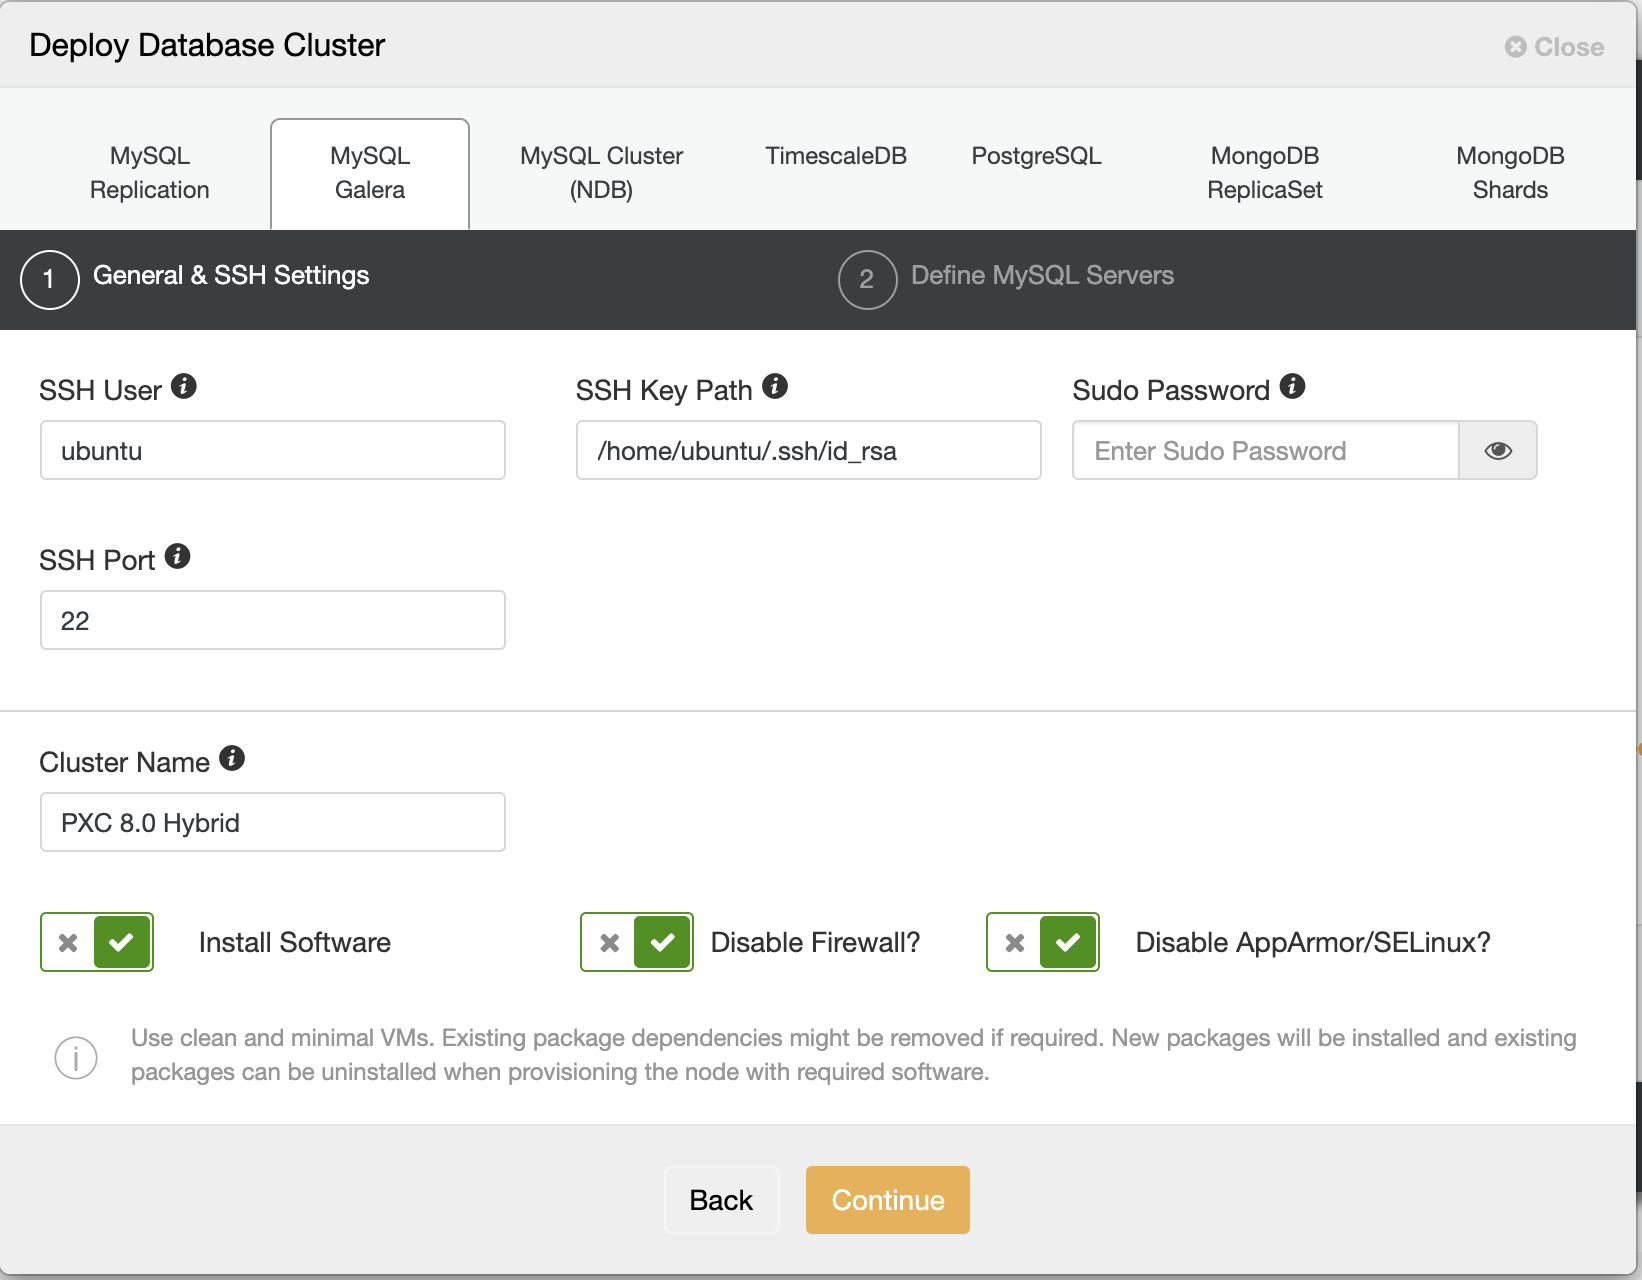
Both MariaDB Replication and MariaDB Cluster can be deployed via ClusterControl. When you deploy MariaDB Server, you need to start by choosing MySQL Replication while for MariaDB Cluster, you need to choose MySQL Galera.
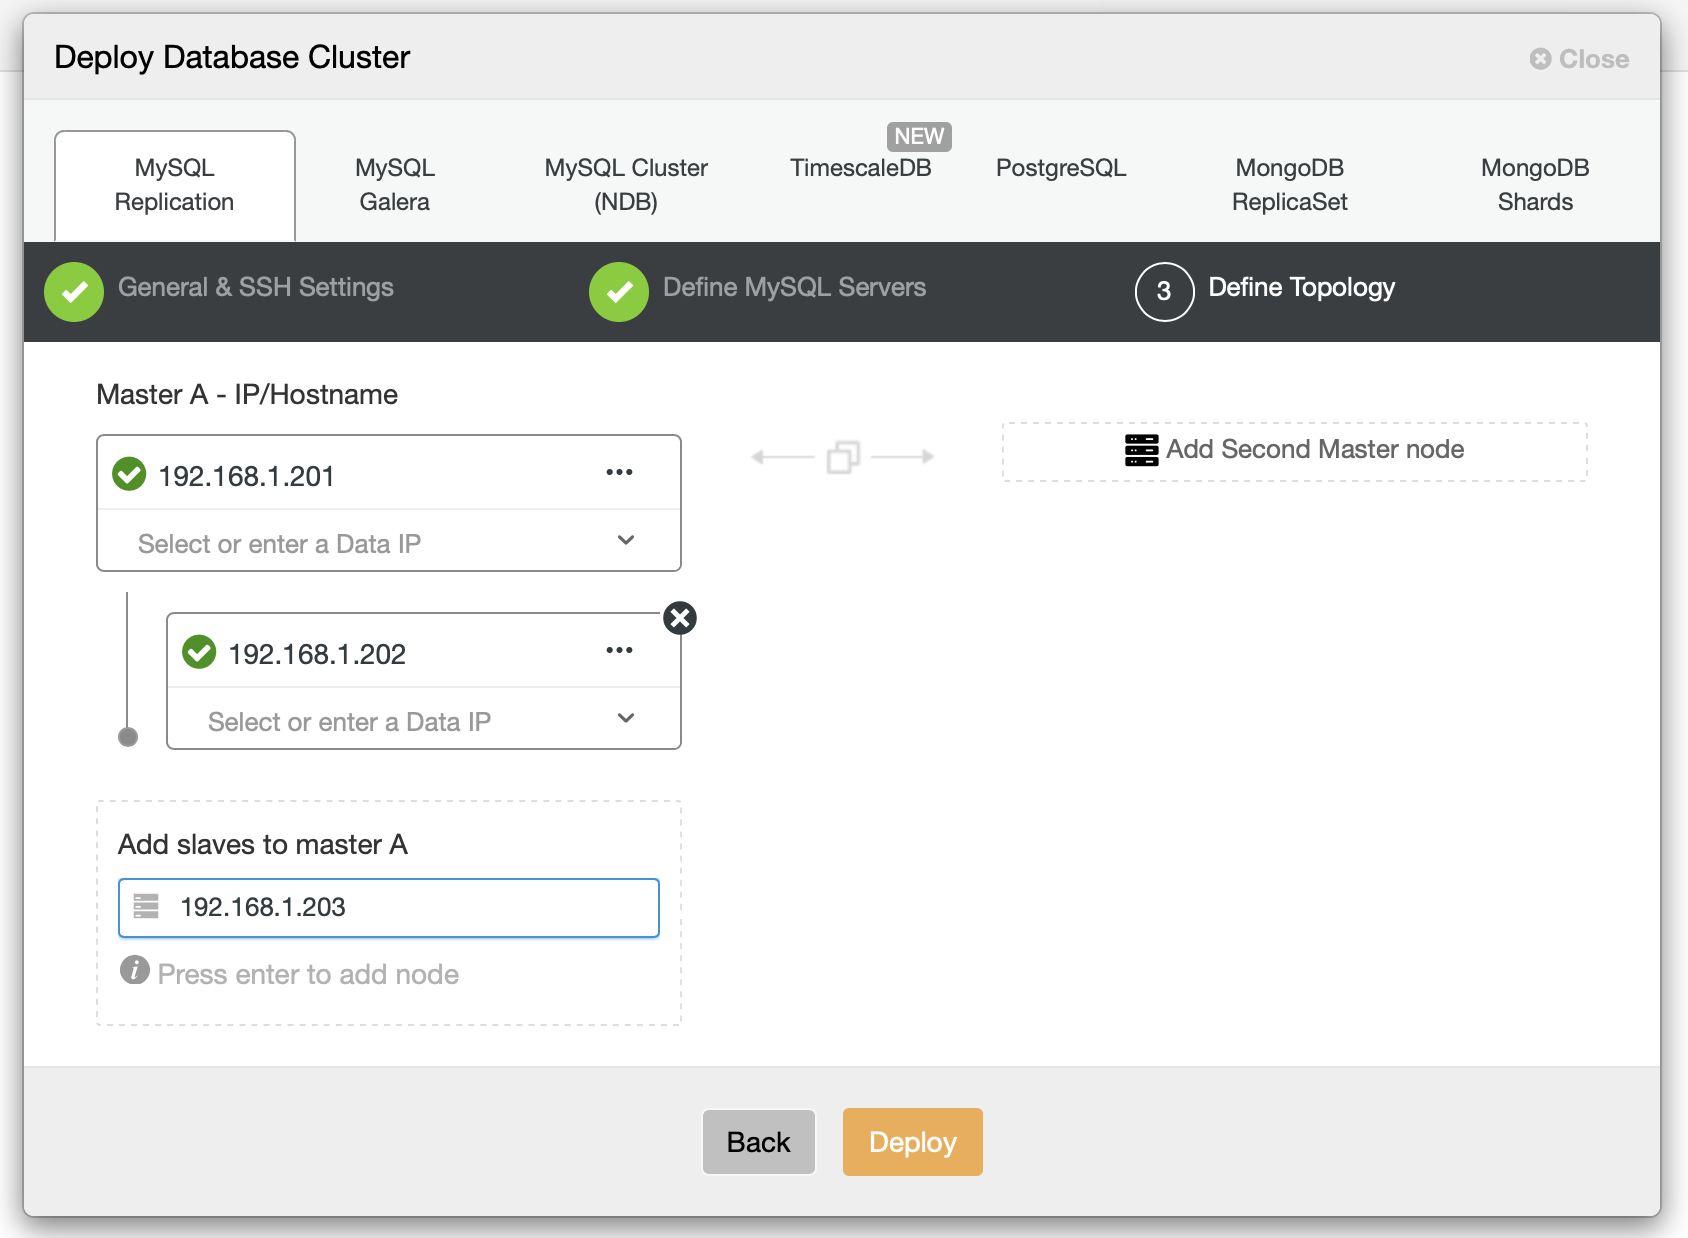
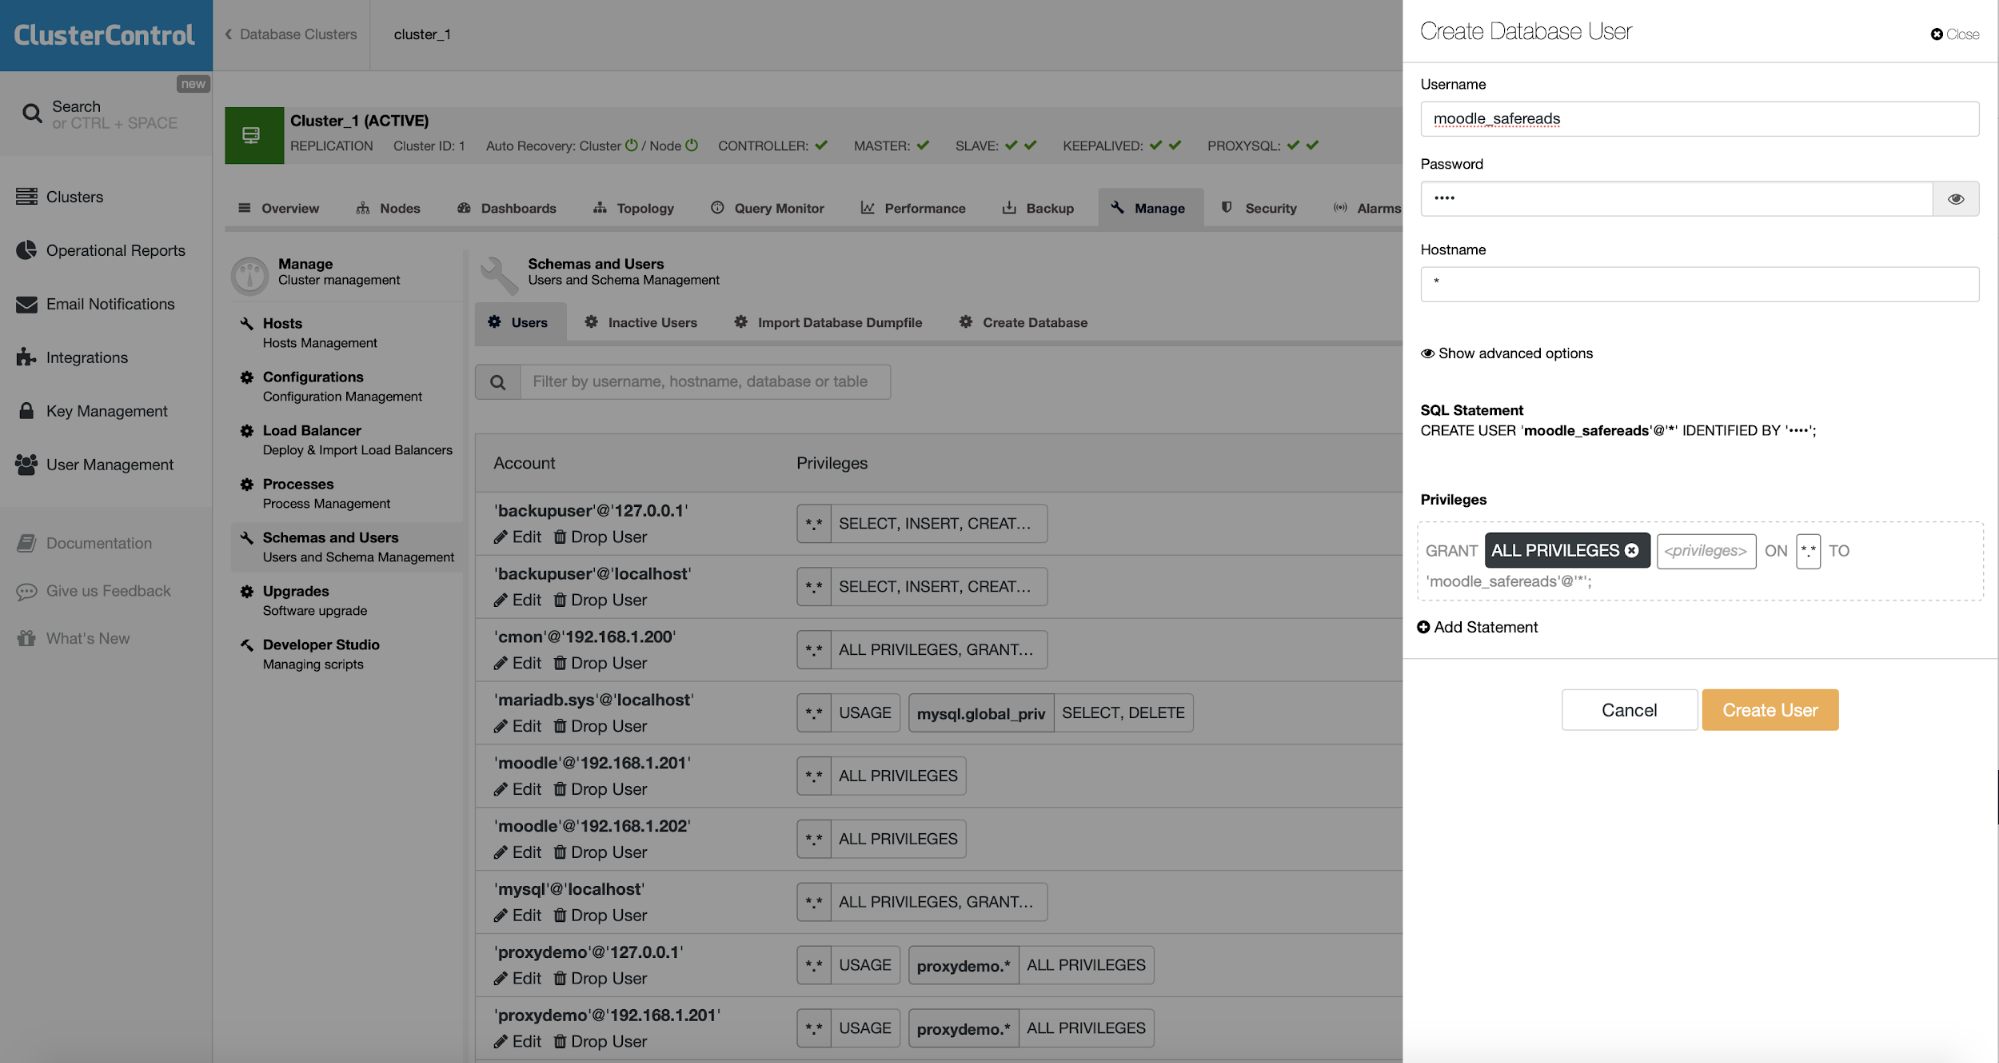
For MariaDB Server, you can either deploy a single node MariaDB instance or you can setup master/slave and bi-directional replication. The minimum number of nodes in a replication setup is two, you need one master and at least one slave.Just fill the IP Address for the master and add slaves (if you want to have master/slave architecture). You can use the Add Second Master field if you want to set up bi-directional replication. A master-master setup will be provisioned with bi-directional replication, but one of the nodes will be set as read-only. The reason is to minimize the risk for data drift and ‘errant transactions’.

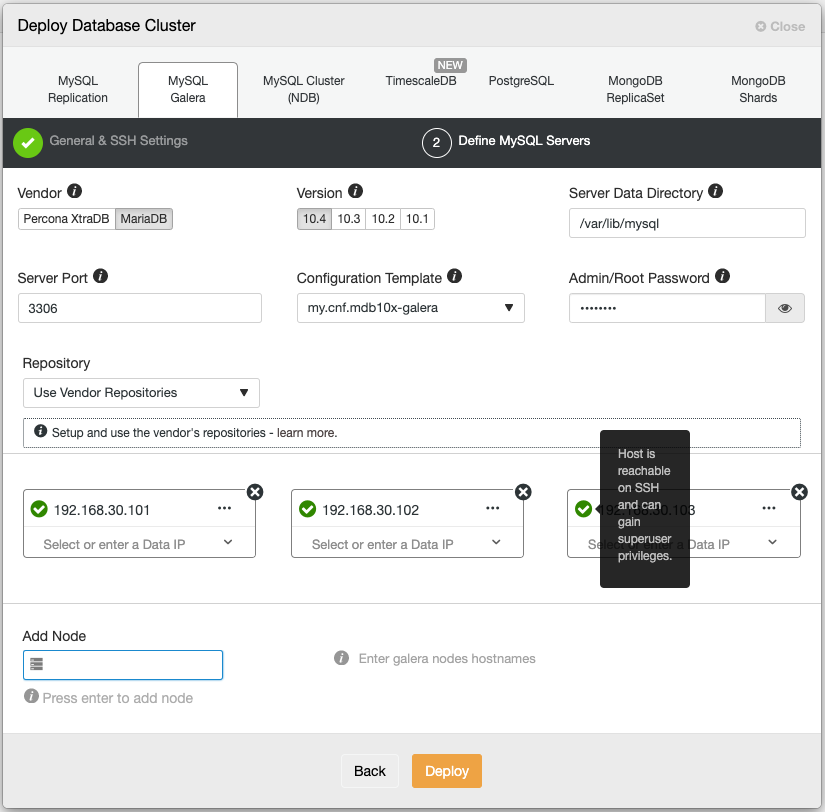
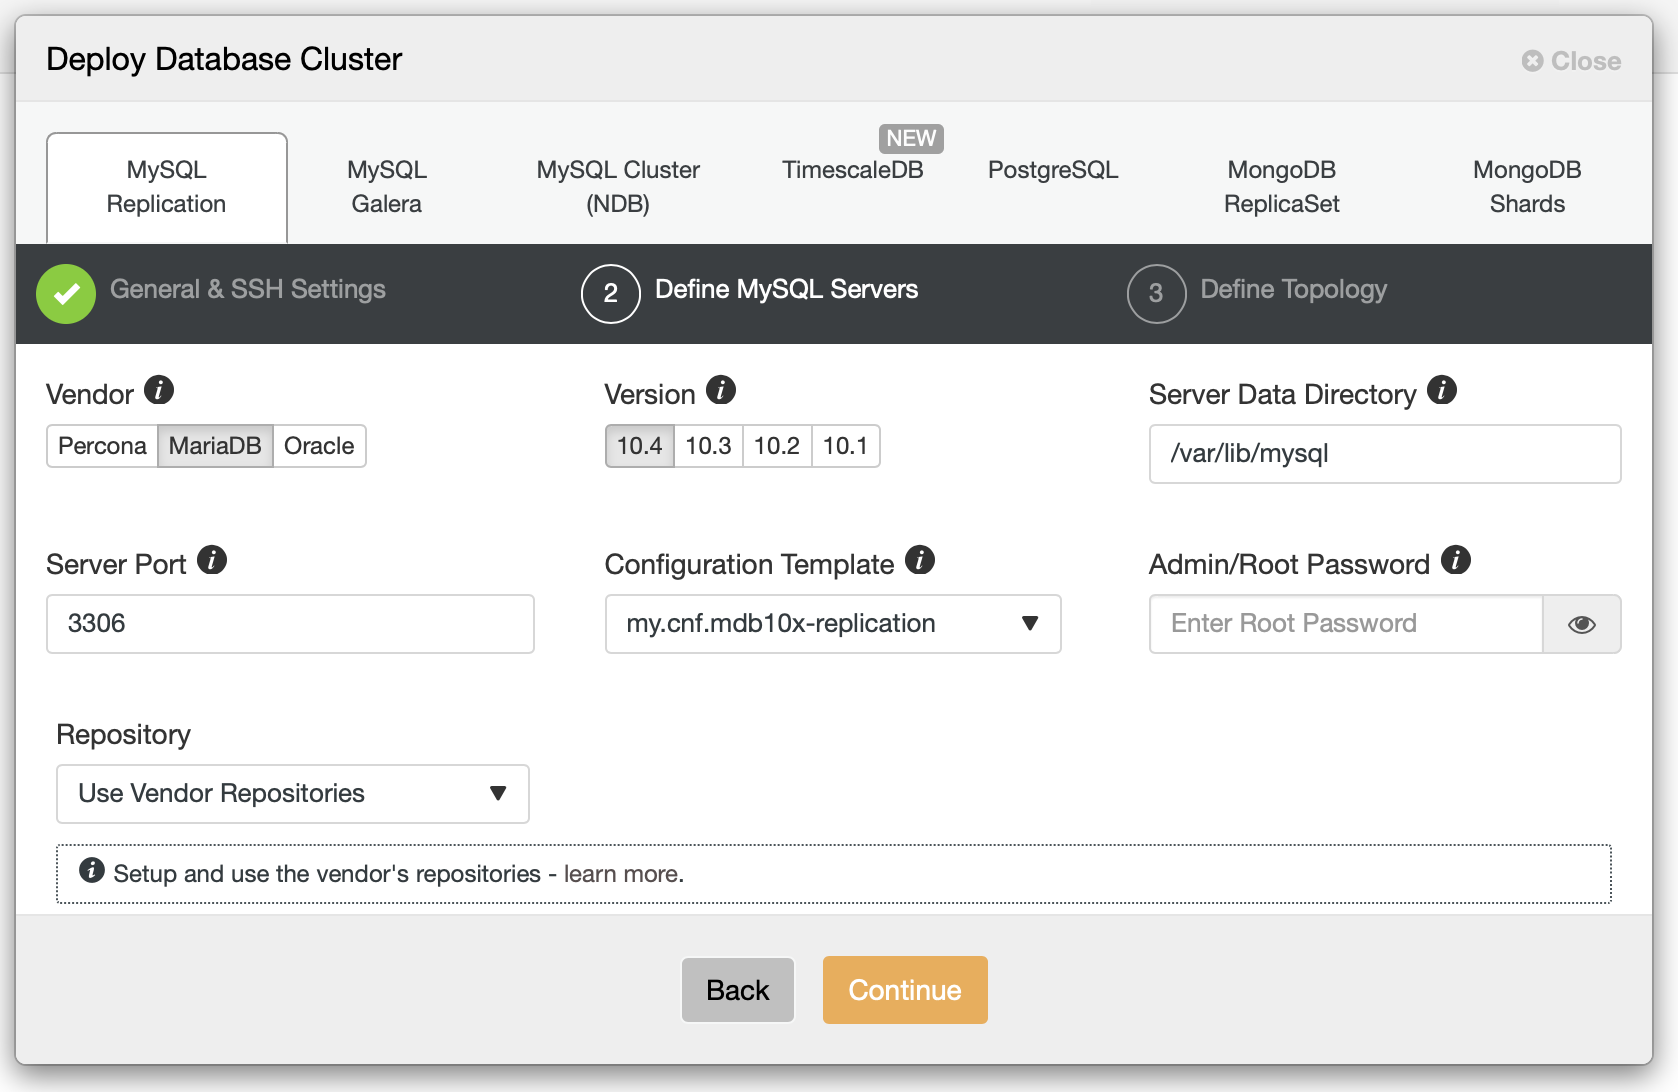
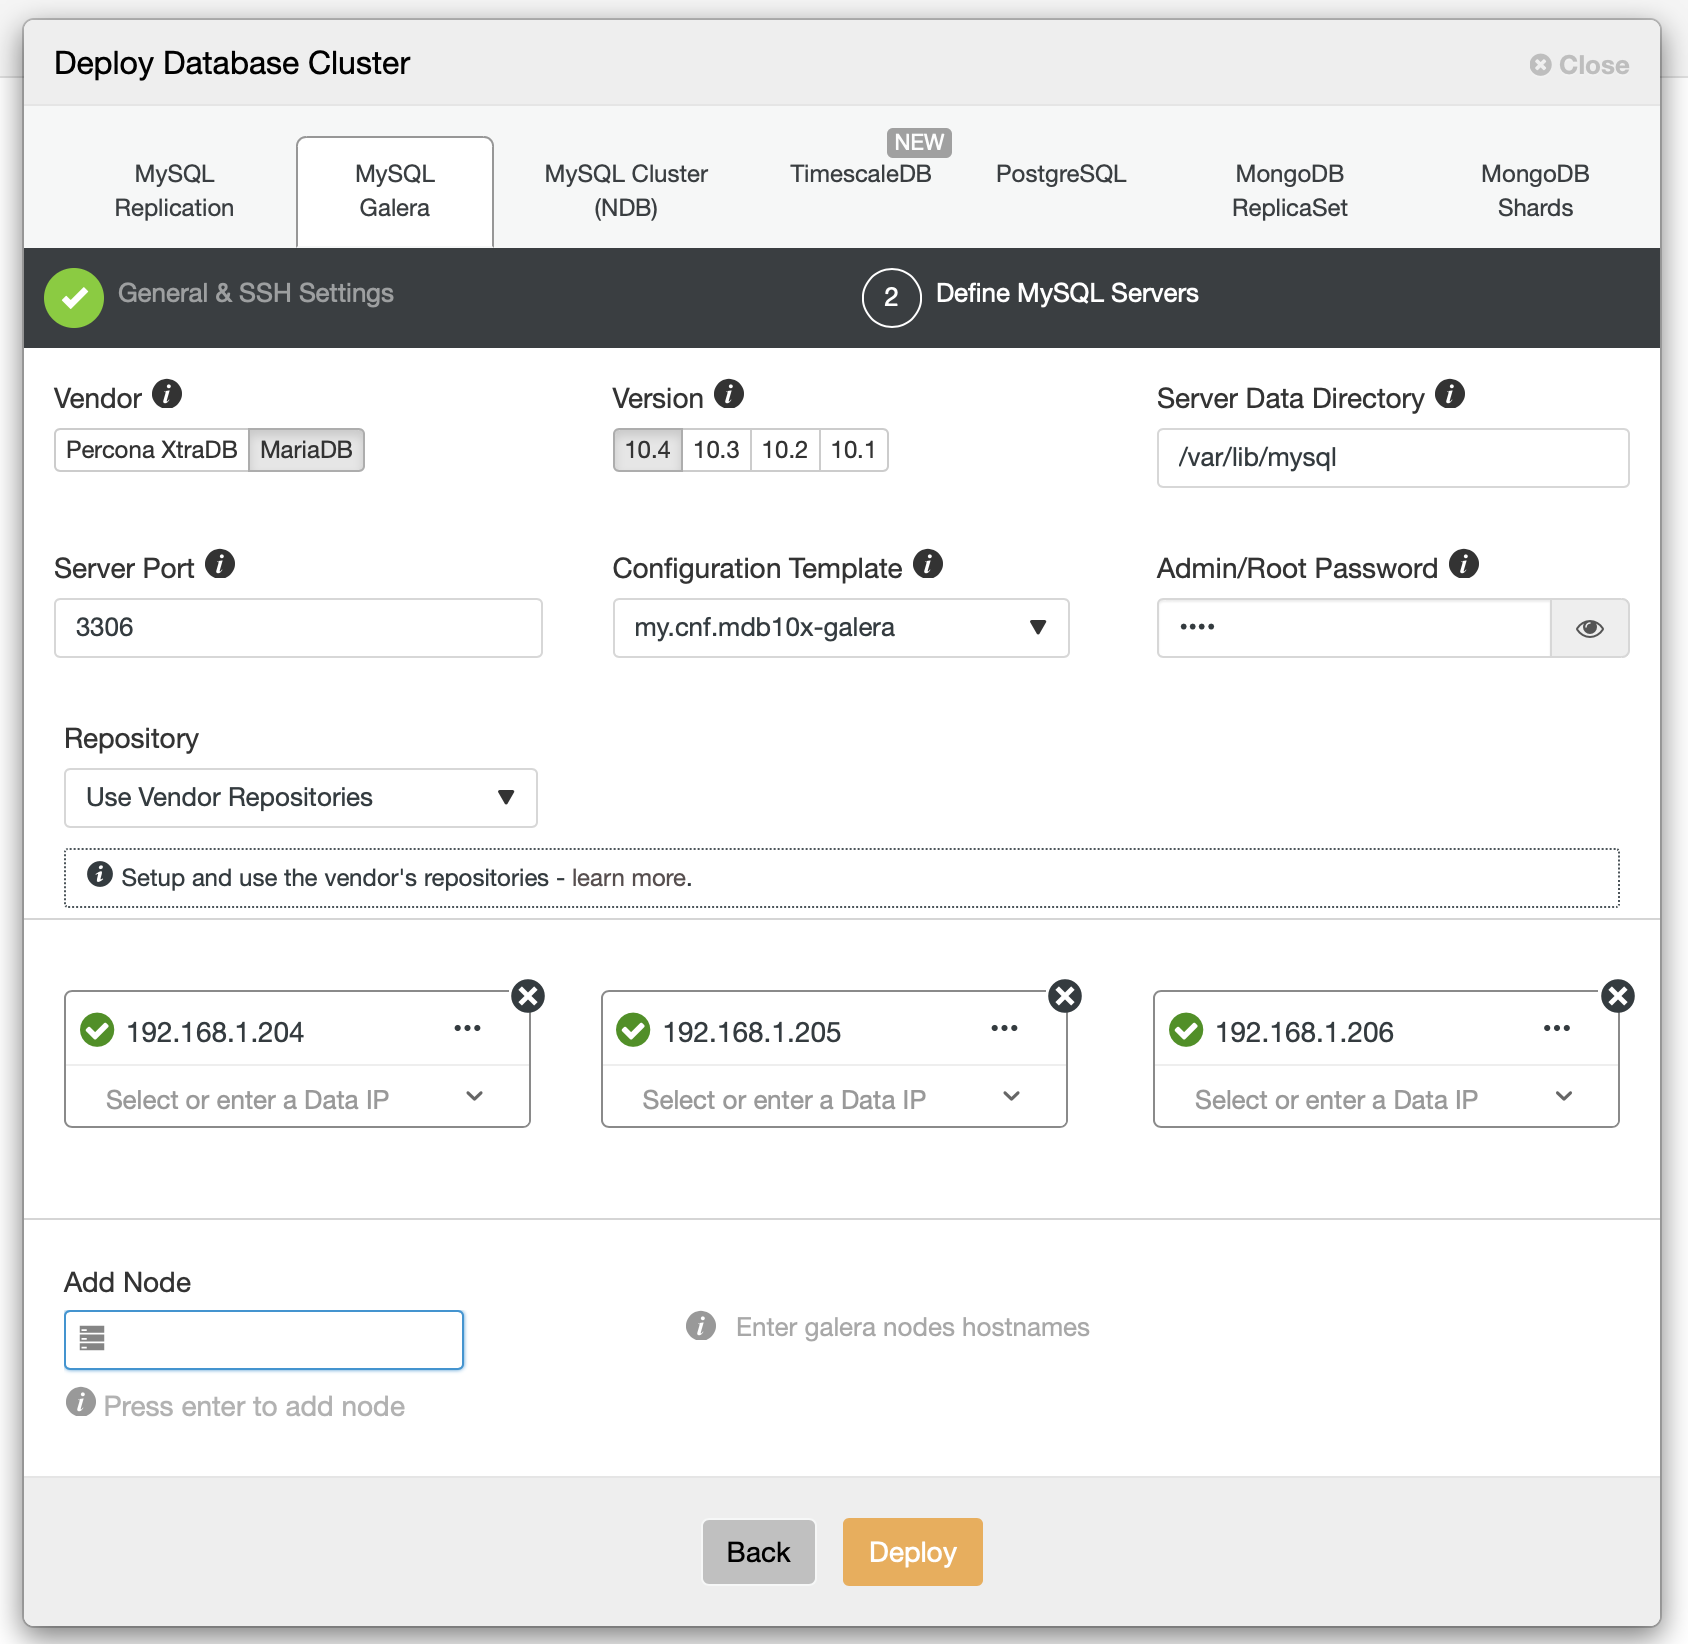
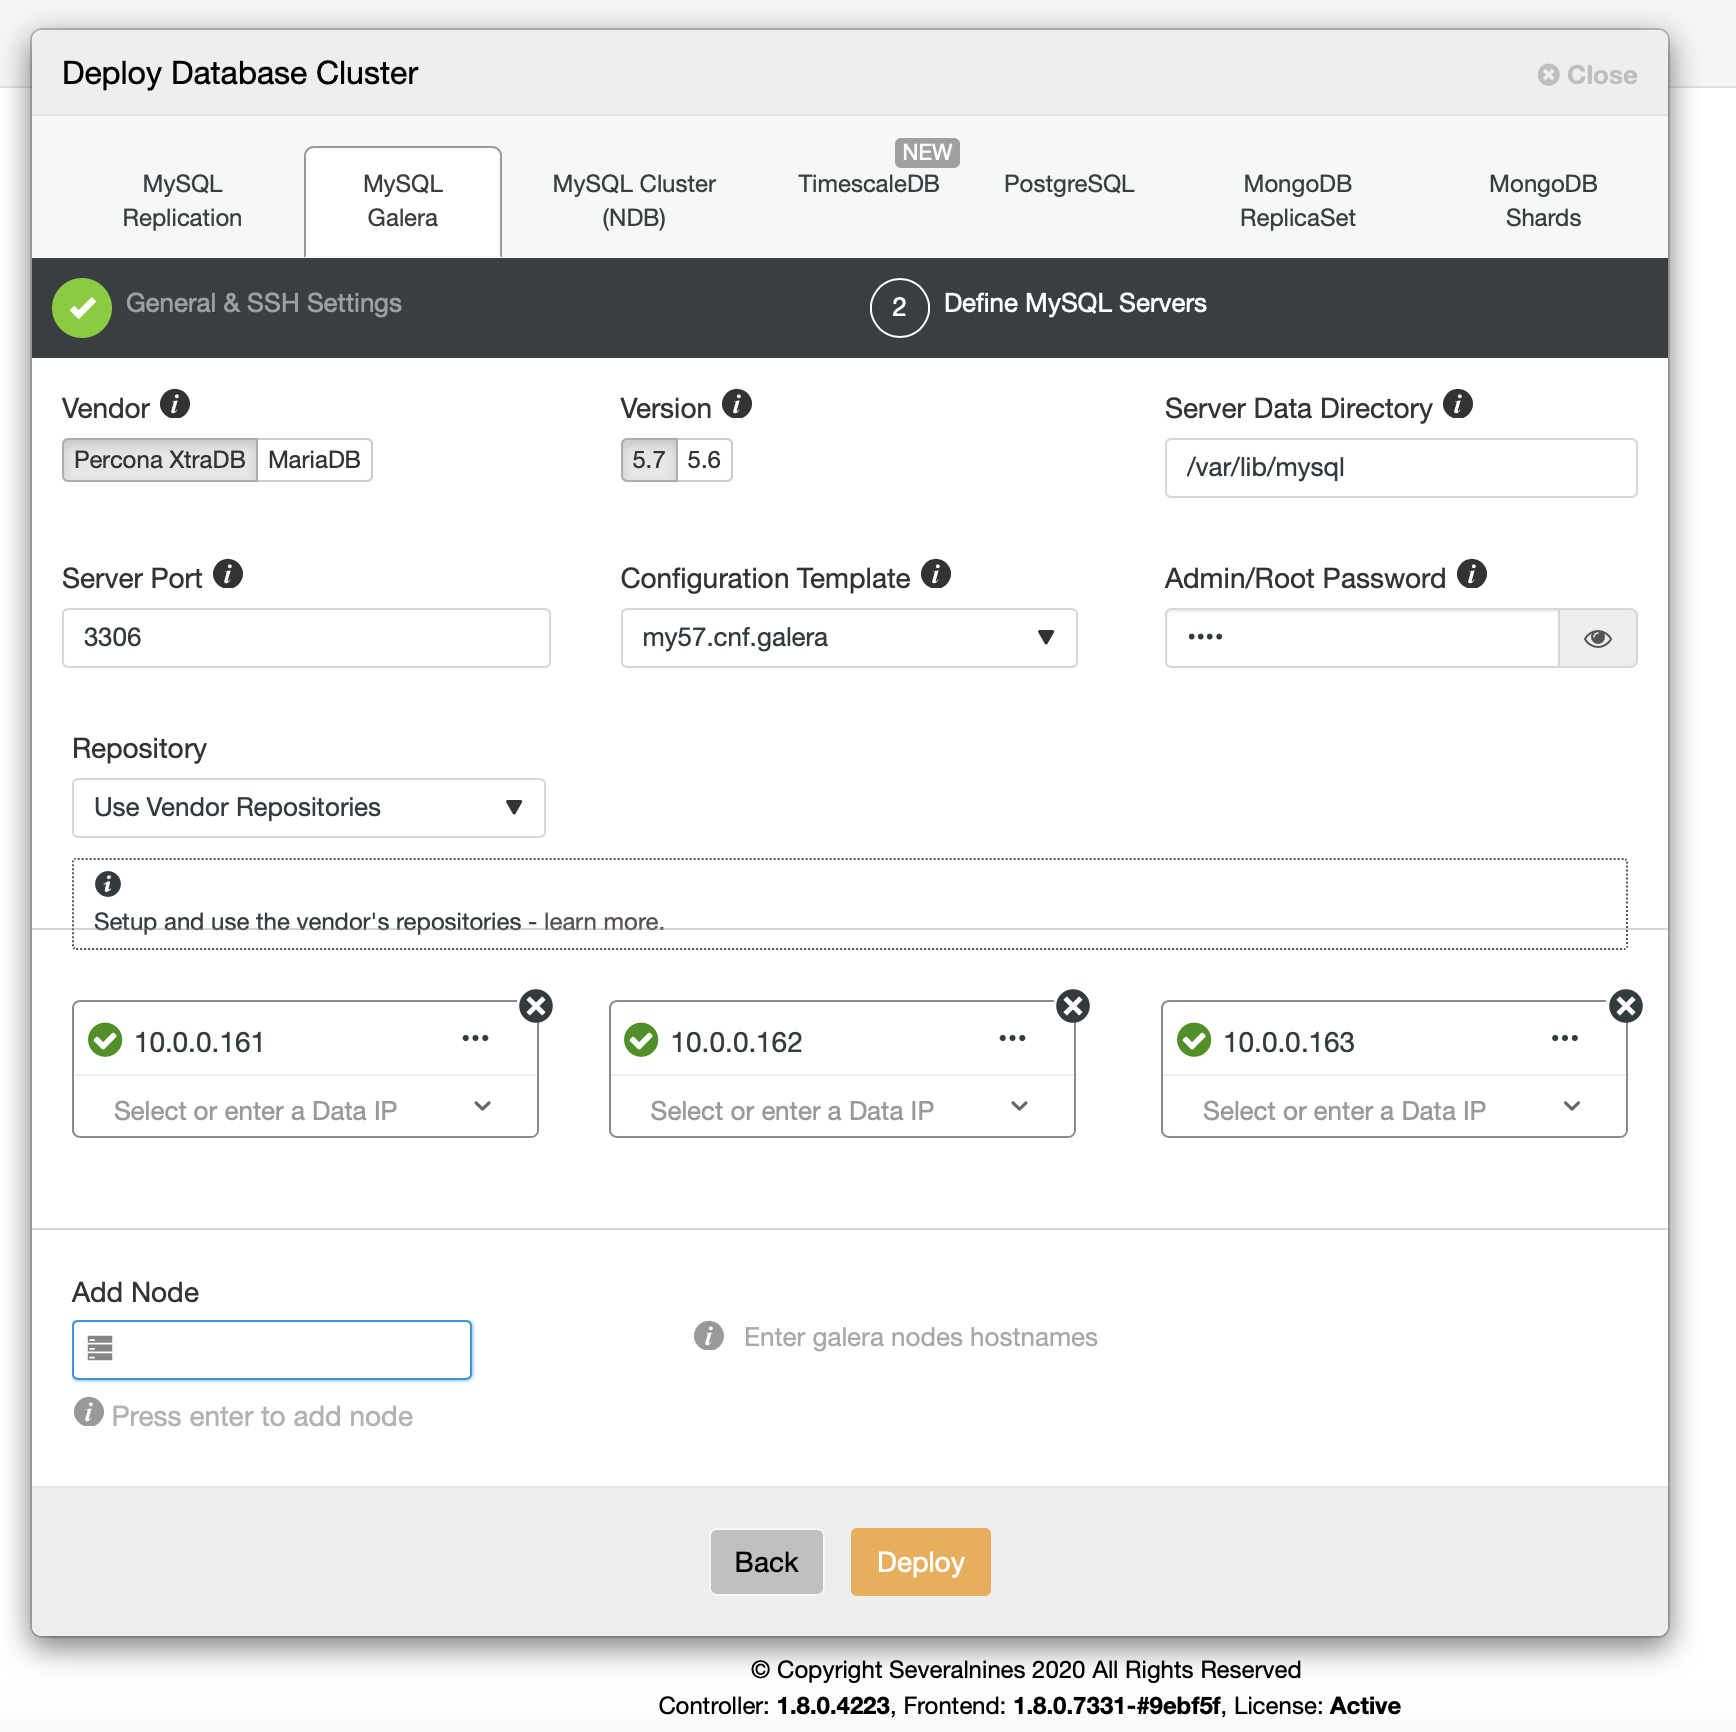
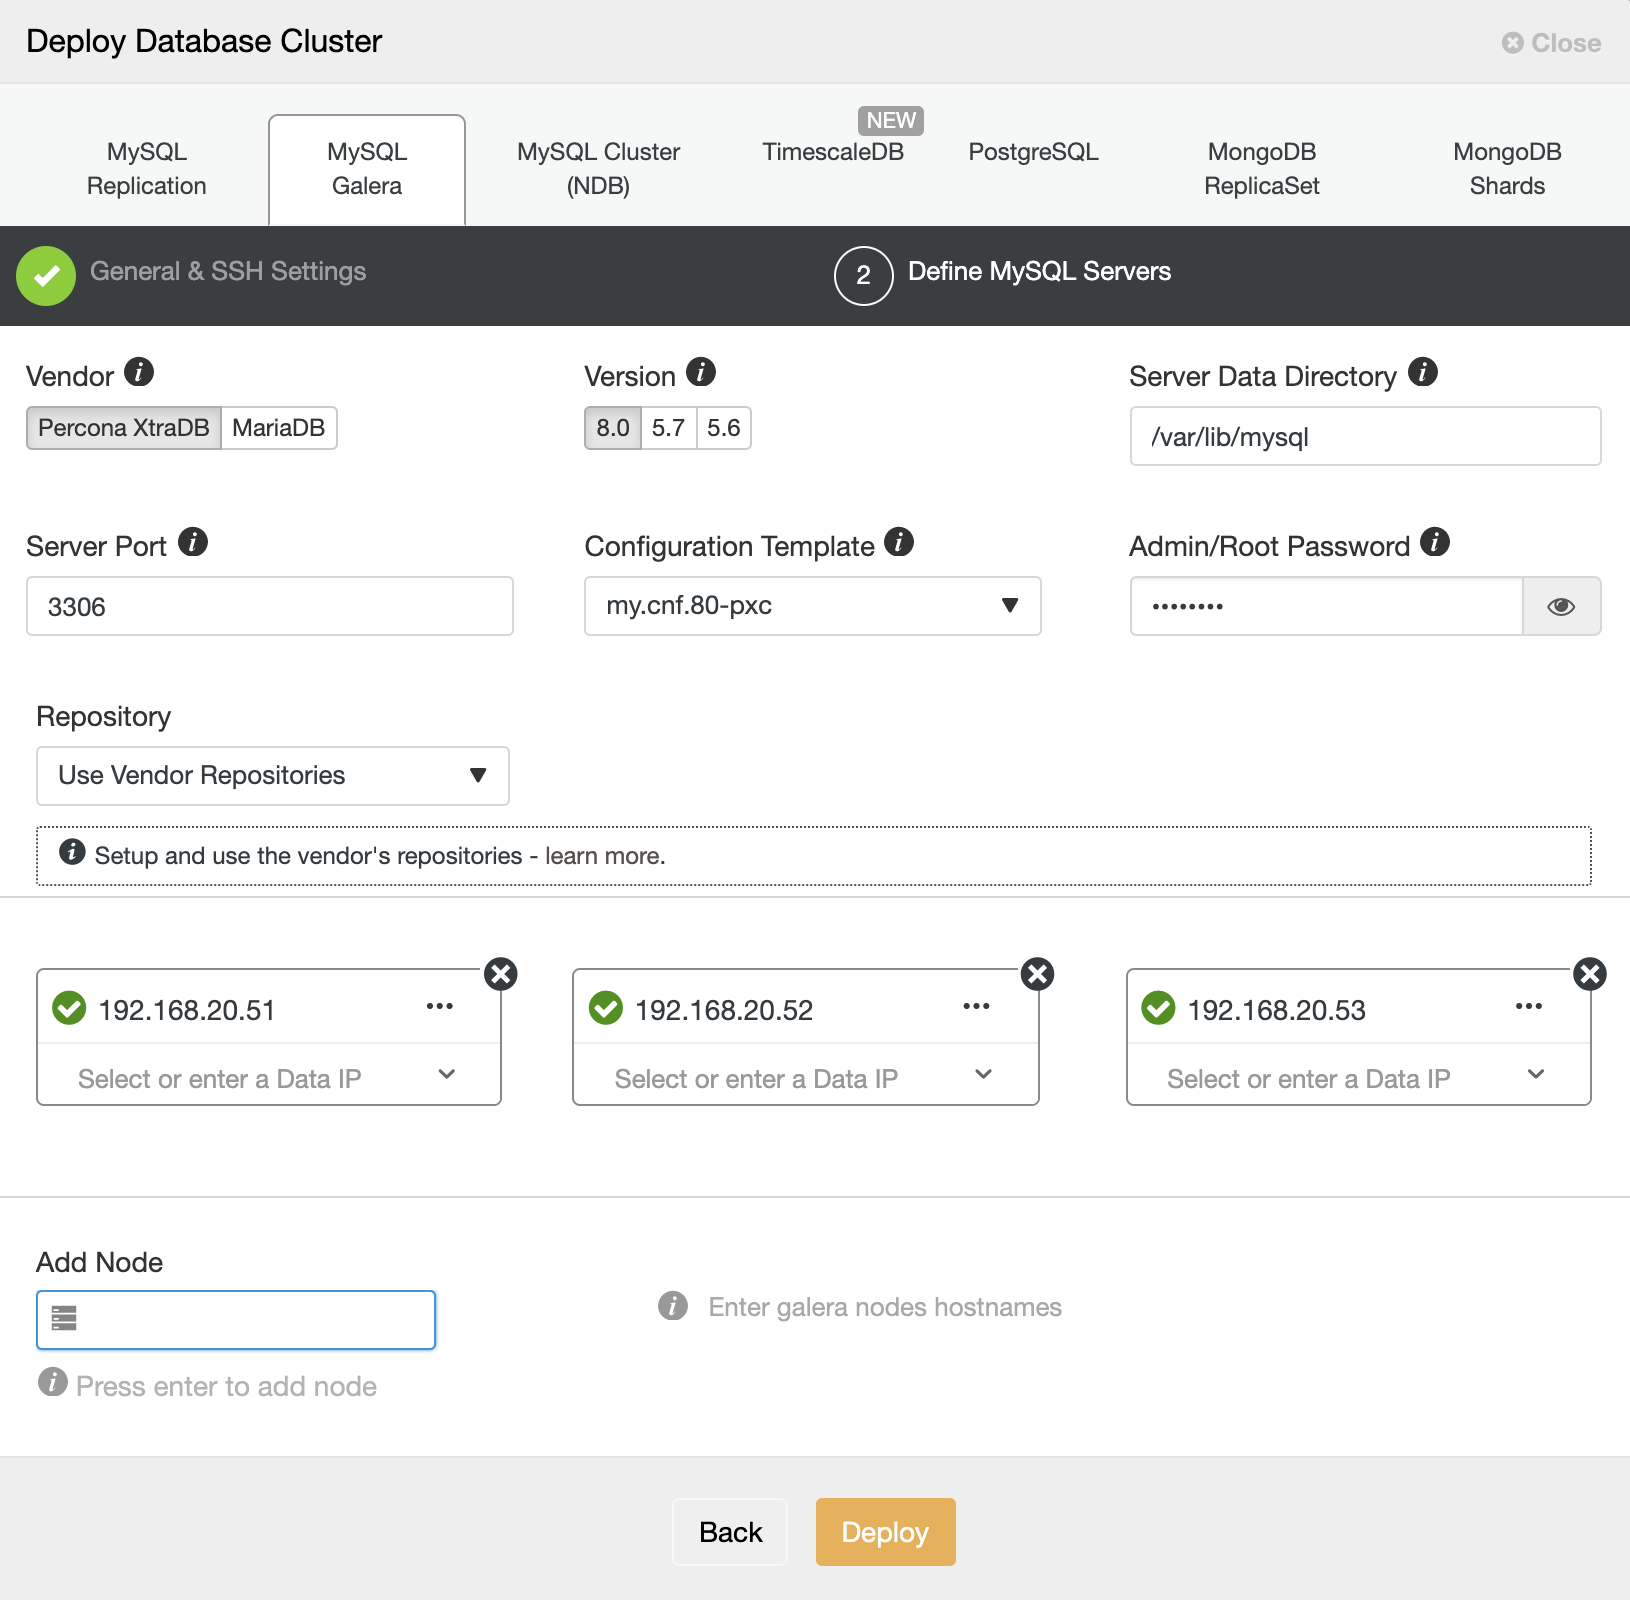
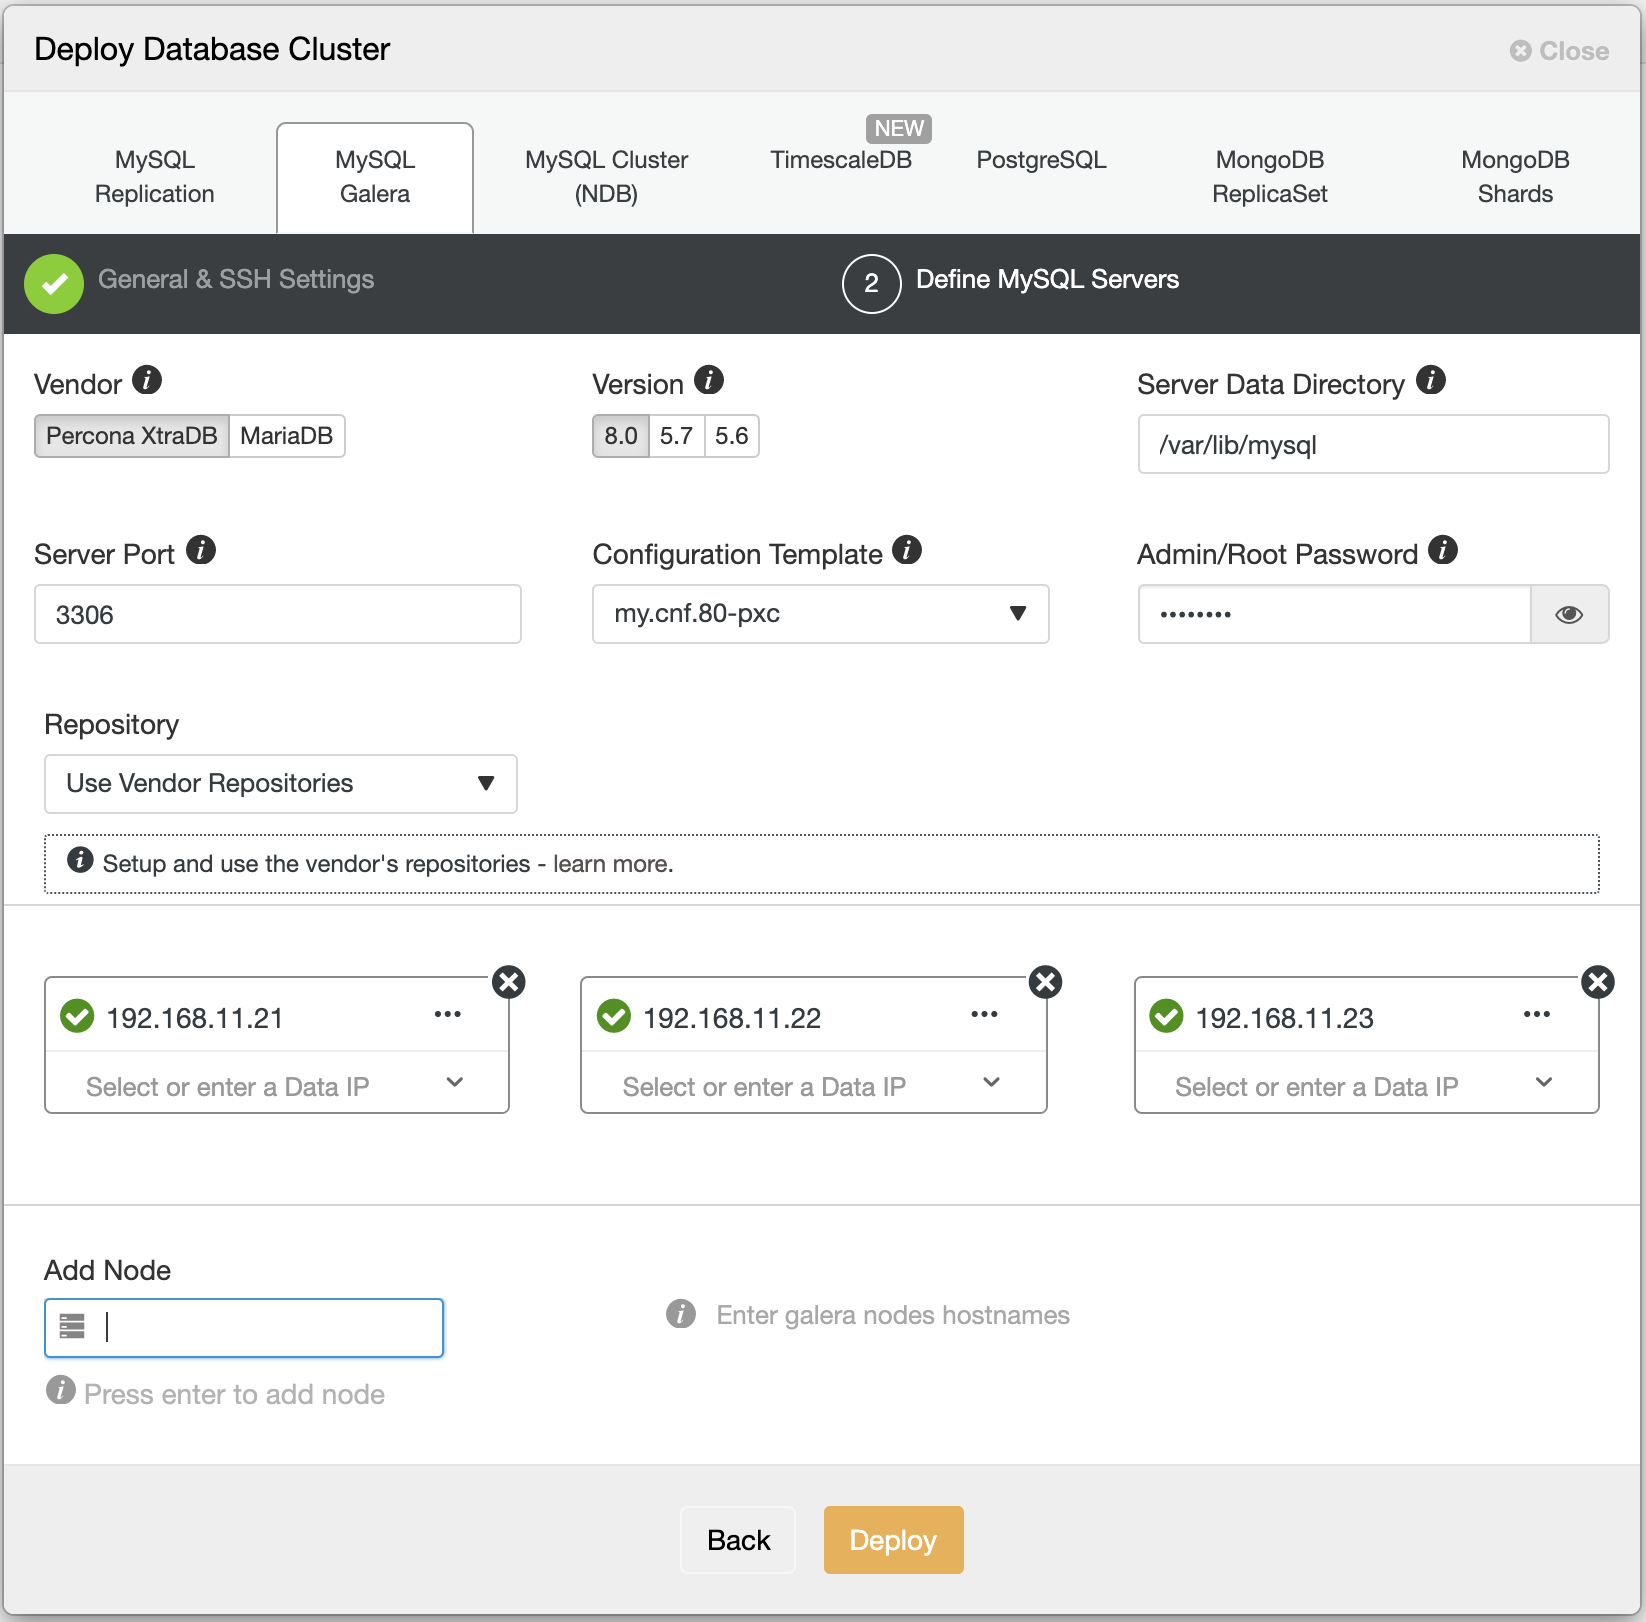
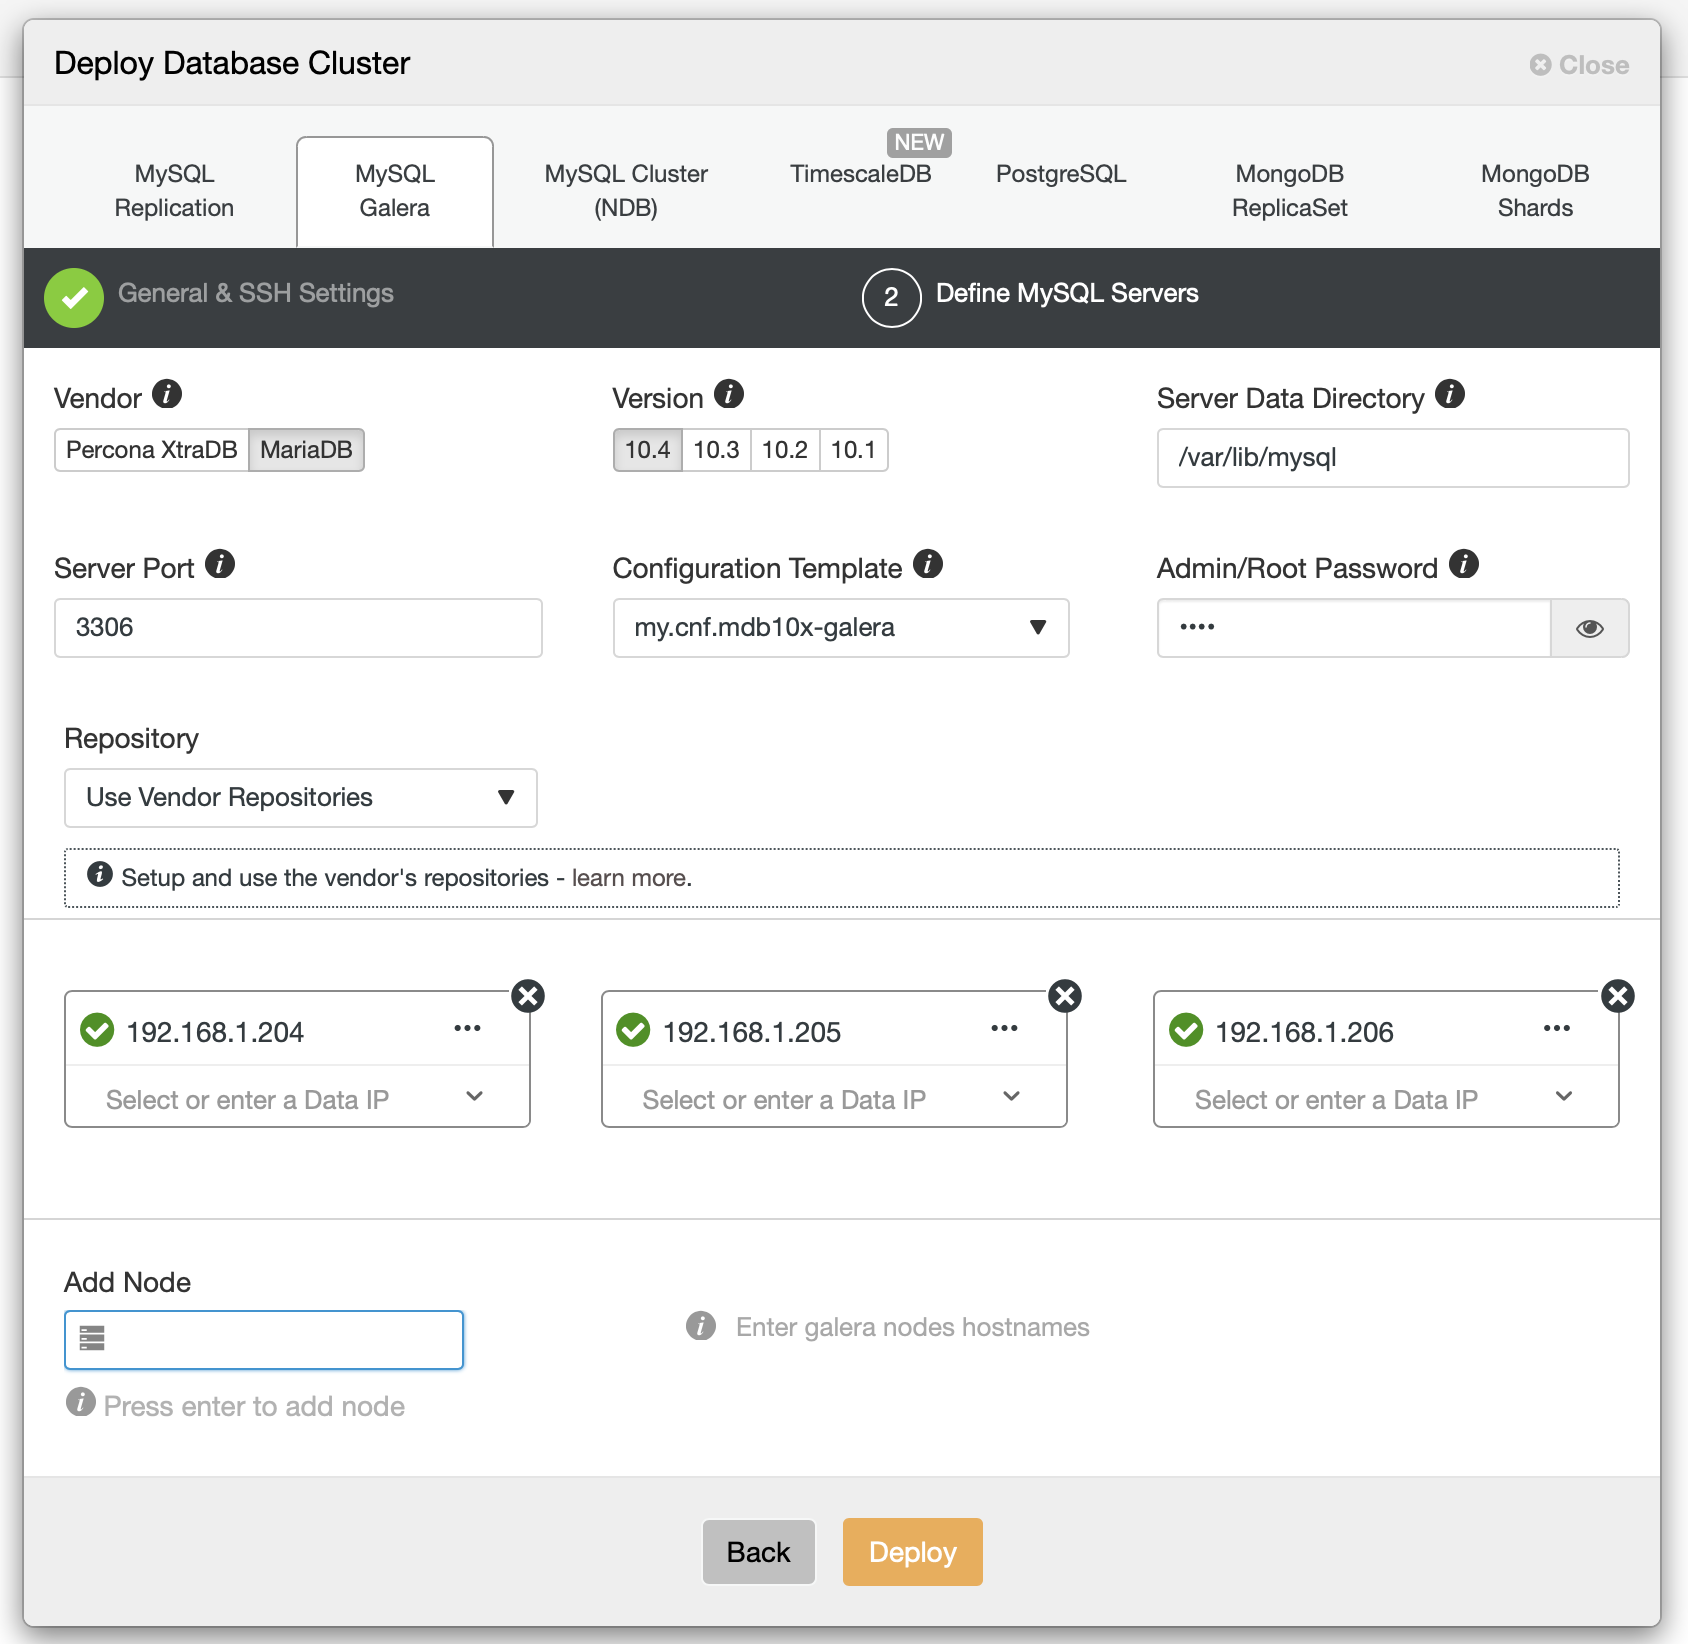
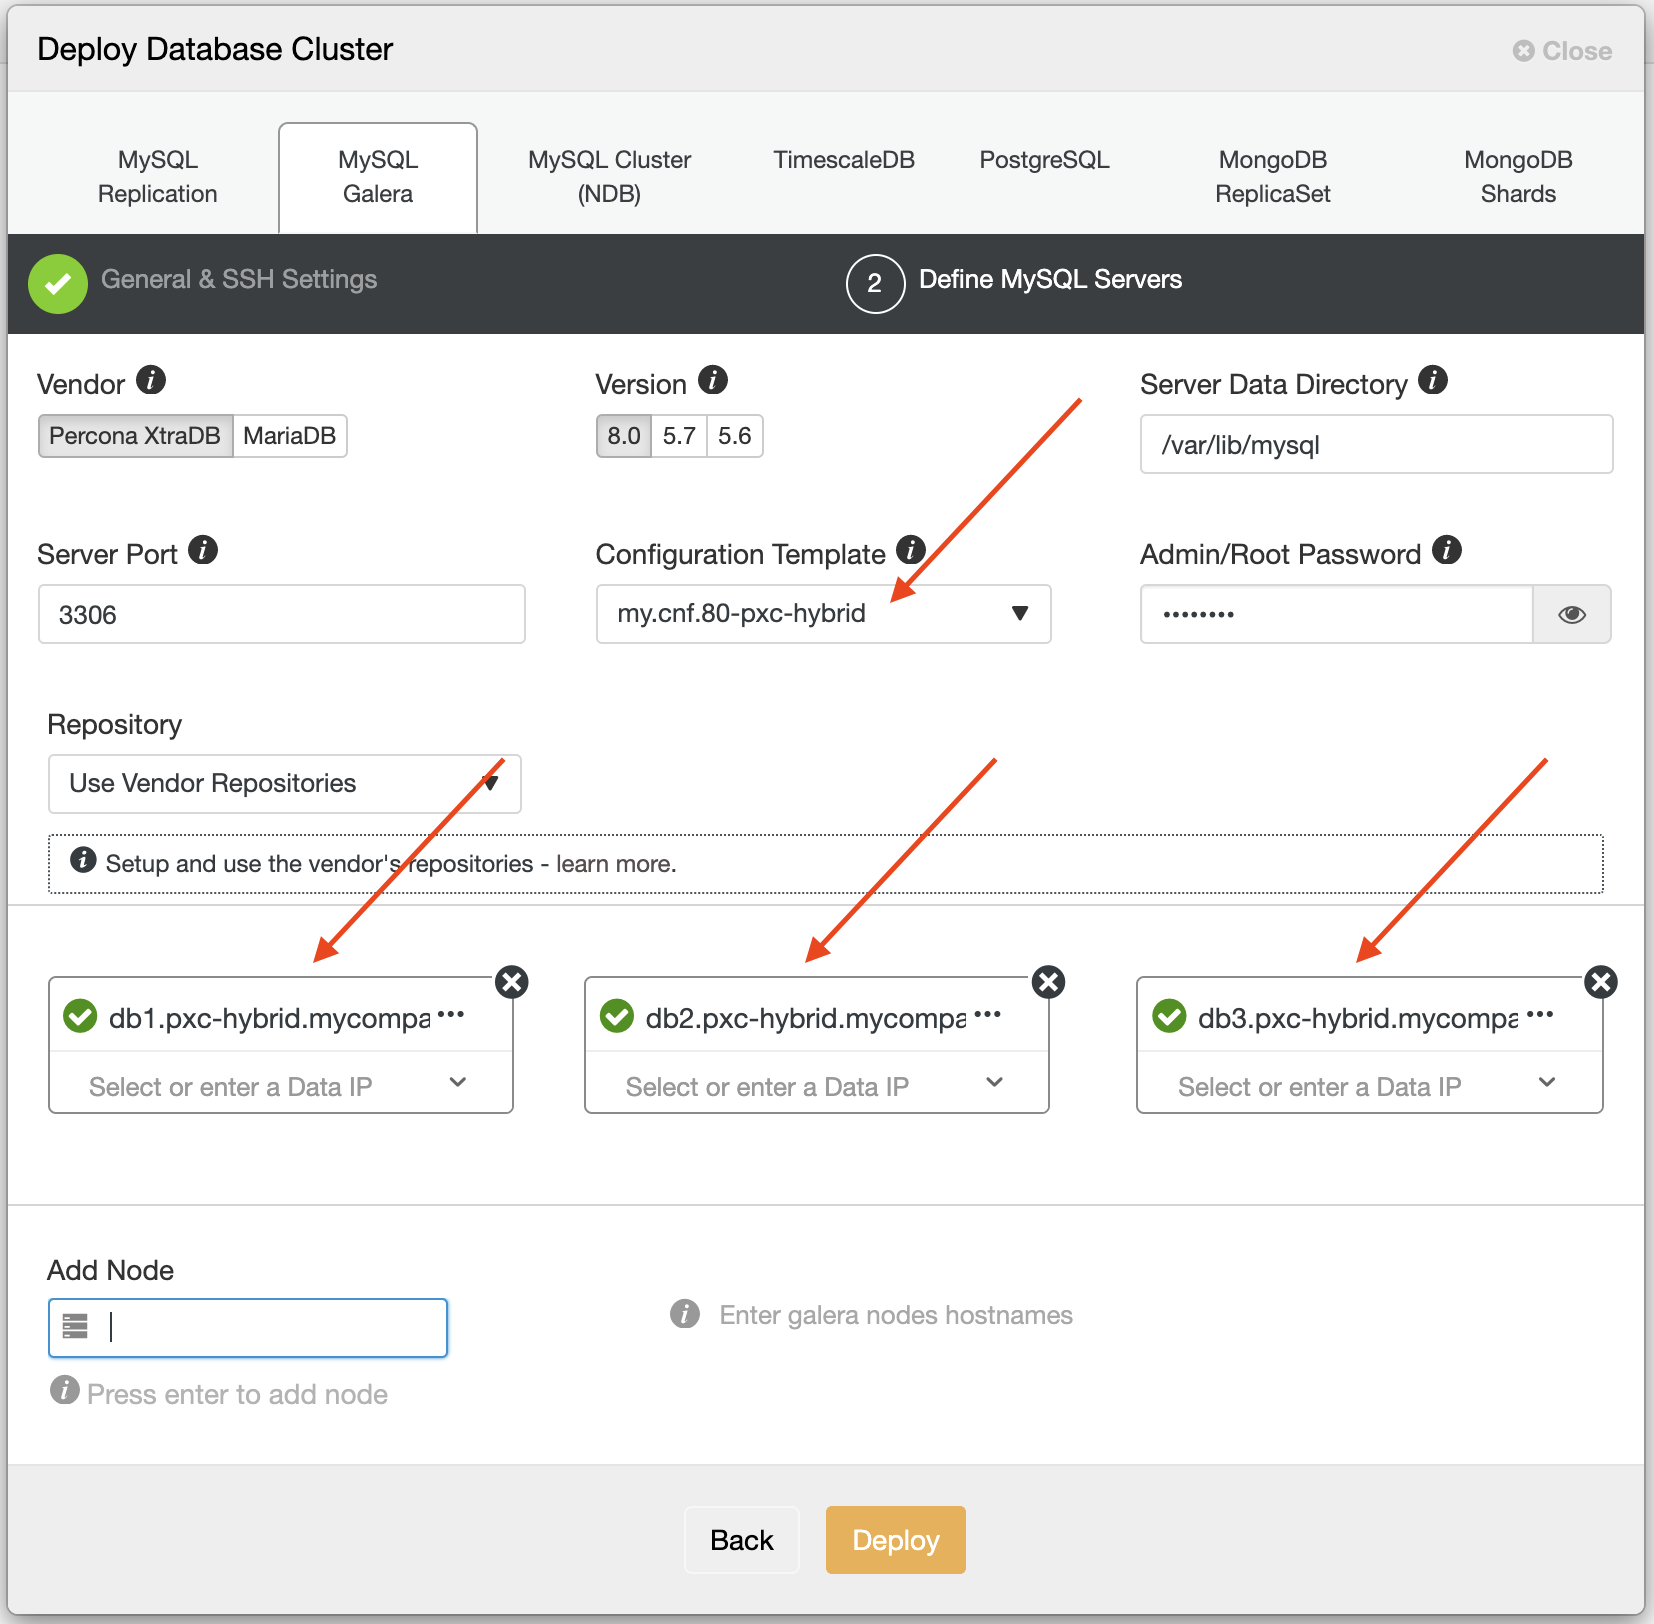
For MariaDB Cluster, you need at least 3 hosts for target database nodes to be installed. This is because it has to be able to handle network partitioning or “split brain” syndrome. You just need to fill the ip address when Add Node when defining MySQL Servers configuration.

Do not forget to choose MariaDB as the vendor of database, database version that you want to install and fill the root password. You can also change the non default datadir to any other path.
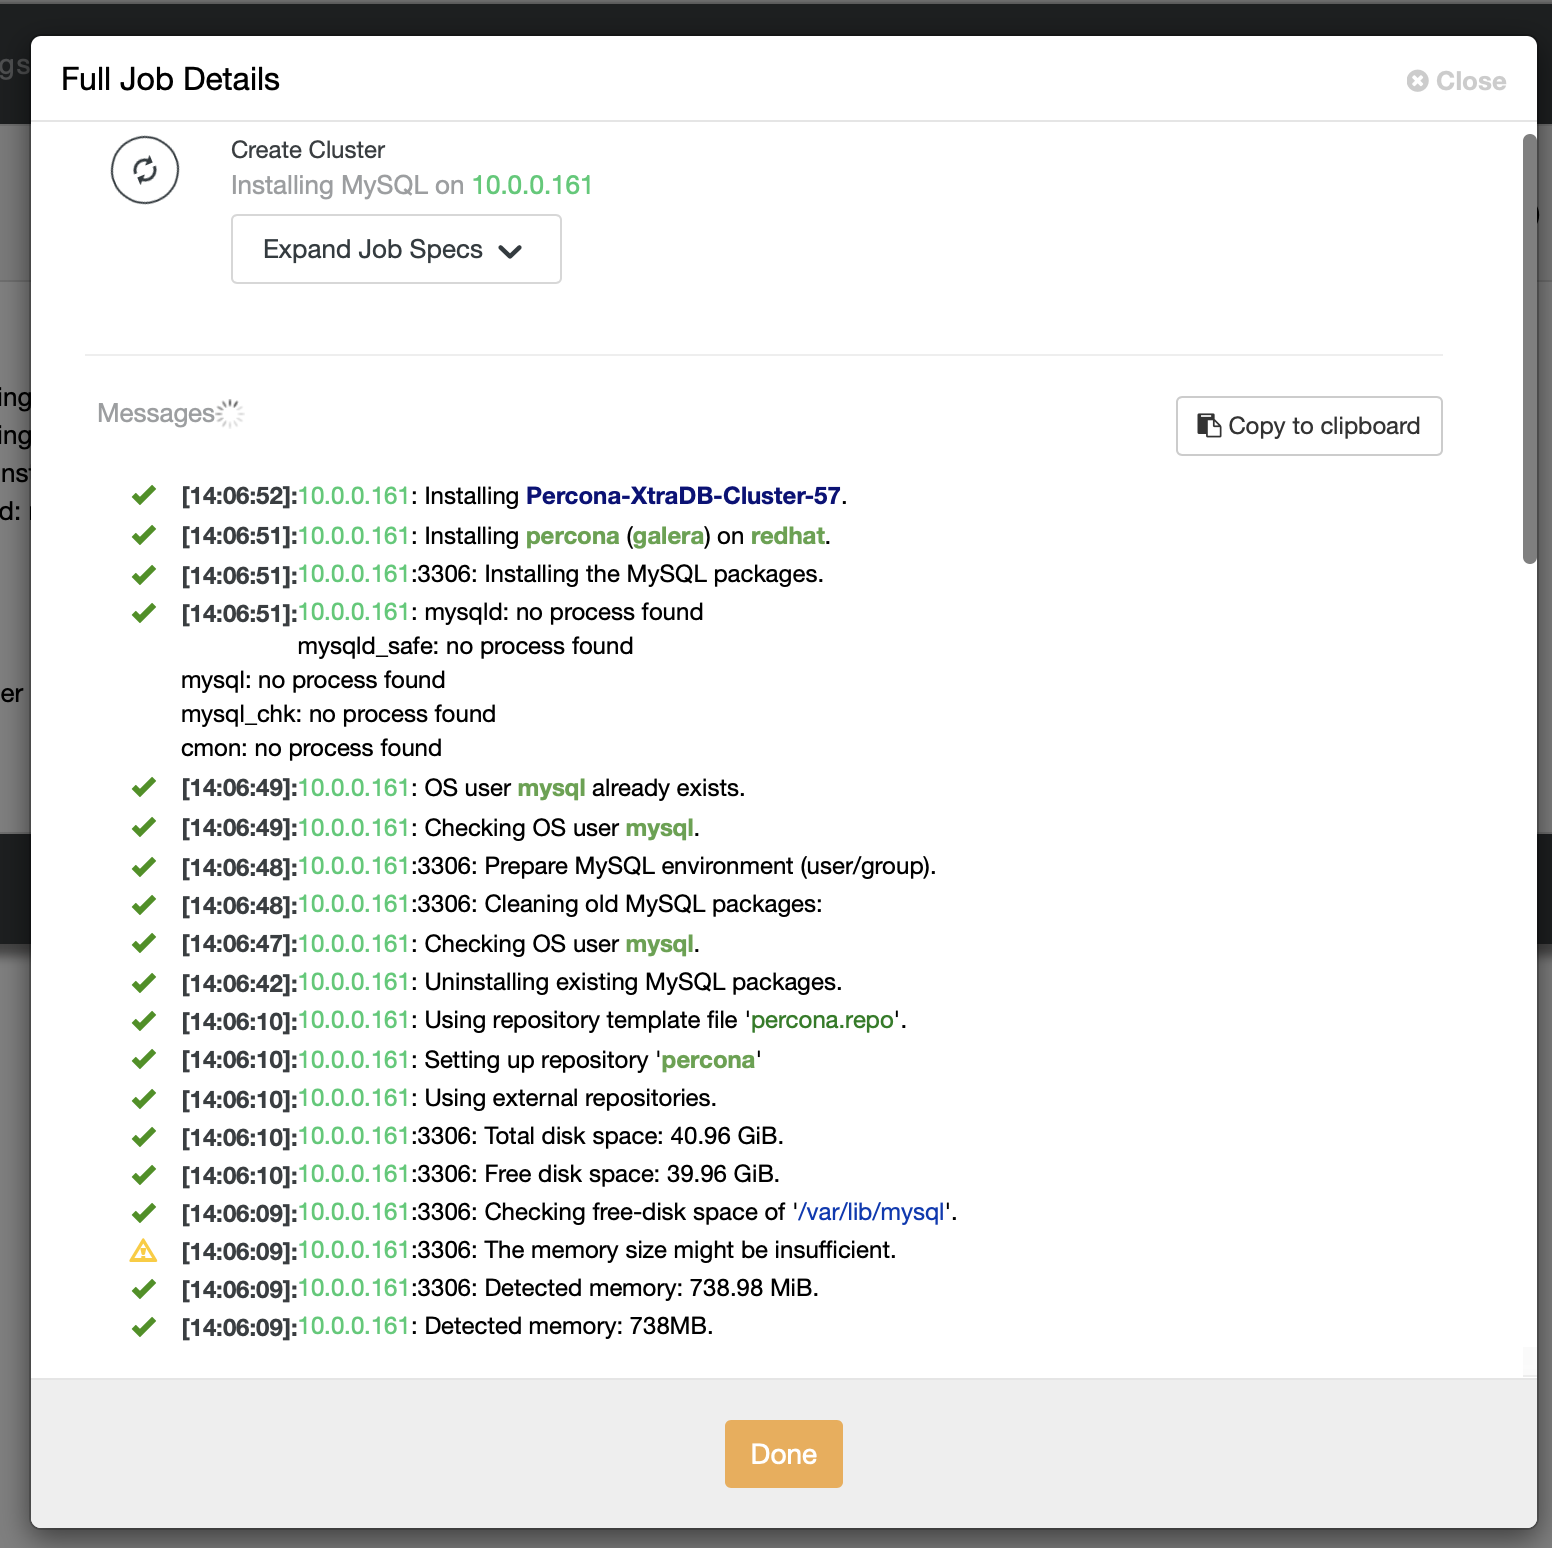
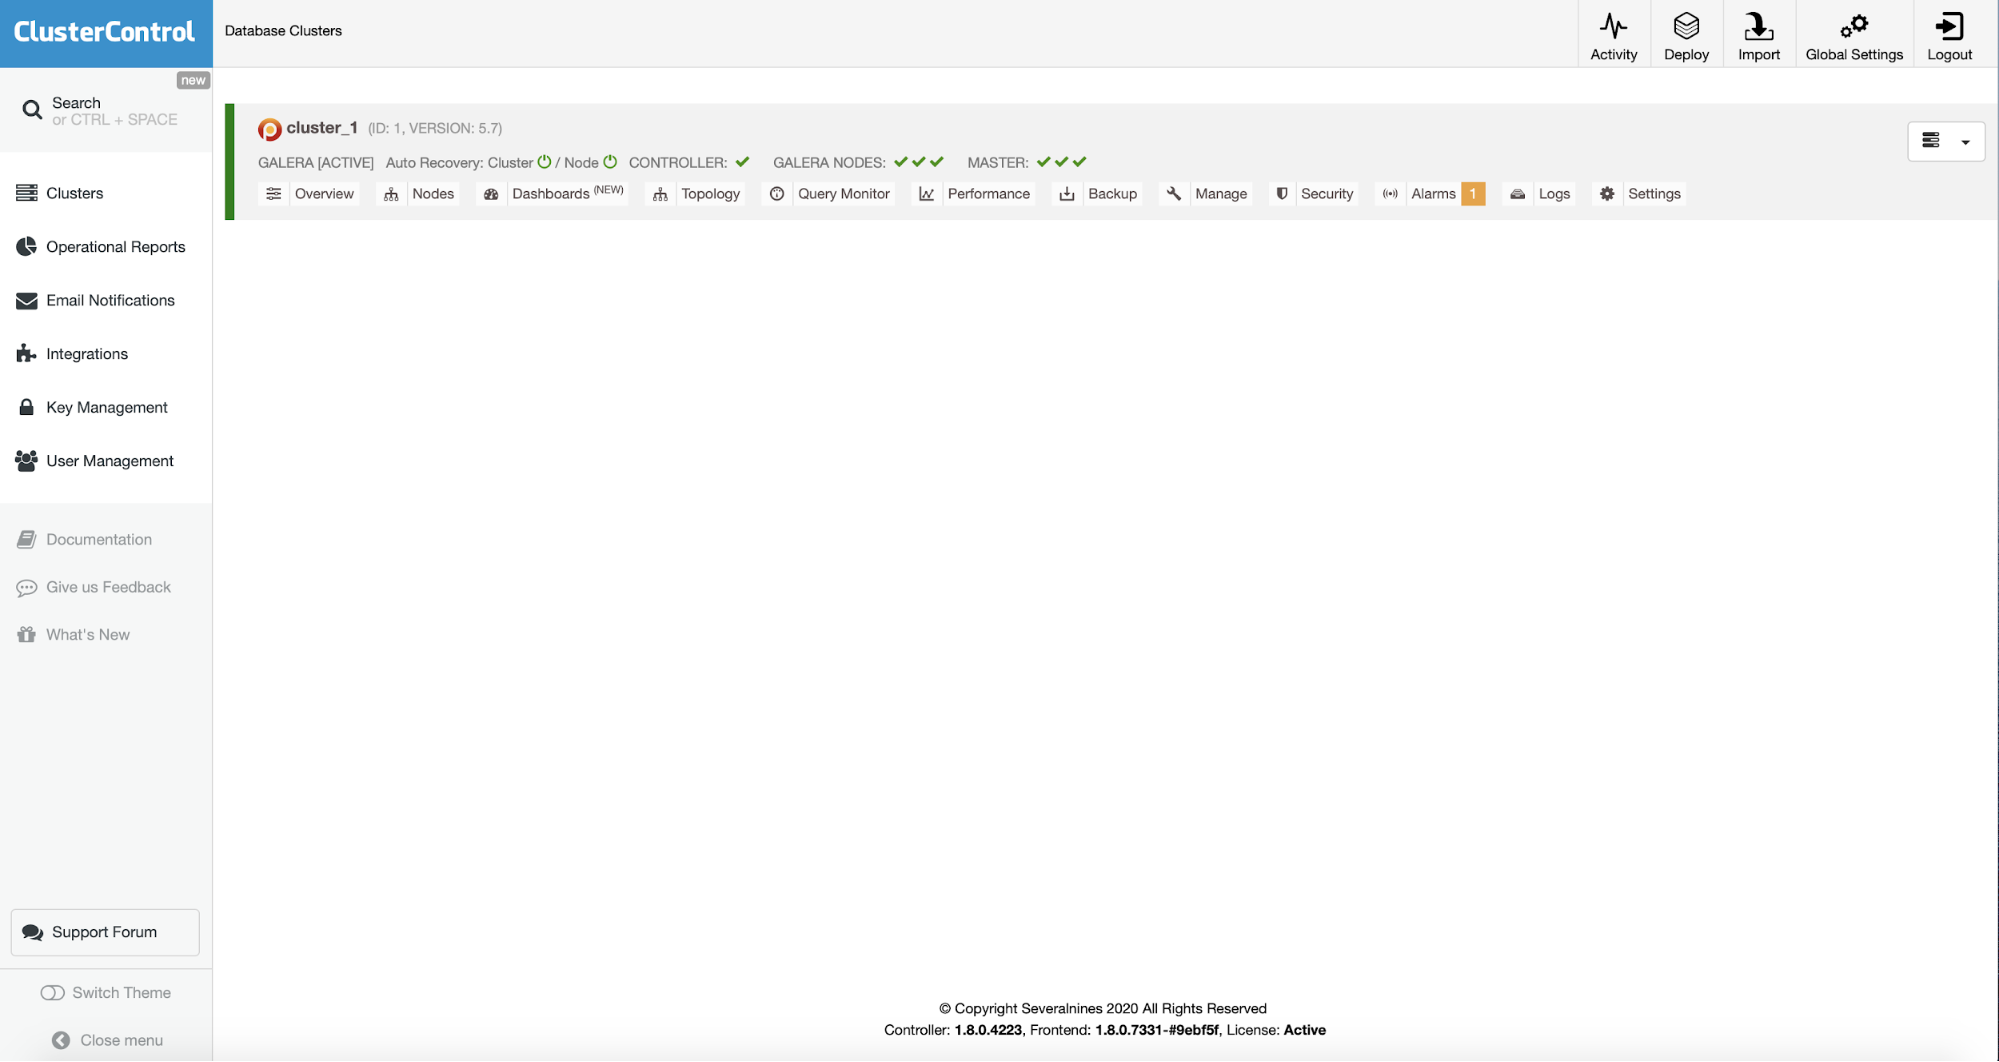
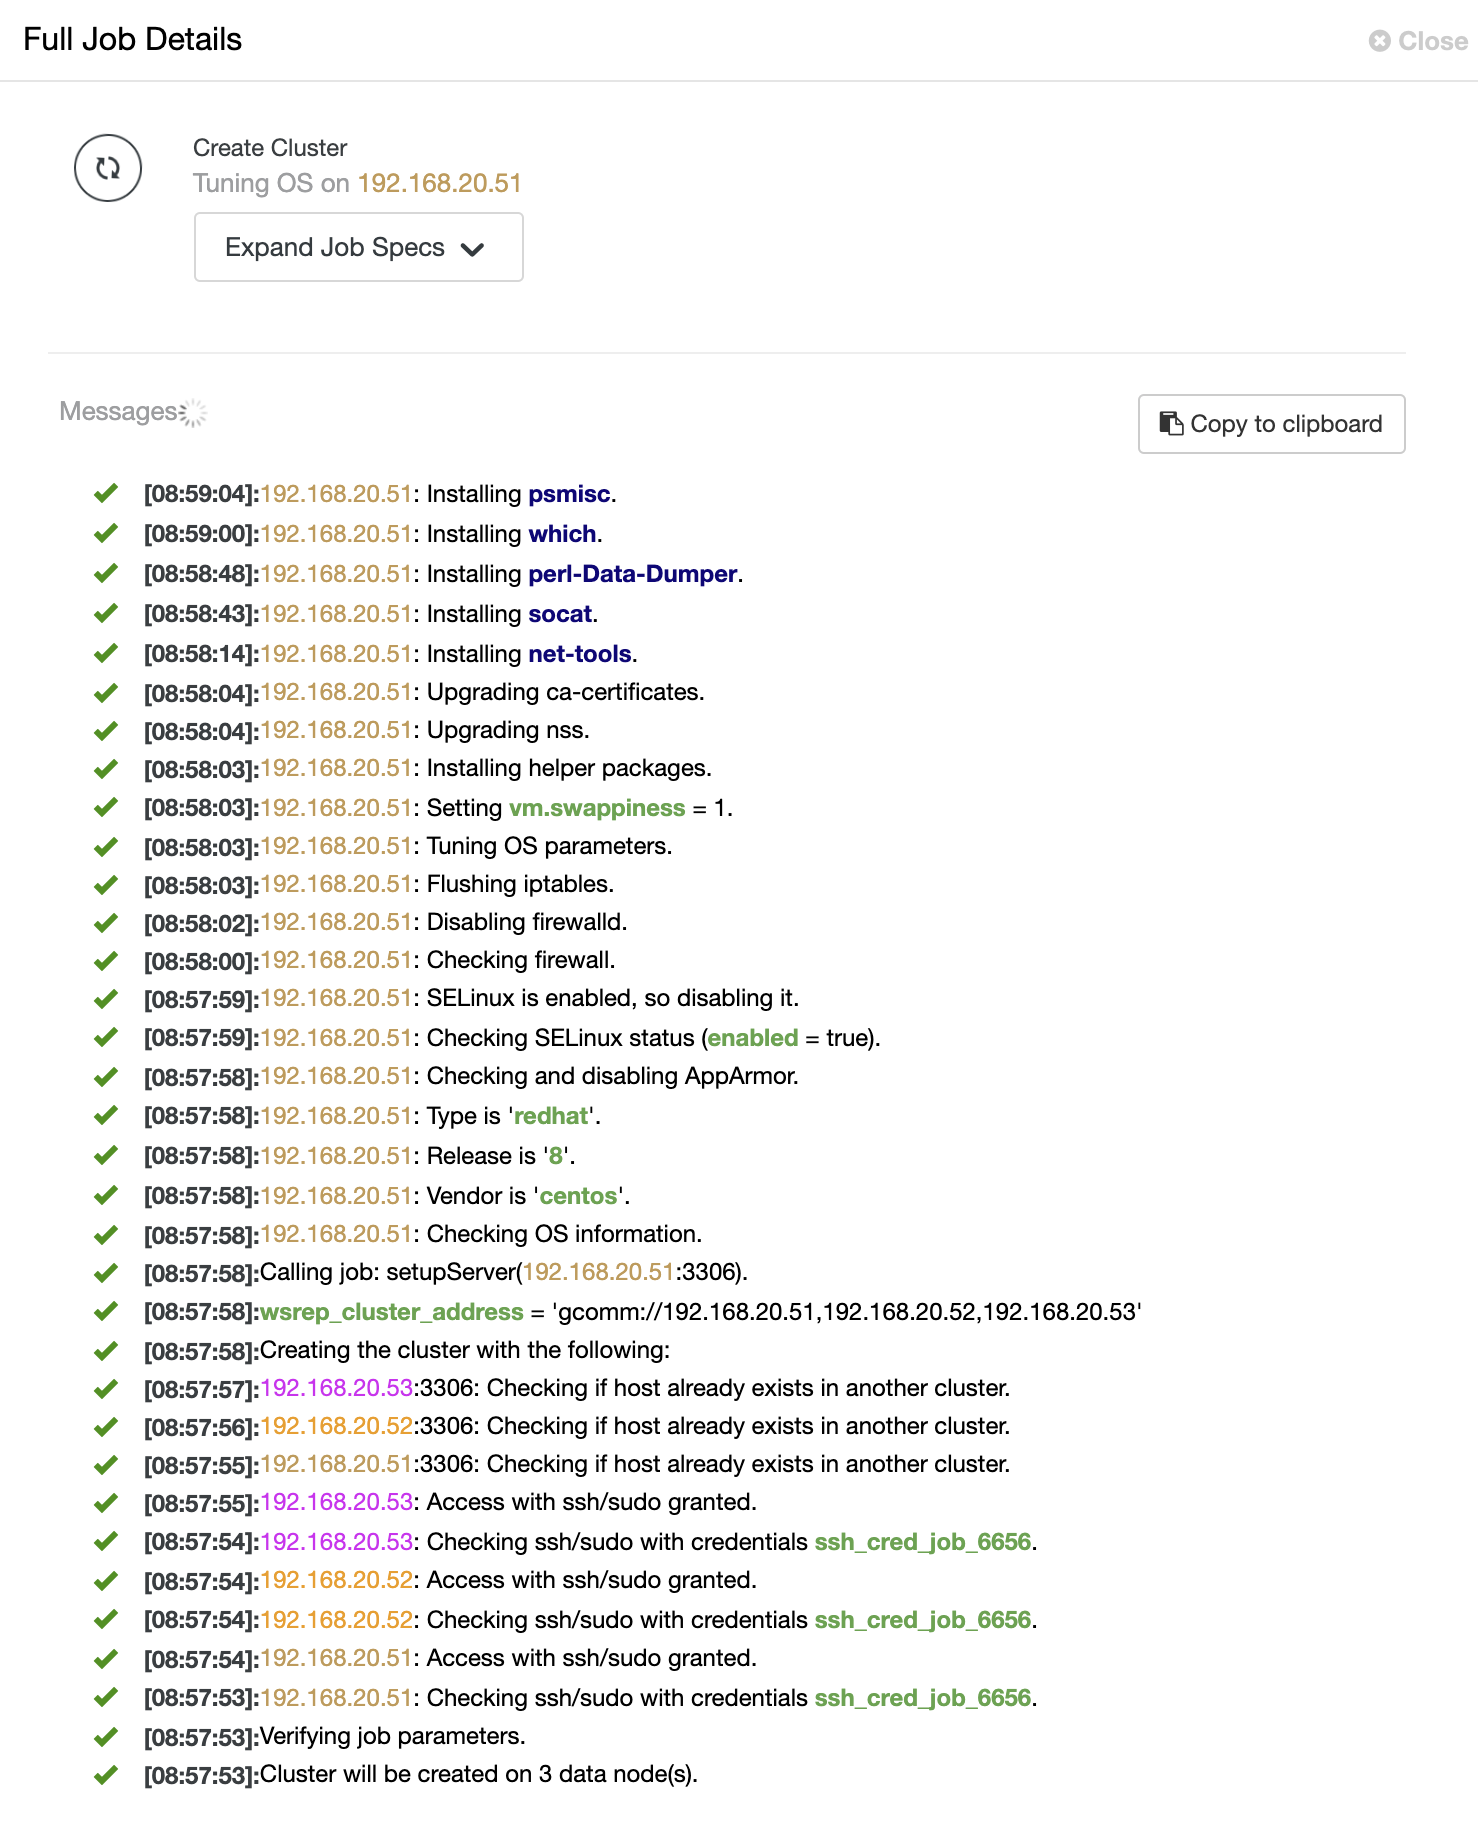
After we configure all of the things, just deploy the cluster. It will trigger a new job for database deployment.
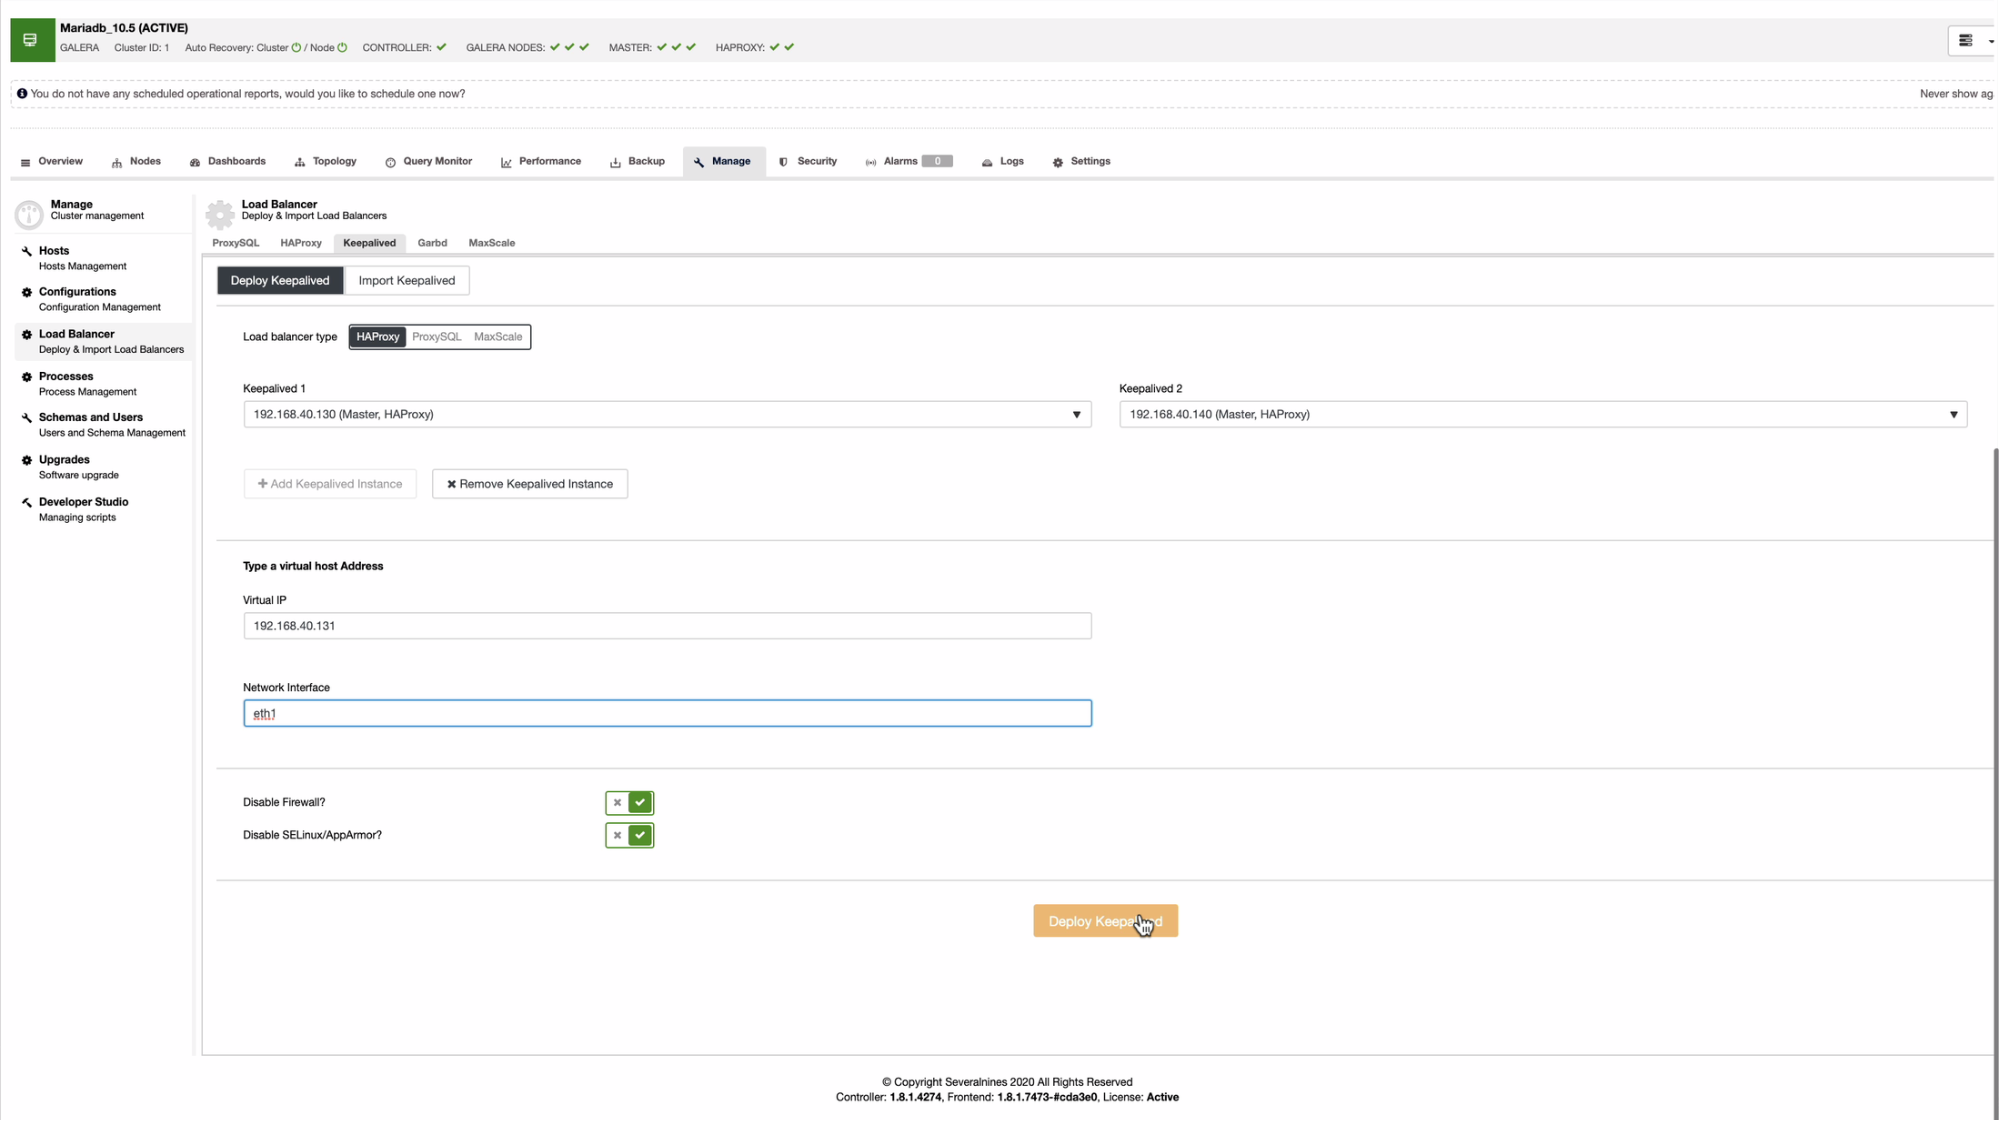
Note that it is also possible to have 2 Galera nodes and one Galera arbitrator aka garbd on a third host.
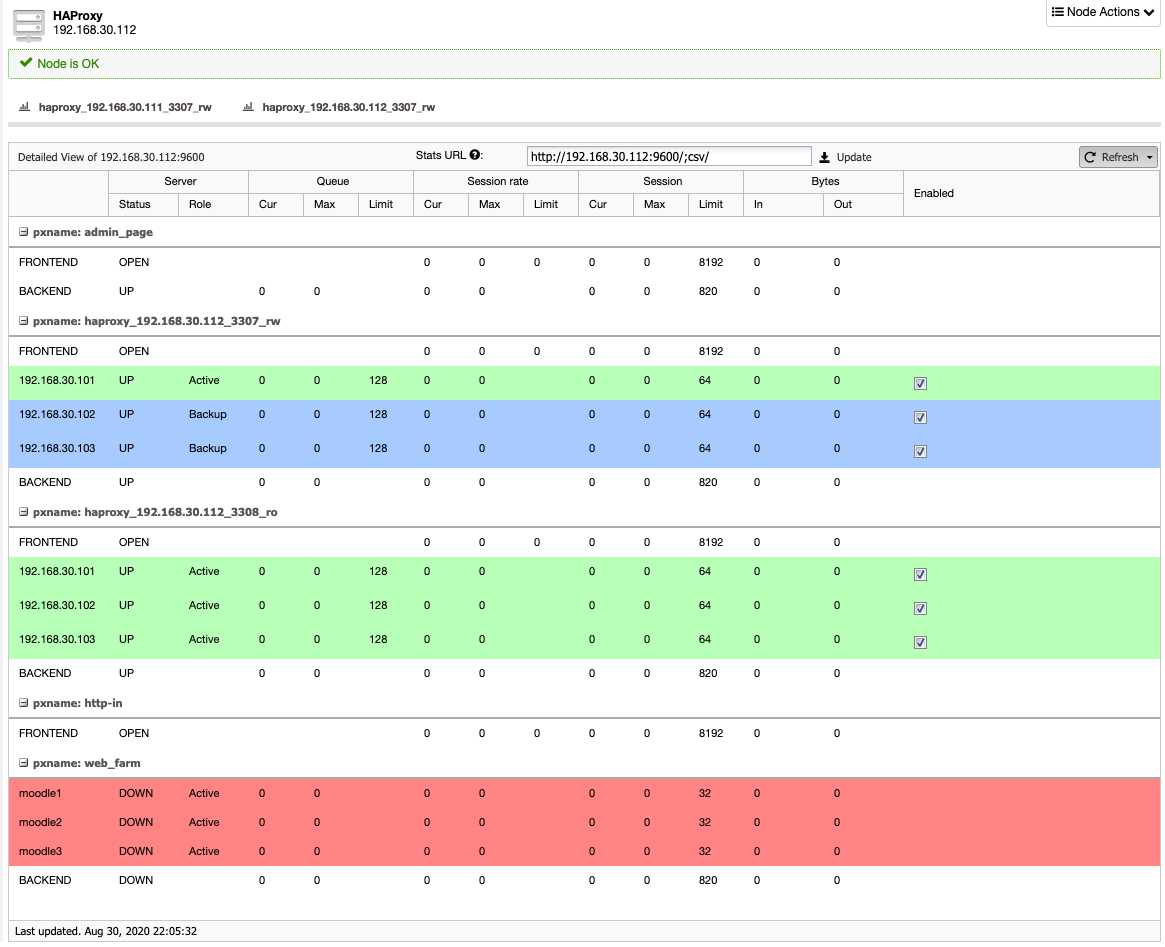
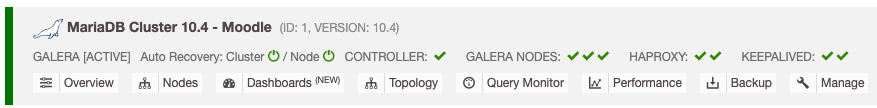
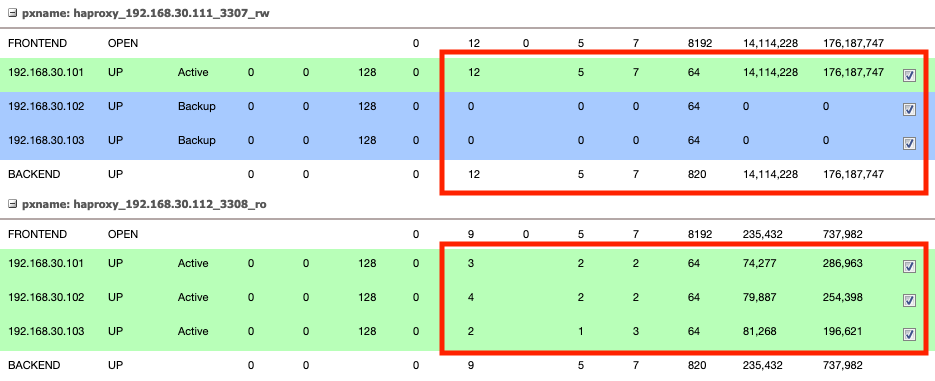
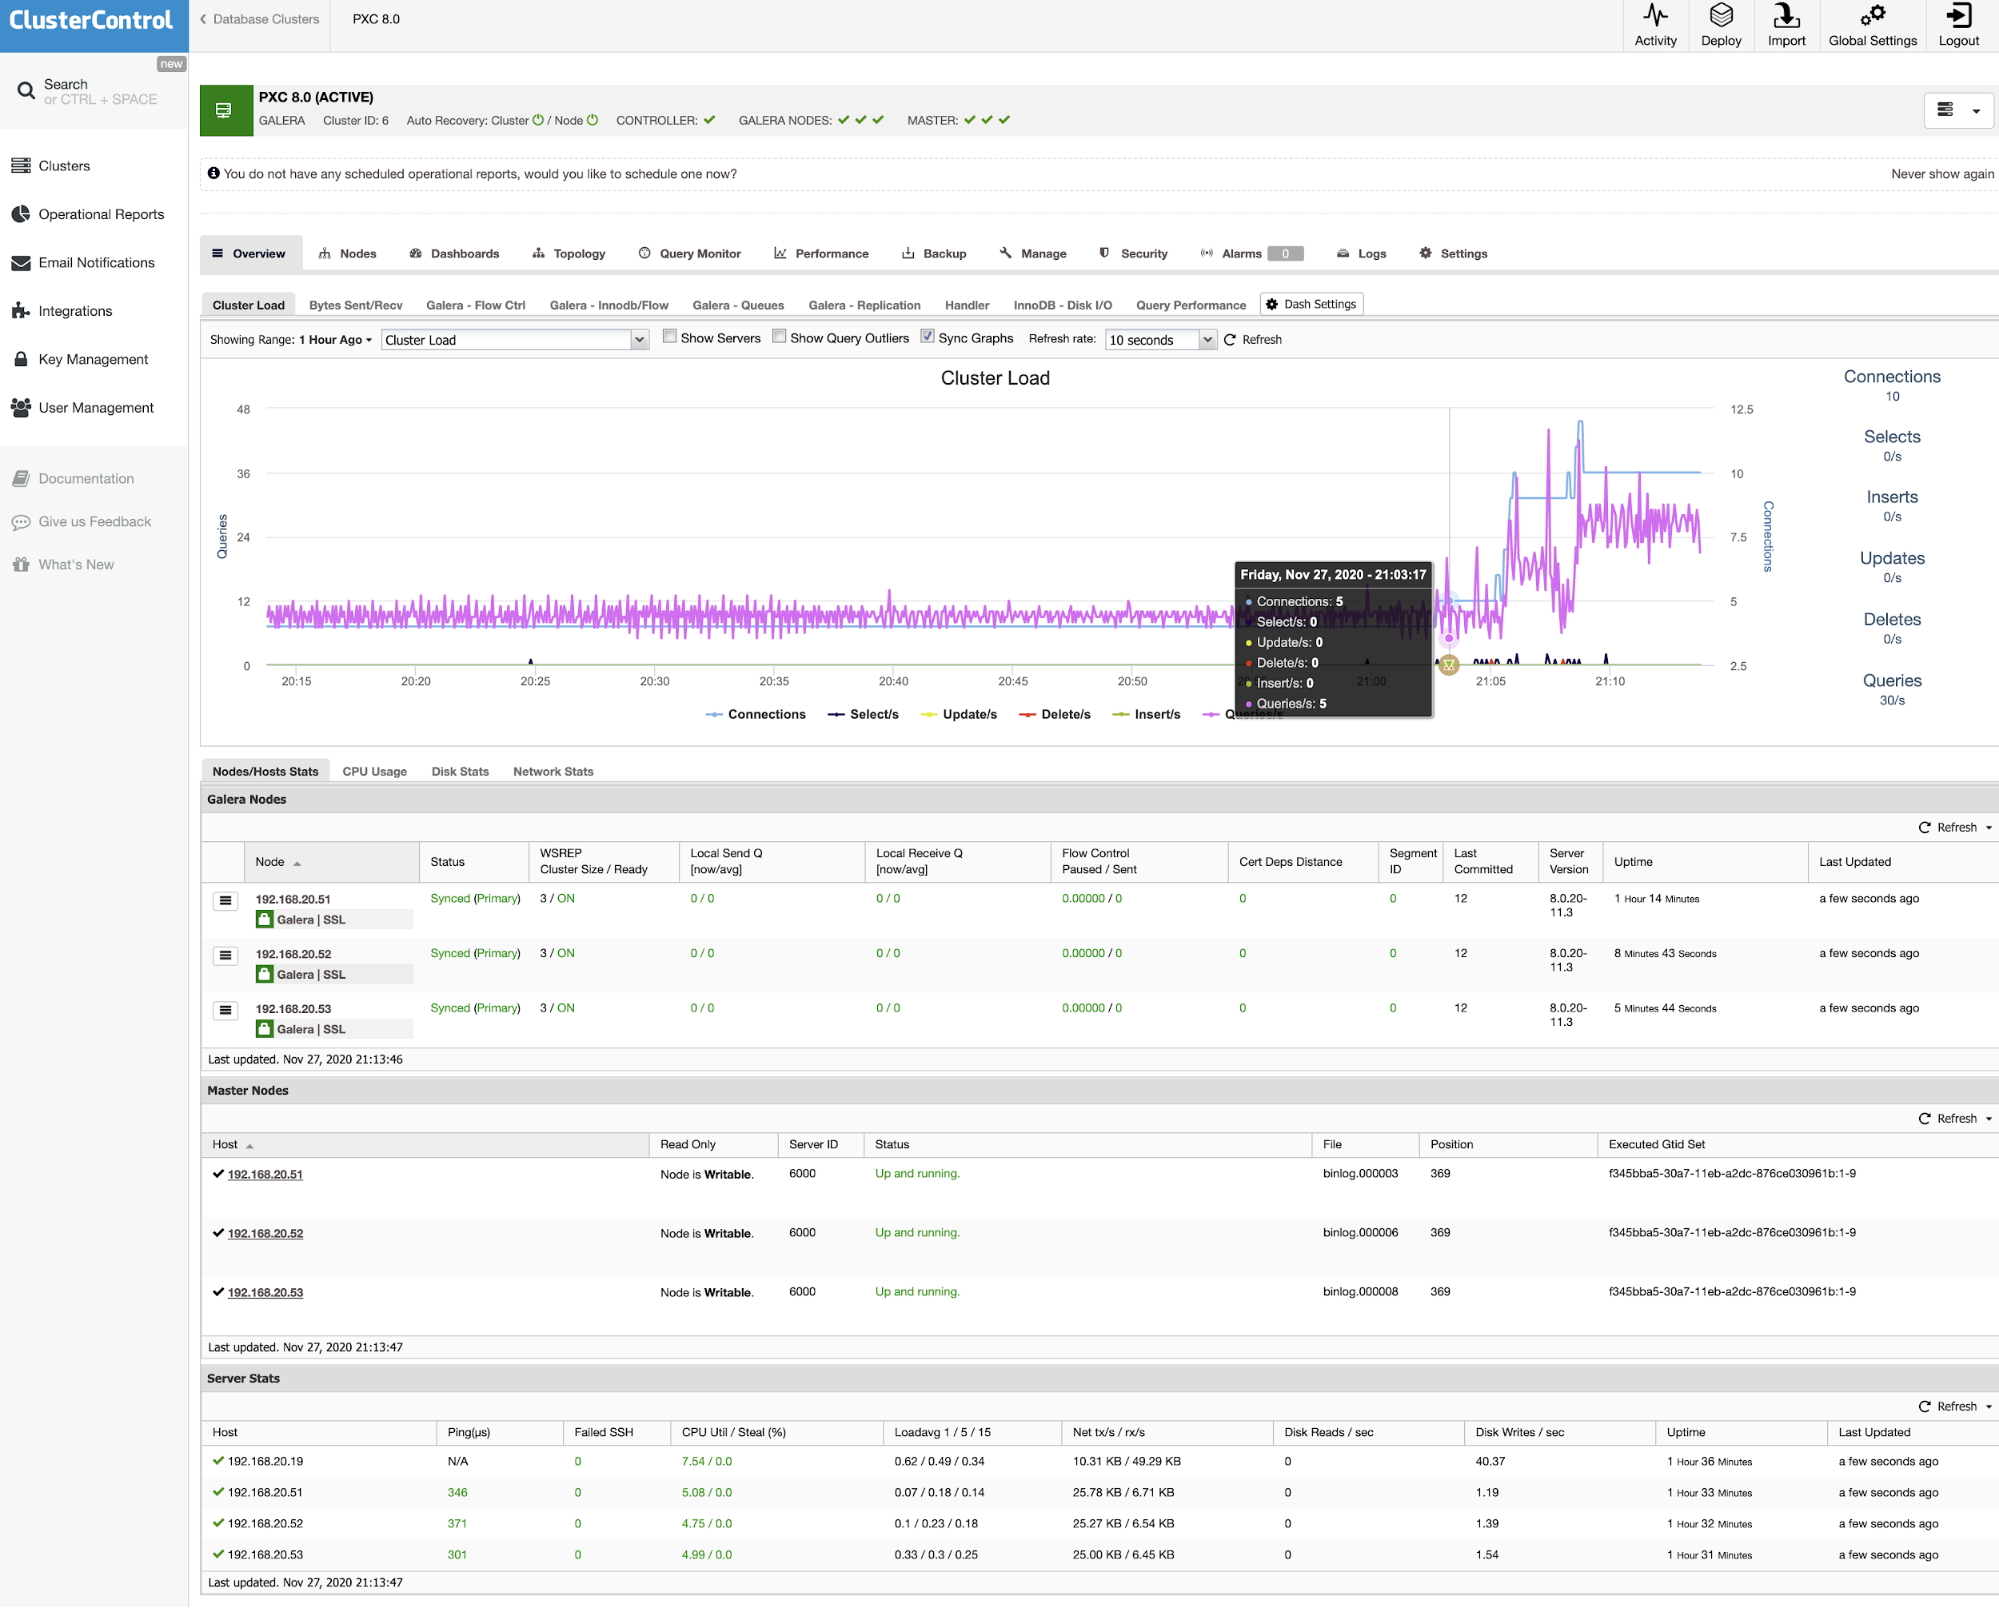
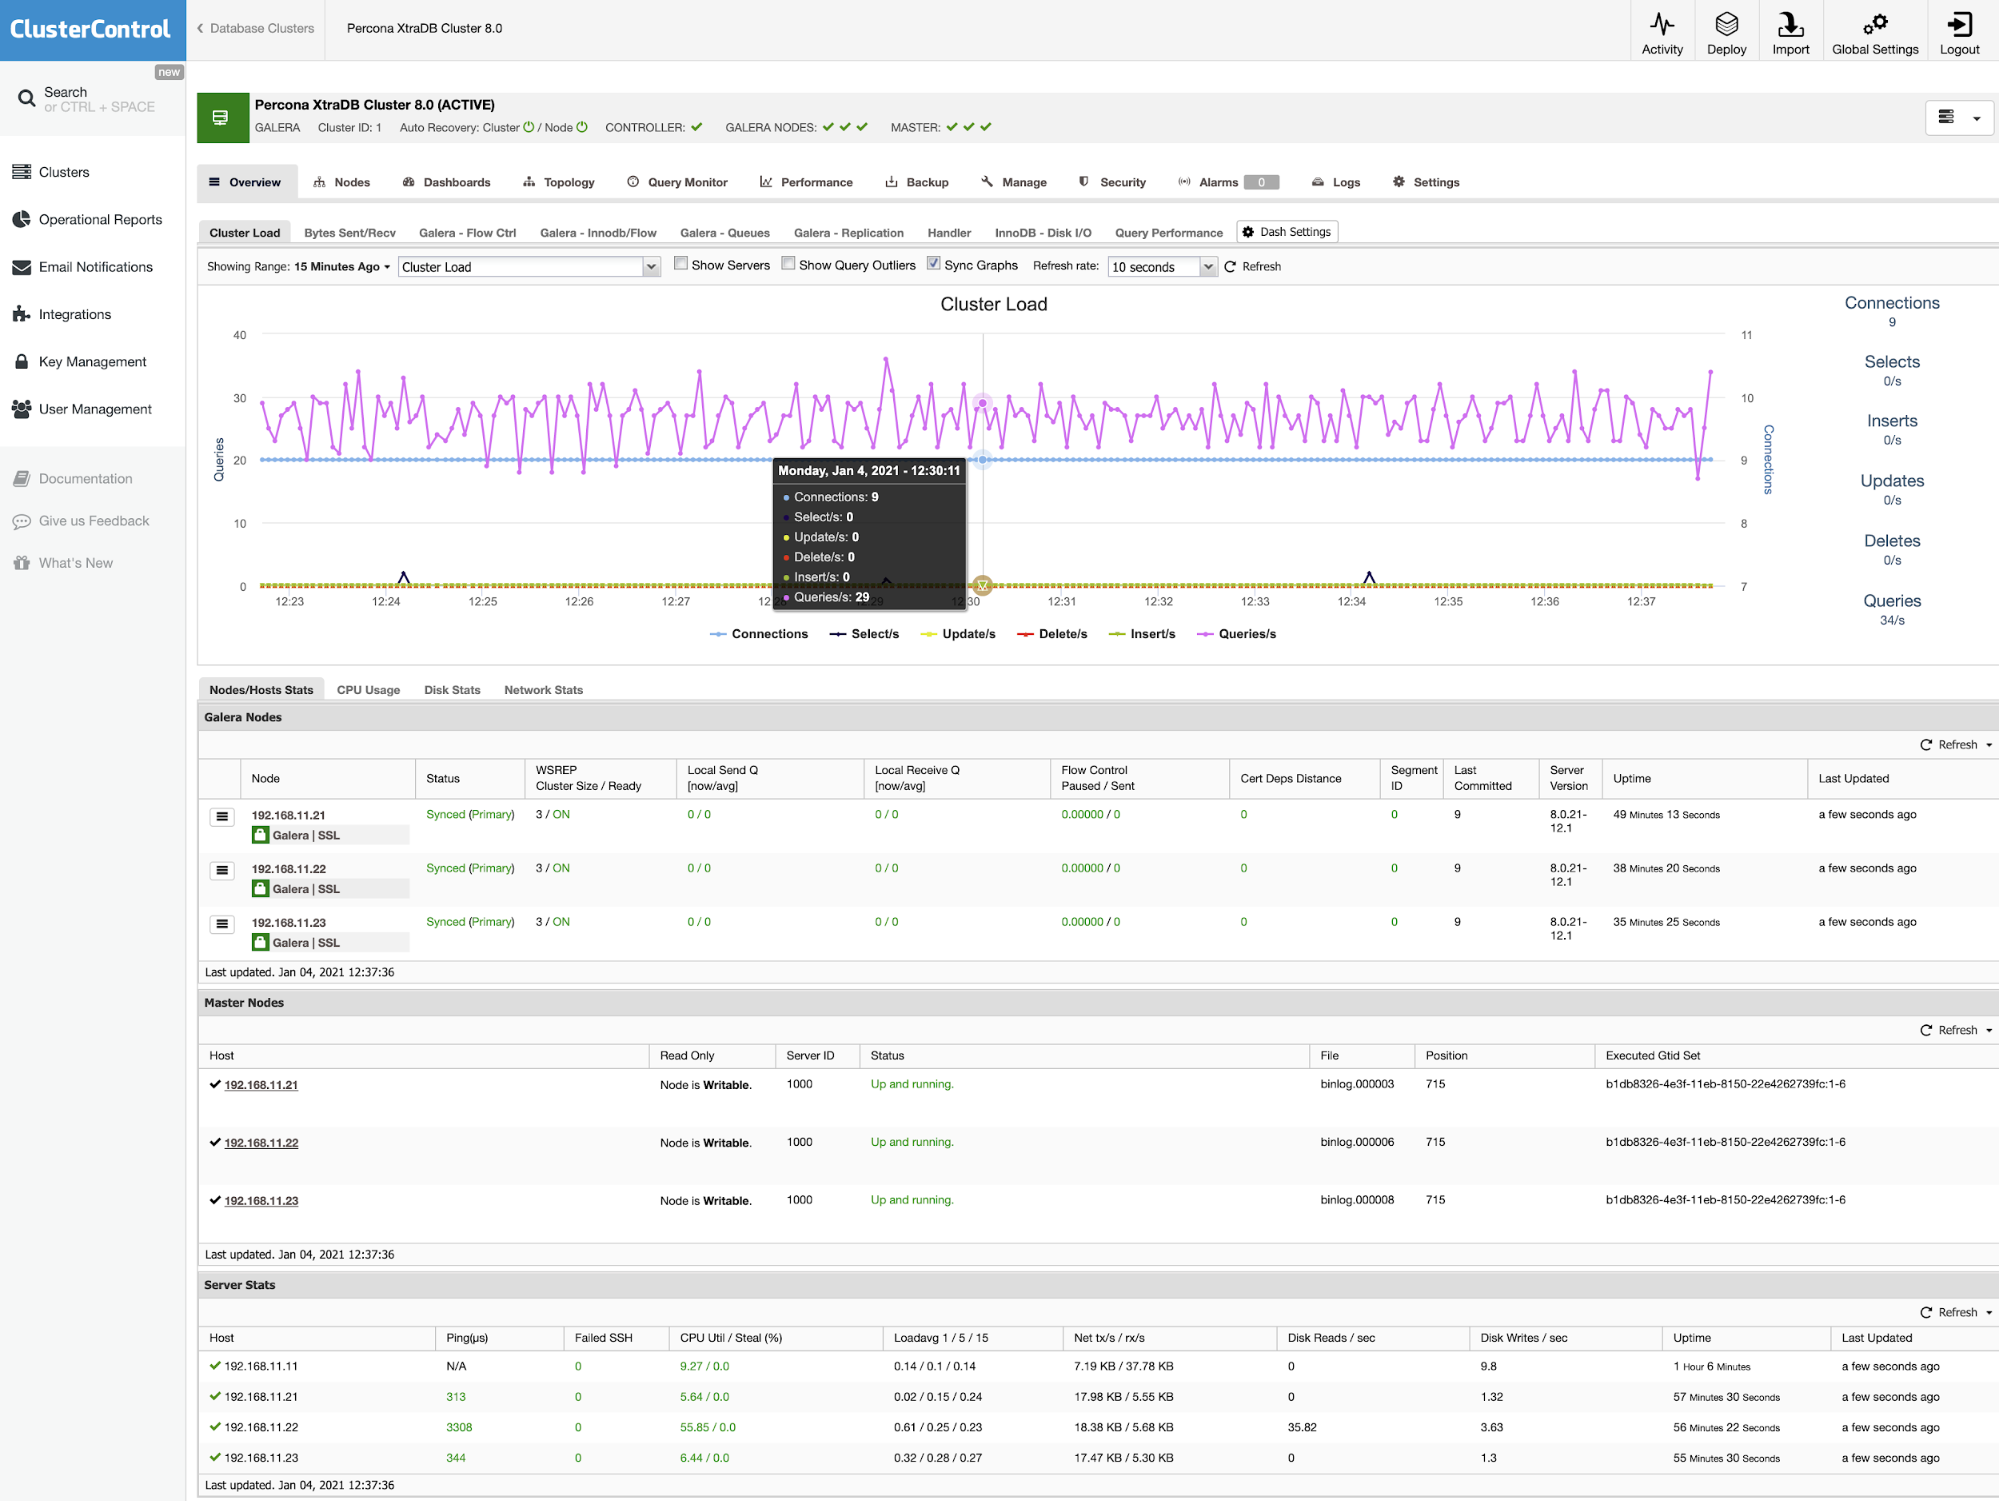
MariaDB Server & Cluster Monitoring
Database monitoring is a critical part of the database, you can know the current state of database health. The difference between MariaDB Server and MariaDB Cluster monitoring is Galera Metrics for synchronization.


On MariaDB Server, you can check your current database health through the MySQL Metrics; MySQL Server - General, MySQL Server - Caches, MySQL InnoDB Metrics which is also visible on the MariaDB Cluster as shown in below:

MySQL Server- General gives you information about the current state of InnoDB buffer pool hit ratio, database connection, queries, locking, and database memory utilization.
MySQL Server- Caches, there is a lot of information provided in Caches. Mostly related to the caching in database, eg: buffer pool size, buffer pool instance. There is also information about table cache usage, hit ratio, Cache Hits and Misses. You can also find thread cache usage and hit ratio information .
MySQL Server- InnoDB Metrics shows metrics related to InnoDB storage eg : Bufferpool activity, InnoDB Row operations, InnoDB Log file size, InnoDB Data Read/Write.

On MariaDB Server, if you setup master/slave replication, there is one subcategory of metrics under MySQL Replication - Master. There is information related to master binary log file, master binary log position, and binlog creation frequency.
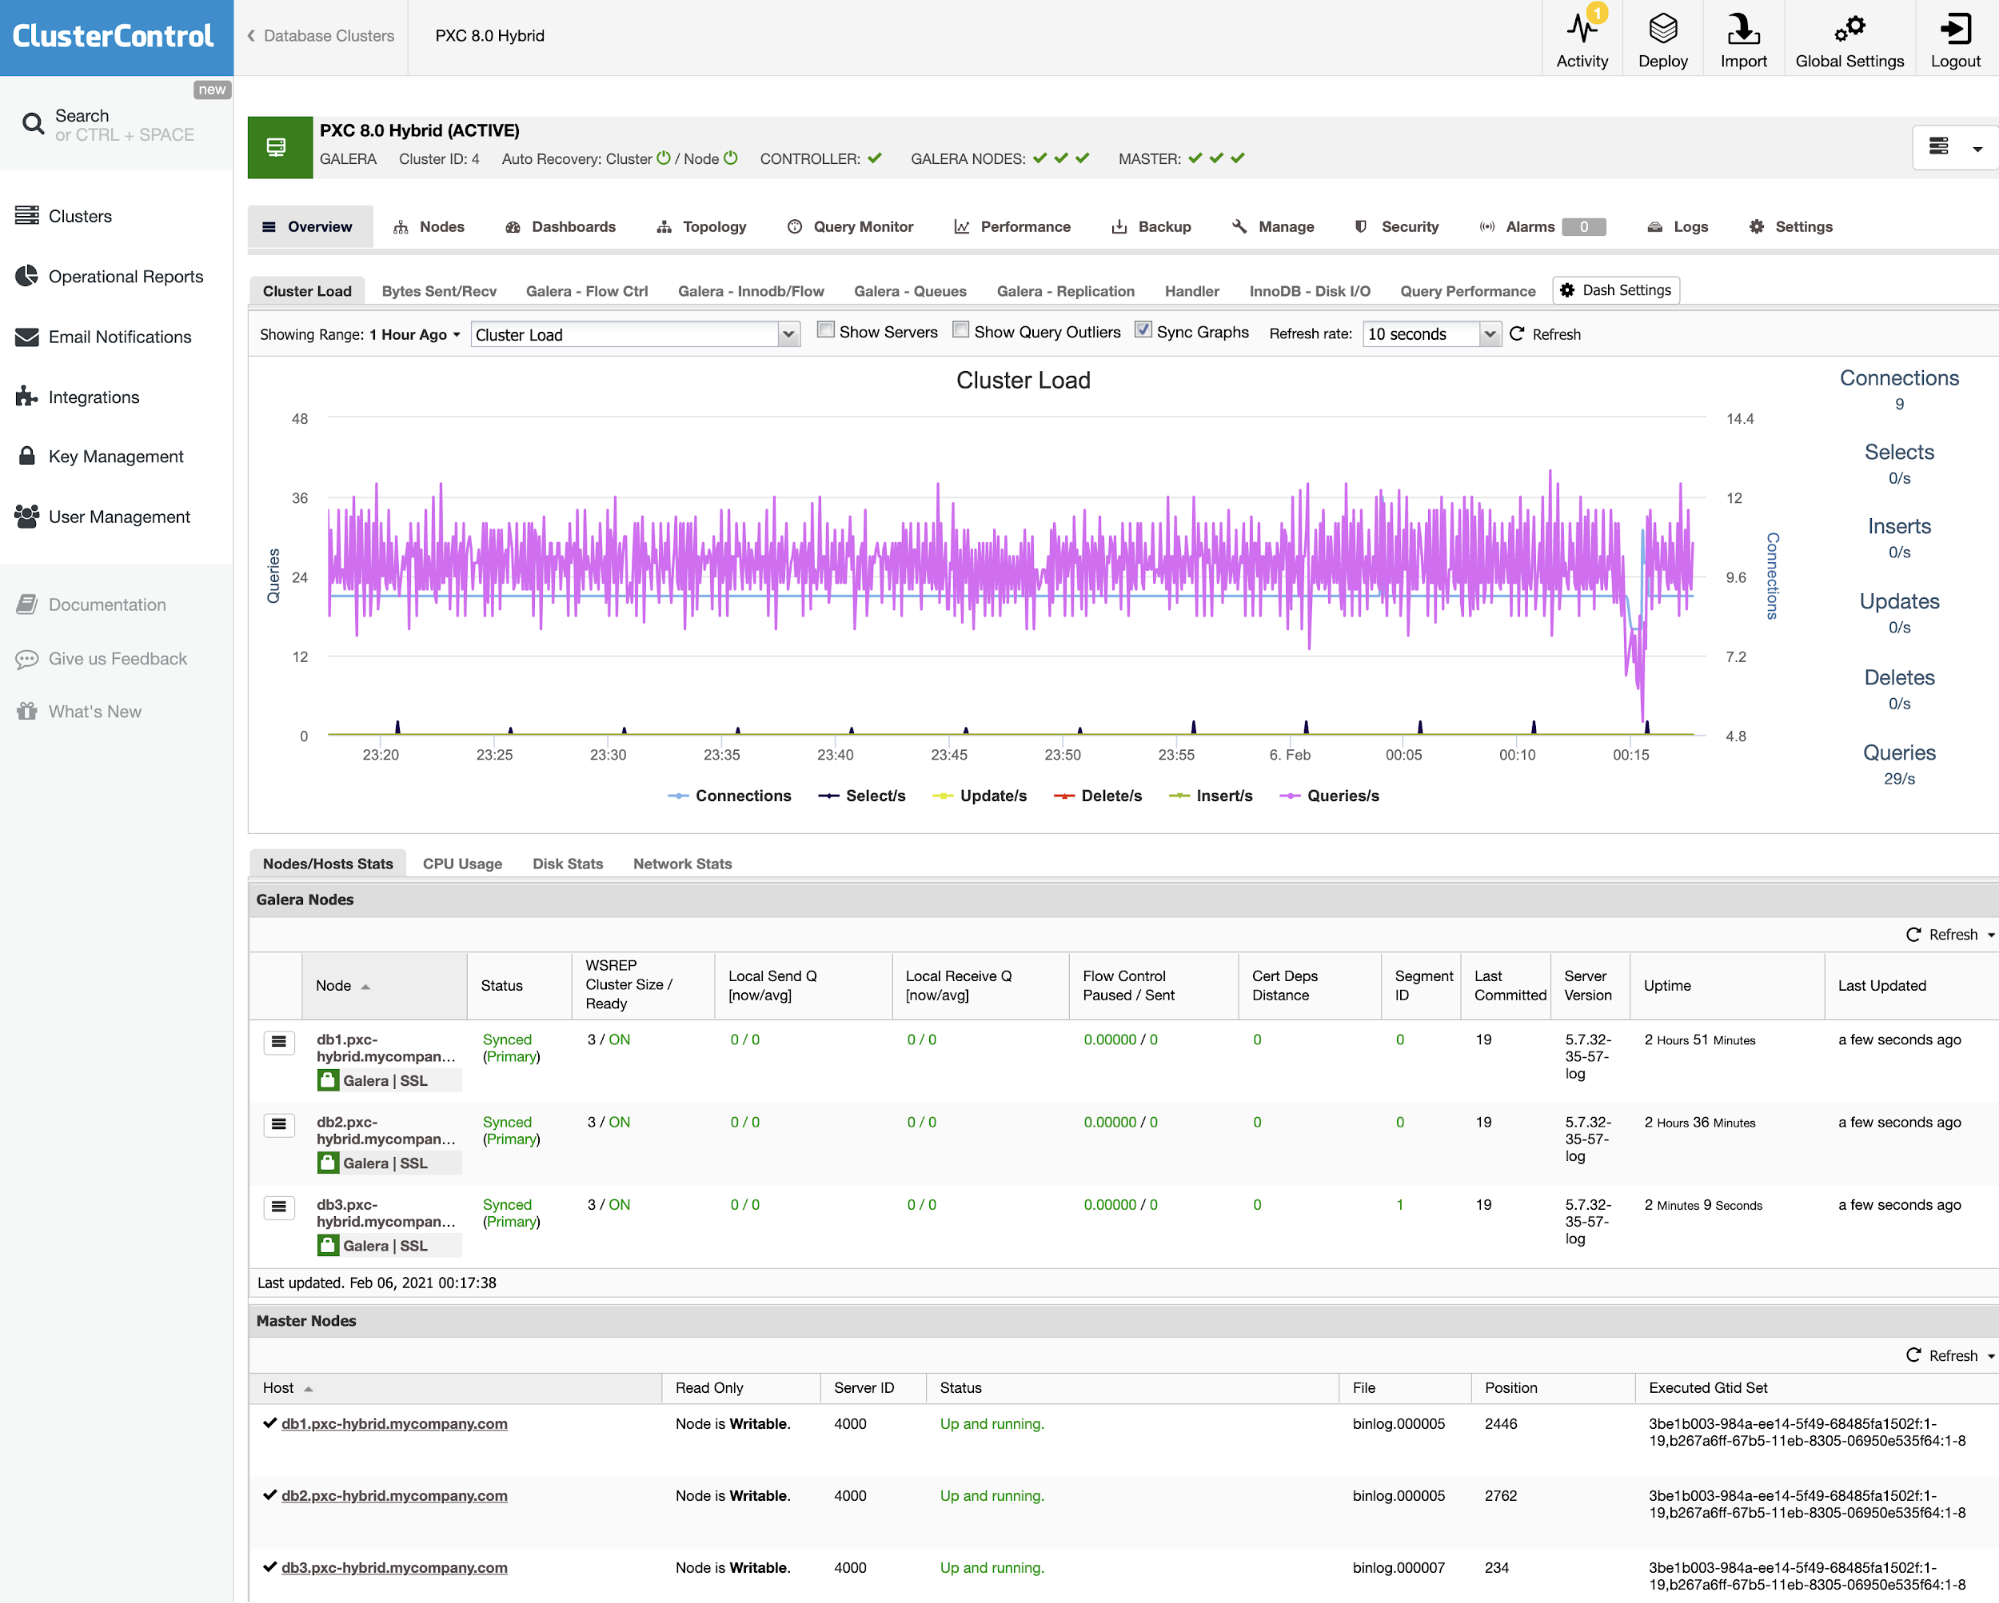
MariaDB Server has a lot of information related to the database, these are also available for MariaDB Cluster. The difference is there are two dashboards for MariaDB Cluster - Galera Overview and Galera Server Charts.

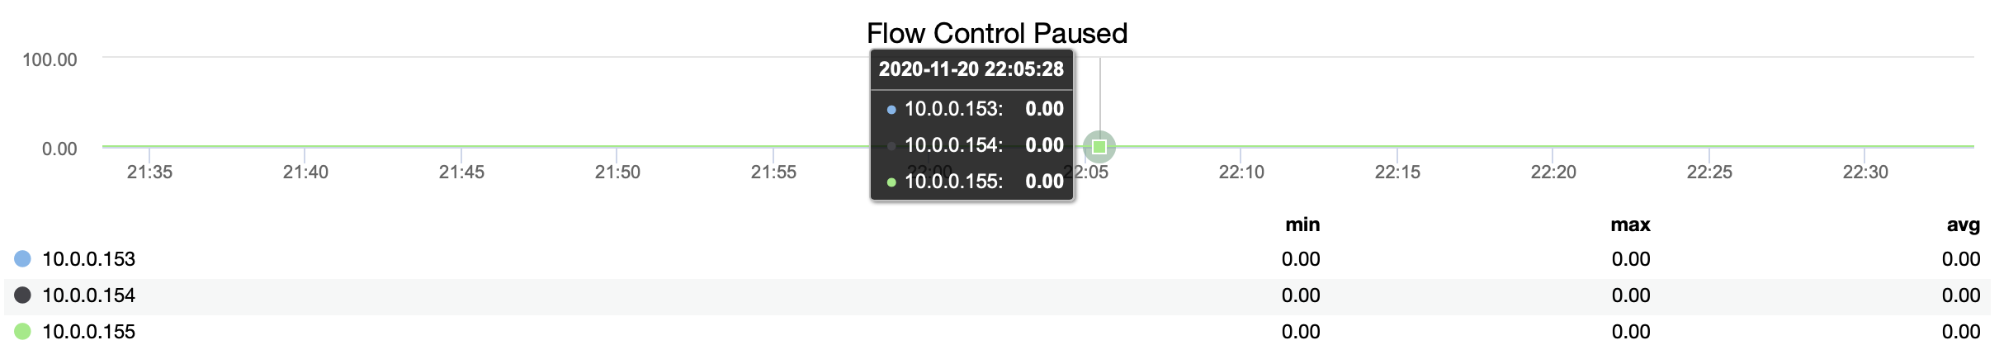
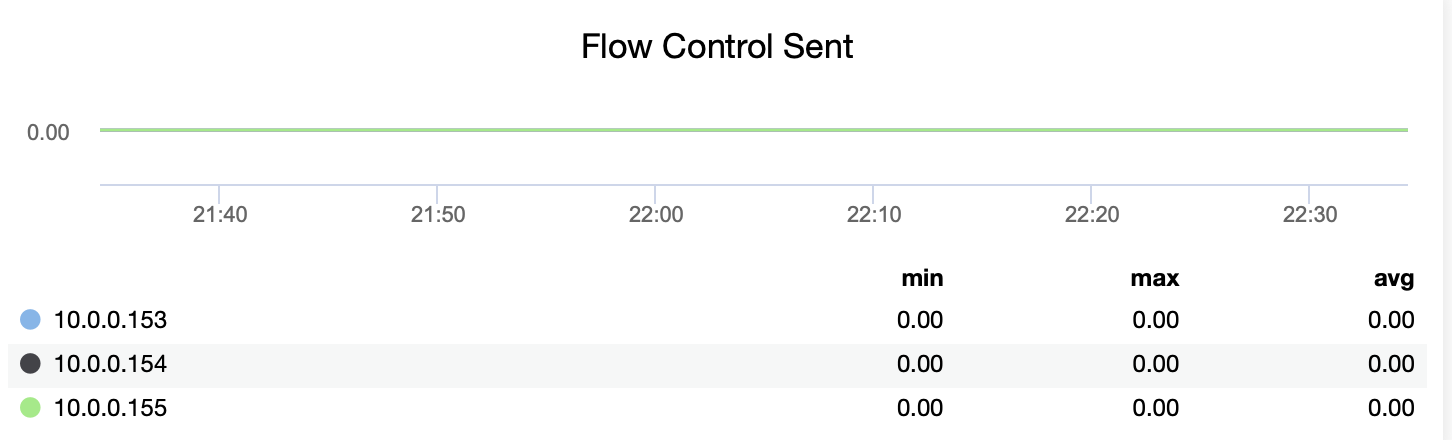
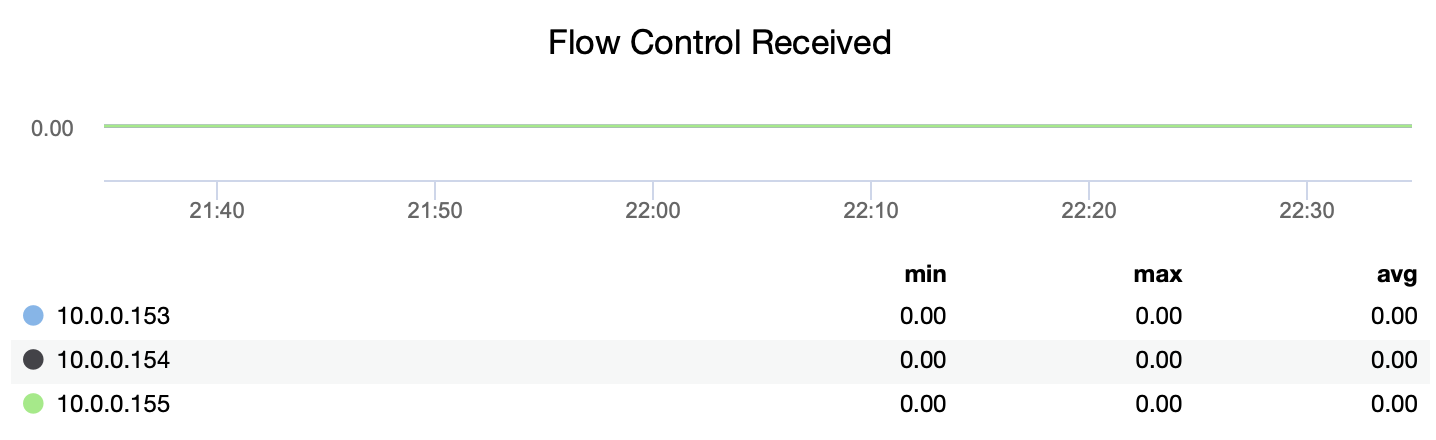
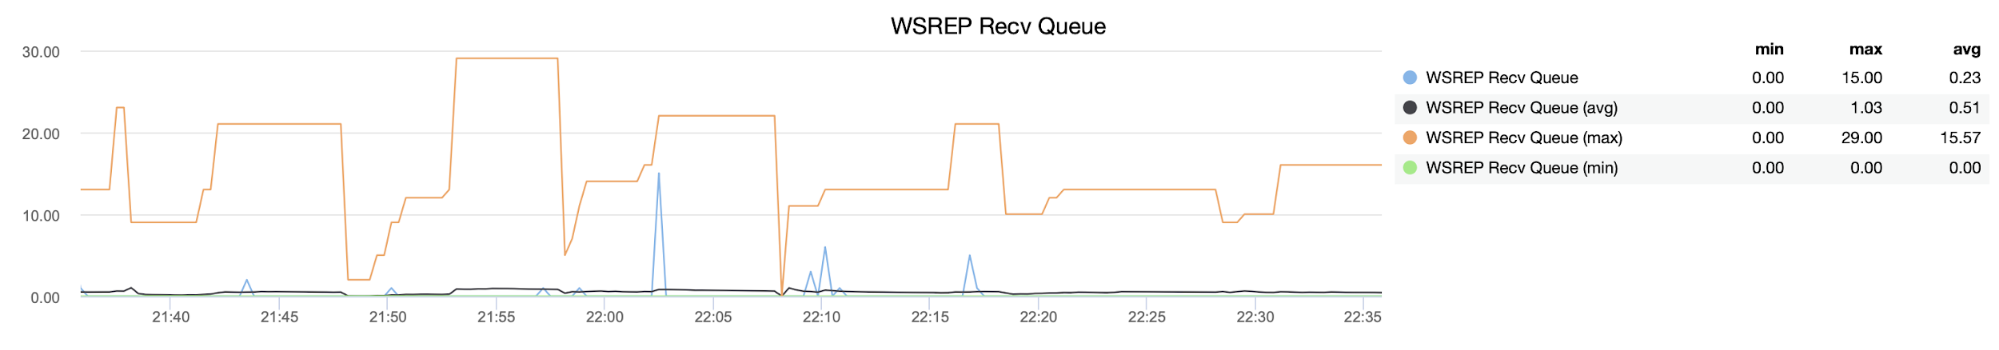
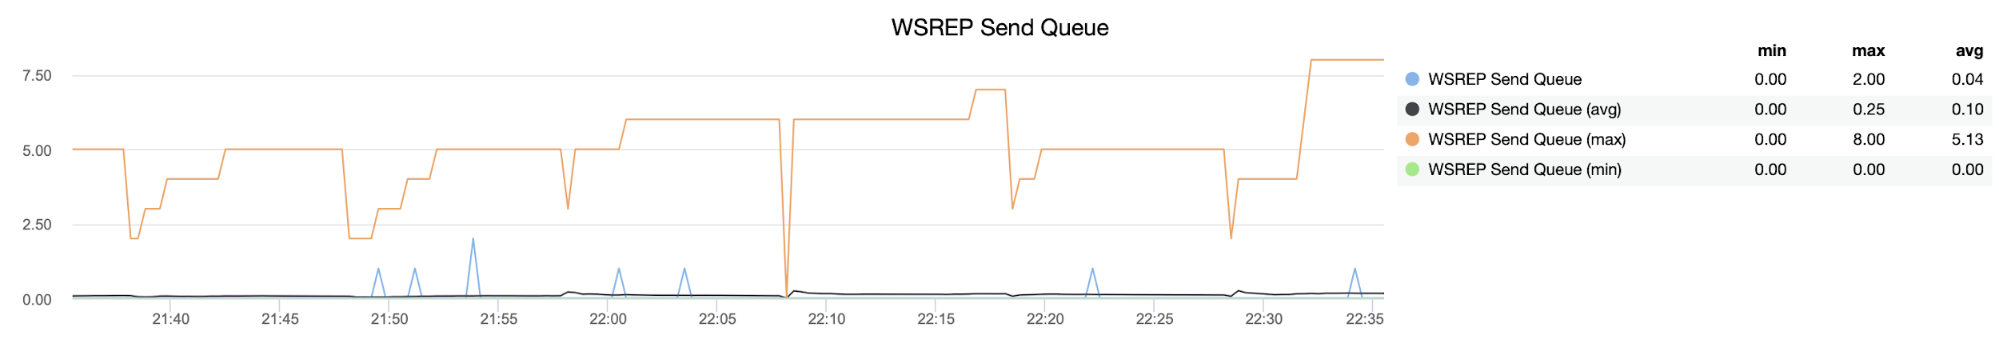
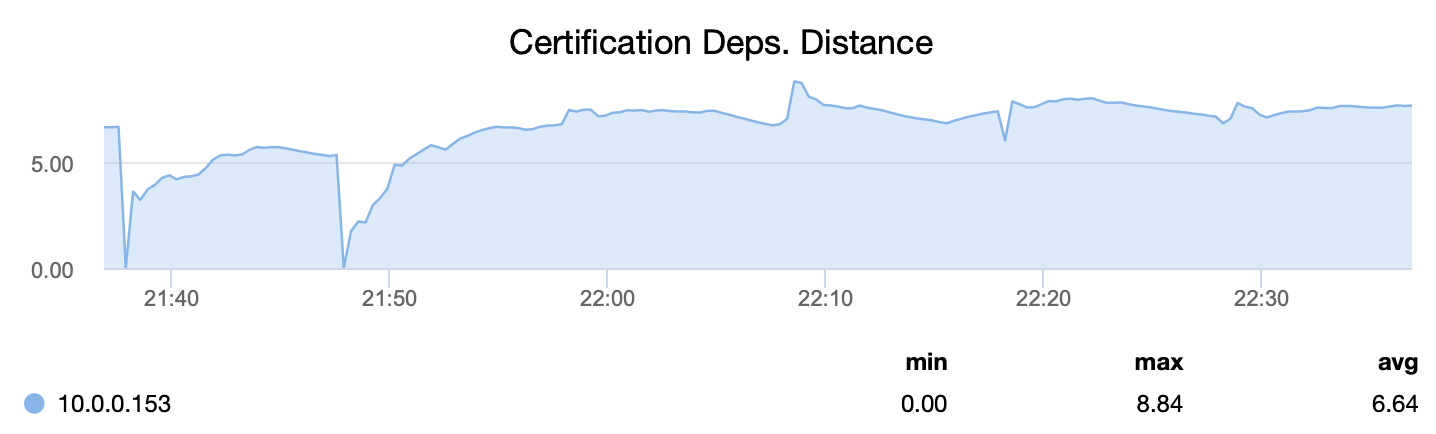
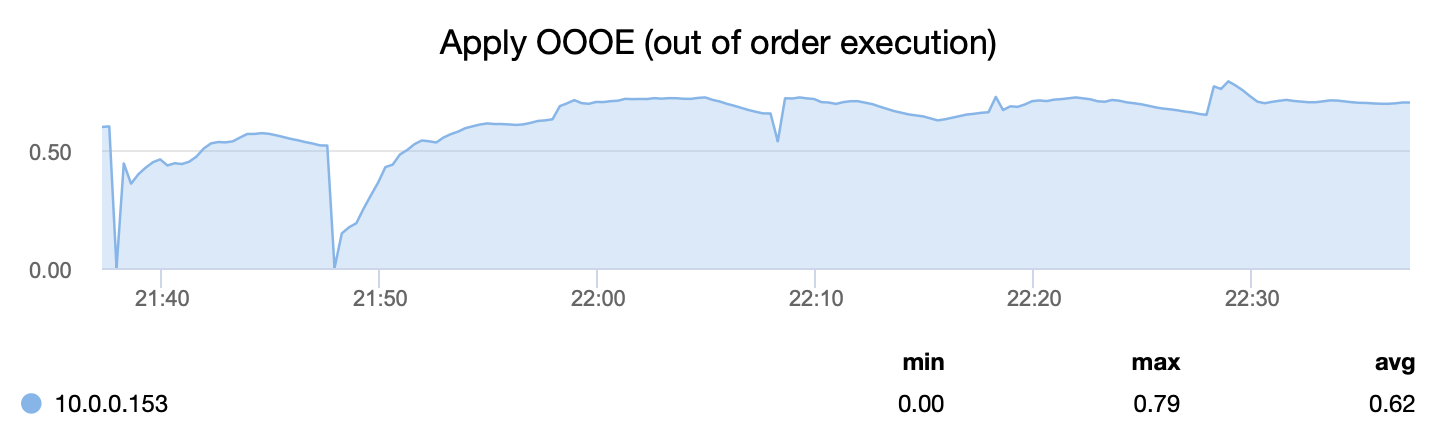
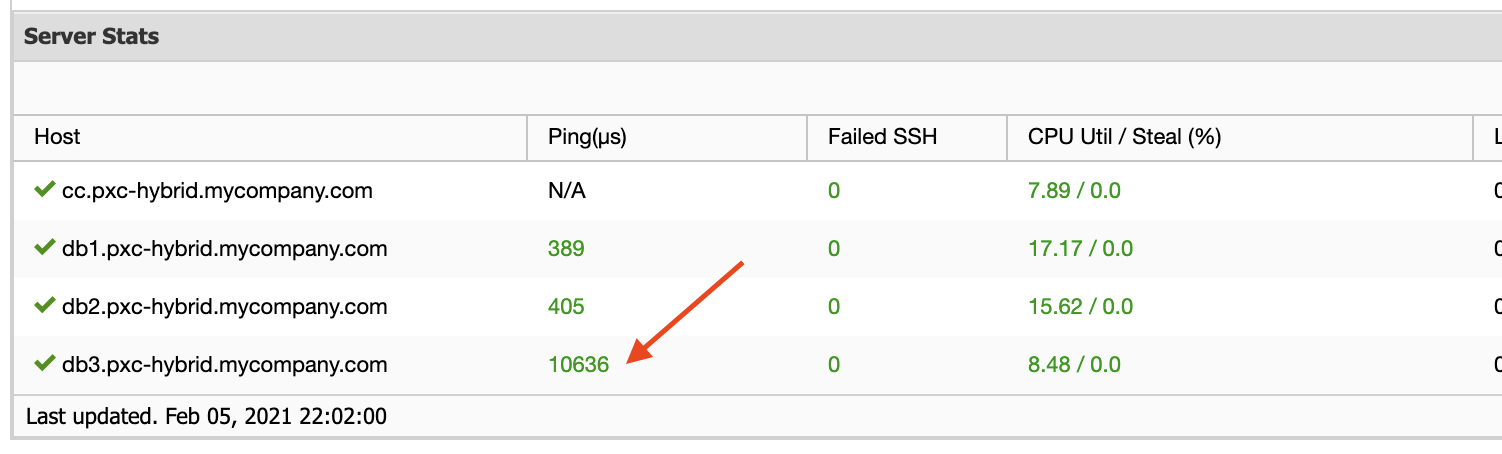
Galera Overview gives information related to the current state of Galera replication. There is information like cluster size, flow control sent, flow control received, flow control paused.
Galera Server Charts has information about cluster name, cluster status, size, Global cache size.
Conclusion
MariaDB Server with standard replication and MariaDB Cluster are not really different products in terms of database service, but they have different characteristics depending on your requirements on availability and scalability. ClusterControl supports both MariaDB Server with standard replication and MariaDB Cluster deployments, so do give both setups a try and let us know your thoughts.