Quantcast
Channel: Severalnines - Galera Cluster
Viewing all 210 articles
Browse latest View live

Database Encryption: Why and Where You Need to Have Data Encryption

$
0
0

Database encryption provides enhanced security for your at rest and in transit data. Many organisations have started to look at data encryption seriously with recent security breach cases. In most cases, database servers are a common target for attackers because it holds the most valuable asset for most organisations. Once an intruder has gained access to valuable data from your server, chances are they will steal the data from it. They then use the data for ransom, data exploitation or other financial gains from the organisation they have attacked.

In this blog, we discuss why database encryption is important and how data encryption plays a significant role in securing your database.

Why Do I Need Database Encryption?

Database encryption is a process to convert data in the database to “cipher text” (unreadable text)  using an algorithm. You need to use a key generated from the algorithm to decrypt the text. The database encryption process is highly recommendable, especially for businesses dealing with financial, health care, or e-commerce. Recently cyber attacks, data theft, or data breaches have been rampant; therefore, there is an increasing concern over private data. People are very aware of data privacy, security and want their data to be protected and used only when required. Following are some good benefits of having database encryption:

Avoid Security Attacks

Security attacks are inevitable,  but with better security and data encryption methods, intruders might not analyse or decrypt to understand the data further in a data breach. Suppose a Man-in-the-middle (MITM) attack or eavesdropping is happening during backup or transfers between servers. If this is an unencrypted data transfer, it is definitely advantageous to the attackers; not a situation you want to have in your environment!

If you have an encrypted database, an attacker must find ways to decrypt the encrypted data. How far they could go depends on the cyphers' complexity and algorithms applied to generate the encrypted data. Also, attackers will try their best to access encryption keys, leading them to open the vault or decrypt the encrypted data, similar to gold mining; after all, data is the new gold these days. To avoid these kinds of data breach attempts, it is important to secure the infrastructure in all ways, including limiting access to servers where possible.

Compliance with Security Regulations

When dealing with security regulations such as PCI-DSS, encryption is one of the most important requirements. It is a mandatory requirement. For instance, all cardholder data must be either encrypted using industry-accepted algorithms (e.g. AES-256, RSA 2048), truncated, tokenized, or hashed (approved hash algorithms specified in FIPS 180-4: SHA-1, SHA-224, SHA-256, SHA-384 SHA-512, SHA-512/224 and SHA-512/256). Although that is not the only thing to be covered for having encrypted data, PCI-DSS also requires the coverage of using PCI-DSS encryption key management process.

Protecting Sensitive Data

The encryption key management is ideal for protecting sensitive data with centralized key management and simple APIs for data encryption. Examples of these key management are using Hashicorp Vault (open source) or if you are using public cloud (closed source), most commonly closed-source key management are Amazon Web Service (AWS) Key Management Service (KMS), Google Cloud KMS, Microsoft Azure Key Vault.

What is Data Encryption?

Encryption is one of the most important security features to keep your data as secure as possible. Depending on the data you are handling, it is not always a must, but you should at least consider it a security improvement in your organization. In fact, it is actually recommended to avoid data theft or unauthorized access.

Data encryption is a process of encoding the data. It is mainly a two-way function, which means encrypted data has to be decrypted with a valid encryption key. Encryption is one such technique of Cryptography. Encryption is a way to conceal information by altering it so that it appears to be random data - encryption methods can make your data (for example messages) confidential, but at the same time, other techniques and strategies are required to provide the integrity and authenticity of a message. Encryption is more of a mathematical operation.

In database encryption, there are two basic types when it comes to encrypting the data. These encryption types are data at-rest and data in-transit. Let’s see what they mean.

Data at-Rest Encryption

Data stored in a system is known as data at-rest. The encryption of this data consists of using an algorithm to convert text or code for it to be unreadable. You must have an encryption key to decode the encrypted data.

Encrypting an entire database should be done with caution since it can result in a serious performance impact. It is therefore wise to encrypt only individual fields or tables. Encrypting data-at-rest protects the data from physical theft of hard drives or unauthorized file storage access. This encryption also complies with data security regulations, especially if there is financial or health data stored on the filesystem.

Encryption for data at-rest: Where it applies?

This covers data at-rest such as your database data stored in a specific location. For example, your PostgreSQL's data_directory, MySQL/MariaDB data_dir, or MongoDB's dbPath storage locations. Common process for providing encryption is using Transparent Data Encryption (TDE). The concept mainly is encrypting everything that is persistent.

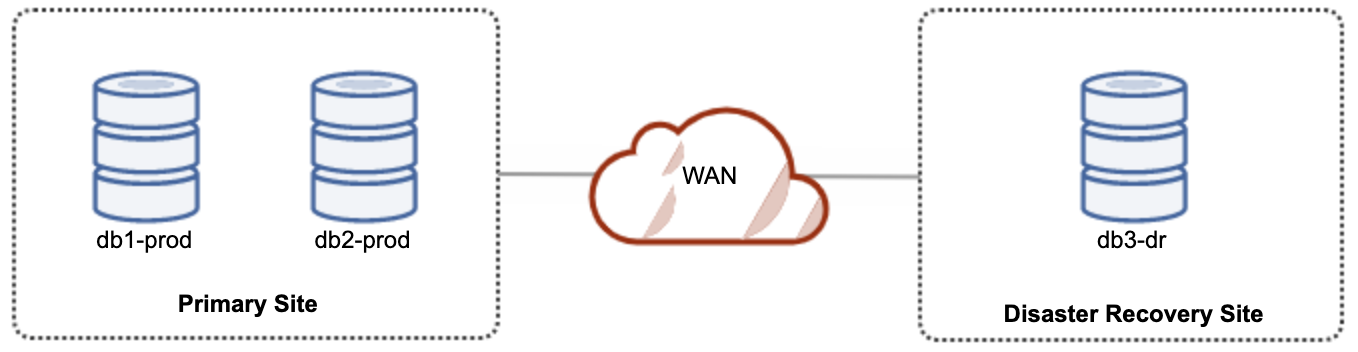
Besides that, database backups are very prone to data theft and unauthorized access. These are stored physically in a non-volatile storage.While these setups are held exposed to be read by unauthorized access or data theft, encrypting the data helps avoid unwanted access. Of course, it also comes with securing your encryption keys somewhere hidden and not stored on the same server. Encrypting your database data stored as binaries and your backups whether it's a logical or a binary backup, keep in mind that encrypted data affects performance and makes the file size bigger.

Data in-Transit Encryption

Data transferred or moving around between transactions is known as data-in-transit. The data moving between the server and client while browsing web pages is a good example of this kind of data. Since it is always on the move, it needs to be encrypted to avoid any theft or alteration to the data before it reaches its destination.

The ideal situation to protect data-in-transit is to have the data encrypted before it moves, and decrypted once it reaches the final destination.

Encryption for data in-transit: Where it applies?

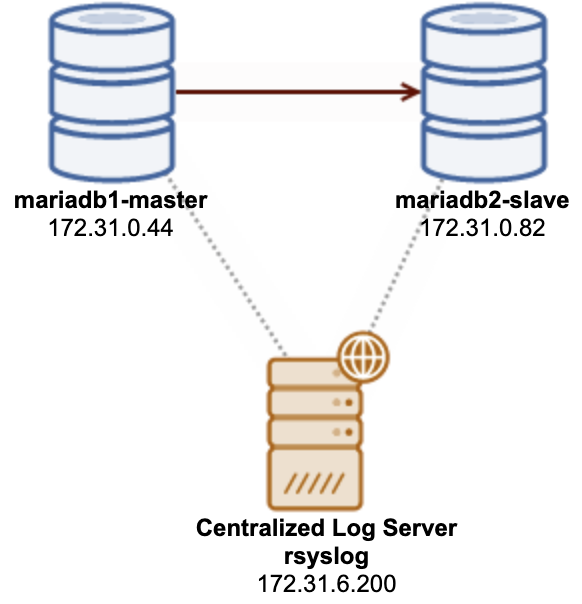
As specified above, this relates to the communication channel between the database client and the database server. Consider the application server and database server channels that have been compromised, and the attacker or intruder is eavesdropping or making a MITM attack. The attacker can listen and capture the data that is being sent over an insecure channel. This can be avoided if the data sent over the wire from its database client and database server communication channel is encrypted using TLS/SSL encryption.

Dealing with database encryption has a lot of challenges to overcome as well. Although there are advantages, there are cases that it is a disadvantage. Let's go over what these are.

Advantages of Data Encryption

Here are the lists of common and real-world cases that seek data encryption as an advantage.

  • It provides security for all of your data at all times

  • Protects privacy and sensitive information at all times

  • Protects your data across devices

  • Secure your government regulatory compliance

  • It gives you edge for being a competitive advantage

  • Presence of underlying technology for encryption for data protection could increase trust

  • Encrypted data maintains integrity

Disadvantages of Data Encryption

Data encryption doesn't mean business success. It doesn't give you the edge as a growing, innovative and advanced technology without knowing its challenges and best practices to implement and deal with this. It's true for the saying that "All That Glitters Is Not Gold". There are certain disadvantages if you have data encryption when you do not understand its main purpose.

Data encryption and performance penalties

Encryption involves complex and sophisticated mathematical operations to conceal the meaning of data. Depending on what types of ciphers or algorithms you choose either for hashing or deciphering the data. The complex and the higher bits are, if your database is designed to handle tons of requests, then it shall bog down your resources especially the CPU. Setting up data encryption such as TLS for your in-transit or using RSA 2048 bits can be too much if your financial capacity has not overseen this type of consequence. It is a resource intensive and adds extra pressure on the system's processor. Although modern computing systems are powerful and are affordable especially for public cloud offerings can be acceptable. Prepare some assessment first and identify what sort of performance impact encryption will have in the context where you will use it. It’s also important to understand that the performance of the various encryption solutions is different. Which means the need for speed and security have to be carefully balanced against one another.

Losing the data encryption keys

It's becoming common to store the encryption keys in a secure vault, as mentioned earlier, such as Hashicorp Vault, AWS KMS, and others. One major issue of having encryption is that if someone loses the decryption key, that would mean big trouble. You can relate that it is much the same as having a password, but it is treated as a global key to decrypt all the encrypted data. Not unless you have different encryption keys for every aspect of your database, then that could mean a lot of passwords to be remembered and has to be kept securely.

Data encryption impacts recovery time

If your data at-rest such as backups are encrypted, in case of a total disaster, recovering with your own backup can double or triple the time or even much more depending on how you have set the type of algorithm or ciphers. This adds pressure whenever you need your cluster and application to be up on time but cannot due to deciphering or decrypting the data takes too much time and system resources.

Limited protection against application level or insider attacks

Of course, this is understandable by the essence of having encryption. But this doesn't mean you don't have to encrypt anymore just because it doesn't apply protection in the application level. Of course, that's another layer of security that has to be applied in the application layer. Definitely, if someone gains access to your database user/password especially with administrative access, then encryption doesn't help here. The attacker can retrieve data by running a series of SQL queries which is of course human readable unless there is a certain level of application logic that encrypts the true meaning of your data. On the other hand, that just adds extra work and complexity of the overall tied up technology that you are using. If you have a large team that is designated to each of these layers, then that's a great advantage as managing the complexity can only be dedicated to every role they are supposed to focus on.

Cooperation and trust with peers holding the data encryption keys

Definitely a good thing to consider here. What if the peer who knows the keys and where it has been stored or your storage vault's password has left? It's very important to designate the physical access of the server where the keys and passwords are stored. Designation of the role and limiting access to these keys and passwords is very important. It also helps if you have a long and complex combination of passwords so that it shall be hard to memorize but at the same time shall be easily retrieved when needed. Although that sounds ironic, a secret has to remain sacred.

Should I Care About Data Encryption?

Data encryption is desirable and often mandatory, as mentioned, depending on your application's schematic process and design and level of business you are engaged with. 

Should you care about data encryption? Definitely yes. It comes up as well, with personal dependency and business purpose. However, in the presence of sensitive data, especially when you have already built your own persona and financial capacity in your organization and company, all data are very much at a higher level of sensitivity. You do not want someone to steal your data and know all the strategic and business things involved in your company's growth. Data, in this case, has to be secured; thus, encryption is an essential aspect of securing your database and the data itself. 

Conclusion

As sensitive data always exists even in our personal daily lives, the volume of sensitive and valuable data increases in parallel in an organisation. It is important to understand not all data requires encryption. Definitely, some data is globally shared or frequently repurposed; this type of data does not need to be encrypted. Take note of the advantages and disadvantages of using encryption in your database. Determining where it shall apply and how to apply it helps you achieve a  secure environment without any performance impact.


Disaster Recovery for Galera Cluster Deployed to a Hybrid Cloud

$
0
0

Running a Galera Cluster in a hybrid cloud should consist of at least two different geographical sites, connecting hosts in the on-premises or private cloud with the ones in the public cloud. Whether you use unbreakable private cloud or public cloud platforms, Disaster Recovery (DR) is indeed a key issue. This is not about copying your data to a backup site and being able to restore it, this is about business continuity and how fast you can recover services when disaster strikes. 

In this blog post, we will look into different ways of designing your Galera Clusters for fault tolerance in a hybrid cloud environment.

Active-Active Setup

Galera Cluster should be running with an odd number total of nodes in a cluster, and commonly starts with 3 nodes. This is because Galera Cluster uses quorum to automatically determine the primary component, where a majority of connected nodes should be able to serve the cluster at a time, in case of cluster partitioning happened. 

For an active-active setup hybrid cloud setup, Galera requires at least 3 different sites, forming a Galera Cluster across WAN. Generally, you would need a third site to act as an arbitrator, voting for quorum and preserving the “primary component” if any of the sites are unreachable. This can be set up as a minimum of a 3-node cluster on 3 different sites (1 node per site), similar to the following diagram:

However, for performance and reliability purposes, it is recommended to have a 7-node cluster, as shown in the following diagram:

This is considered the best topology to support an active-active setup, where the DR site should be available almost immediately, without any intervention. Both sites can receive reads/writes at any moment provided the cluster is in the quorum. 

However, it is very costly to have 3 sites, and 7 database nodes (the 7th node can be replaced with a garbd since it's very unlikely to be used to serve data to the clients/applications). This commonly not a popular deployment at the beginning of the project due to the huge upfront cost and how sensitive the Galera group communication and replication to network latency.

Active-Passive Setup

In an active-passive configuration, at least 2 sites are required and only one site is active at a time, known as the primary site and the nodes on the secondary site only replicate data coming from the primary server/cluster. For Galera Cluster, we can use either MySQL asynchronous replication (master-slave replication) or we can also use Galera's virtually-synchronous replication with some tuning to tone down its writeset replication to act as asynchronous replication.

The secondary site must be protected against accidental writes, by using the read-only flag, application firewall, reverse proxy or any other means since the data flow is always coming from the primary to the secondary site unless a failover has initiated and promoted the secondary site as the primary.

Using asynchronous replication

A good thing about asynchronous replication is that the replication does not impact the source server/cluster, but it is allowed to be lagging behind the master. This setup will make the primary and DR site independent of each other, loosely connected with asynchronous replication. This can be set up as a minimum of a 4-node cluster on 2 different sites, similar to the following diagram:

One of the Galera nodes in the DR site will be a slave, that replicates from one of the Galera nodes (master) in the primary site. Both sites have to produce binary logs with GTID and log_slave_updates are enabled - the updates that come from the asynchronous replication stream will be applied to the other nodes in the cluster. However, for production usage, we recommend having two sets of clusters on both site, as shown in the following diagram:

By having two separate clusters, they will be loosely coupled and not impacting each other, e.g. a cluster failure on the primary site will not affect the DR site. Performance-wise, WAN latency will not impact updates on the active cluster. These are shipped asynchronously to the backup site. The DR cluster could potentially run on smaller instances in a public cloud environment, as long as they can keep up with the primary cluster. The instances can be upgraded if needed. Applications should send writes to the primary site, and the secondary site must be set to run in read-only mode. The disaster recovery site can be used for other purposes like database backup, binary logs backup and reporting or processing analytical queries (OLAP).

On the downside, there is a chance of data loss during failover/fallback if the slave was lagging. Therefore, it's recommended to enable semi-synchronous replication to lower the risk of data loss. Note that using semi-synchronous replication still does not provide strong guarantees against data loss, if compared to Galera's virtually-synchronous replication. Read this MySQL manual carefully, for example, these sentences:

"With semisynchronous replication, if the source crashes and a failover to a replica is carried out, the failed source should not be reused as the replication source, and should be discarded. It could have transactions that were not acknowledged by any replica, which were therefore not committed before the failover."

The failover process is pretty straightforward. To promote the disaster recovery site, simply turn off the read-only flag and start directing the application to the database nodes in the DR site. The fallback strategy is a bit tricky though, and it requires some expertise in staging the data on both sites, switching the master/slave role of a cluster and redirecting the slave replication flow to the opposite way.

Using Galera Replication

For active-passive setup, we can place the majority of the nodes located in the primary site while the minority of the nodes located in the disaster recovery site, as shown in the following screenshot for a 3-node Galera Cluster:

If the primary site is down, the cluster will fail as it is out of quorum. The Galera node on the disaster recovery site (db3-dr) will need to be bootstrapped manually as a single node primary component. Once the primary site comes back up, both nodes on the primary site (db1-prod and db2-prod) need to rejoin galera3 to get synced. Having a pretty large gcache should help to reduce the risk of SST over WAN. This architecture is easy to set up and administer and very cost-effective.

Failover is manual, as the administrator needs to promote the single node as the primary component (bootstrap db3-dr or use set pc.bootstrap=1 in the wsrep_provider_options parameter. There would be downtime in the meantime. Performance might be an issue, as the DR site will be running with a smaller number of nodes (since the DR site is always the minority) to run all the load. It may be possible to scale out with more nodes after switching to the DR site but beware of the additional load.

Note that Galera Cluster is sensitive to the network due to its virtually synchronous nature. The farther the Galera nodes are in a given cluster, the higher latency and its write capability to distribute and certify the writesets. Also, if the connectivity is not stable, cluster partitioning can easily happen, which could trigger cluster synchronization on the joiner nodes. In some cases, this can introduce instability to the cluster. This requires a bit of tuning on Galera parameters, as shown in this blog post, Deploying a Hybrid Infrastructure Environment for Percona XtraDB Cluster

Final Thoughts

Galera Cluster is a great technology that can be deployed in different ways - one cluster stretched across multiple sites, multiple clusters kept in sync via asynchronous replication, a mixture of synchronous and asynchronous replication, and so on. The actual solution will be dictated by factors like WAN latency, eventual versus strong data consistency and budget.

Tips and Tricks for Implementing Database Role-Based Access Controls for MariaDB

$
0
0

In a database management system (DBMS), role-based access controls (RBAC), is a restriction on database resources based on a set of pre-defined groups of privileges and has become one of the main methods for advanced access control. Database roles can be created and dropped, as well as have privileges granted to and revoked from them. Roles can be granted to and revoked from individual user accounts. The applicable active roles for an account can be selected from those granted to the account and changed during sessions for that account.

In this blog post, we will cover some tips and tricks on using the database role to manage user privileges and as an advanced access control mechanism for our database access. If you would like to learn about the basics of roles in MySQL and MariaDB, check out this blog post, Database User Management: Managing Roles for MariaDB.

MySQL vs MariaDB Roles

MySQL and MariaDB use two different role mechanisms. In MySQL 8.0 and later, the role is similar to another user, with username and host ('role1'@'localhost'). Yes, that is the role name, which is practically similar to the standard user-host definition. MySQL stores the role definition just like storing user privileges in the mysql.user system table.

MariaDB had introduced role and access privileges in MariaDB version 10.0.5 (Nov 2013), a good 8 years before MySQL included this feature in MySQL8.0. It follows similar role management in a SQL-compliant database system, more robust and much easier to understand. MariaDB stores the definition in the mysql.user system table flagged with a newly added column called is_role. MySQL stores the role differently, using a user-host combination similar to the standard MySQL user management.

Having said that, role migration between these two DBMSs is now incompatible with each other.

MariaDB Administrative and Backup Roles

MySQL has dynamic privileges, which provide a set of privileges for common administration tasks. For MariaDB, we can set similar things using roles, especially for backup and restore privileges. For MariaDB Backup, since it is a physical backup and requires a different set of privileges, we can create a specific role for it to be assigned to another database user.

Firstly, create a role and assign it with the right privileges:

MariaDB> CREATE ROLE mariadb_backup;
MariaDB> GRANT RELOAD, LOCK TABLES, PROCESS, REPLICATION CLIENT ON *.* TO mariadb_backup;

We can then create the backup user, grant it with mariadb_backup role and assign the default role:

MariaDB> CREATE USER mariabackup_user1@localhost IDENTIFIED BY 'passw0rdMMM';
MariaDB> GRANT mariadb_backup TO mariabackup_user1@localhost;
MariaDB> SET DEFAULT ROLE mariadb_backup FOR mariabackup_user1@localhost;

For mysqldump or mariadb-dump, the minimal privileges to create a backup can be set as below:

MariaDB> CREATE ROLE mysqldump_backup;
MariaDB> GRANT SELECT, SHOW VIEW, TRIGGER, LOCK TABLES ON *.* TO mysqldump_backup;

We can then create the backup user, grant it with the mysqldump_backup role and assign the default role:

MariaDB> CREATE USER dump_user1@localhost IDENTIFIED BY 'p4ss182MMM';
MariaDB> GRANT mysqldump_backup TO dump_user1@localhost;
MariaDB> SET DEFAULT ROLE mysqldump_backup FOR dump_user1@localhost;

For restoration, it commonly requires a different set of privileges, which is a bit:

MariaDB> CREATE ROLE mysqldump_restore;
MariaDB> GRANT SUPER, ALTER, INSERT, CREATE, DROP, LOCK TABLES, REFERENCES, SELECT, CREATE ROUTINE, TRIGGER ON *.* TO mysqldump_restore;

We can then create the restore user, grant it with the mysqldump_restore role, and assign the default role:

MariaDB> CREATE USER restore_user1@localhost IDENTIFIED BY 'p4ss182MMM';
MariaDB> GRANT mysqldump_restore TO restore_user1@localhost;
MariaDB> SET DEFAULT ROLE mysqldump_restore FOR restore_user1@localhost;

By using this trick we can simplify the administrative user creation process by assigning a role with pre-defined privileges. Thus, our GRANT statement can be shortened and easy to understand.

Creating Role Over Role In MariaDB 

We can create another role over an existing role similar to a nested group membership with more fine-grained control over privileges. For example, we could create the following 4 roles:

MariaDB> CREATE ROLE app_developer, app_reader, app_writer, app_structure;

Grant the privileges to manage the schema structure to the app_structure role:

MariaDB> GRANT CREATE, ALTER, DROP, CREATE VIEW, CREATE ROUTINE, INDEX, TRIGGER, REFERENCES ON app.* to app_structure;

Grant the privileges for Data Manipulation Language (DML) to the app_writer role:

MariaDB> GRANT INSERT, DELETE, UPDATE, CREATE TEMPORARY TABLES app.* to app_writer;

Grant the privileges for Data Query Language (DQL) to the app_reader role:

MariaDB> GRANT SELECT, LOCK TABLES, SHOW VIEW app.* to app_reader;

And finally, we can assign all of the above roles to app_developer which should have full control over the schema:

MariaDB> GRANT app_structure TO app_developer;
MariaDB> GRANT app_reader TO app_developer;
MariaDB> GRANT app_writer TO app_developer;

The roles are ready and now we can create a database user with app_developer role:

MariaDB> CREATE USER 'michael'@'192.168.0.%' IDENTIFIED BY 'passw0rdMMMM';
MariaDB> GRANT app_developer TO 'michael'@'192.168.0.%';
MariaDB> GRANT app_reader TO 'michael'@'192.168.0.%';

Since Michael now belongs to the app_deleloper and app_reader roles, we can also assign the lowest privileges as the default role to protect him against unwanted human mistake:

MariaDB> SET DEFAULT ROLE app_reader FOR 'michael'@'192.168.0.%';

The good thing about using a role is you can hide the actual privileges from the database user. Consider the following database user just logged in:

MariaDB> SELECT user();
+----------------------+
| user()               |
+----------------------+
| michael@192.168.0.10 |
+----------------------+

When trying to retrieve the privileges using SHOW GRANTS, Michael would see:

MariaDB> SHOW GRANTS FOR 'michael'@'192.168.0.%';
+----------------------------------------------------------------------------------------------------------------+
| Grants for michael@localhost                                                                                   |
+----------------------------------------------------------------------------------------------------------------+
| GRANT `app_developer` TO `michael`@`localhost`                                                                 |
| GRANT USAGE ON *.* TO `michael`@`localhost` IDENTIFIED BY PASSWORD '*2470C0C06DEE42FD1618BB99005ADCA2EC9D1E19' |
+----------------------------------------------------------------------------------------------------------------+

And when Michael is trying to look up for the app_developer's privileges, he would see this error:

MariaDB> SHOW GRANTS FOR FOR app_developer;
ERROR 1044 (42000): Access denied for user 'michael'@'localhost' to database 'mysql'

This trick allows the DBAs to exhibit only the logical grouping where the user belongs and nothing more. We can reduce the attack vector from this aspect since the users will have no idea of the actual privileges being assigned to them.

Enforcing Default Role In MariaDB

By enforcing a default role, a database user can be protected at the first layer against accidental human mistakes. For example, consider user Michael which has been granted the app_developer role, where the app_developer role is a superset of app_strucutre, app_writer and app_reader roles, as illustrated below:

Since Michael belongs to the app_deleloper role, we can also set the lowest privilege as the default role to protect him against accidental data modification:

MariaDB> GRANT app_reader TO 'michael'@'192.168.0.%';
MariaDB> SET DEFAULT ROLE app_reader FOR 'michael'@'192.168.0.%';

As for user "michael", he would see the following once logged in:

MariaDB> SELECT user(),current_role();
+-------------------+----------------+
| user()            | current_role() |
+-------------------+----------------+
| michael@localhost | app_reader     |
+-------------------+----------------+

Its default role is app_reader, which is a read_only privilege for a database called "app". The current user has the ability to switch between any applicable roles using the SET ROLE feature. As for Michael, he can switch to another role by using the following statement:

MariaDB> SET ROLE app_developer;

At this point, Michael should be able to write to the database 'app' since app_developer is a superset of app_writer and app_structure. To check the available roles for the current user, we can query the information_schema.applicable_roles table:

MariaDB> SELECT * FROM information_schema.applicable_roles;
+-------------------+---------------+--------------+------------+
| GRANTEE           | ROLE_NAME     | IS_GRANTABLE | IS_DEFAULT |
+-------------------+---------------+--------------+------------+
| michael@localhost | app_developer | NO           | NO         |
| app_developer     | app_writer    | NO           | NULL       |
| app_developer     | app_reader    | NO           | NULL       |
| app_developer     | app_structure | NO           | NULL       |
| michael@localhost | app_reader    | NO           | YES        |
+-------------------+---------------+--------------+------------+

This way, we are kind of setting a primary role for the user, and the primary role can be the lowest privilege possible for a specific user. The user has to consent about its active role, by switching to another privileged role before executing any risky activity to the database server.

Role Mapping in MariaDB

MariaDB provides a role mapping table called mysql.roles_mapping. The mapping allows us to easily understand the correlation between a user and its roles, and how a role is mapped to another role:

MariaDB> SELECT * FROM mysql.roles_mapping;
+-------------+-------------------+------------------+--------------+
| Host        | User              | Role             | Admin_option |
+-------------+-------------------+------------------+--------------+
| localhost   | root              | app_developer    | Y            |
| localhost   | root              | app_writer       | Y            |
| localhost   | root              | app_reader       | Y            |
| localhost   | root              | app_structure    | Y            |
|             | app_developer     | app_structure    | N            |
|             | app_developer     | app_reader       | N            |
|             | app_developer     | app_writer       | N            |
| 192.168.0.% | michael           | app_developer    | N            |
| localhost   | michael           | app_developer    | N            |
| localhost   | root              | mysqldump_backup | Y            |
| localhost   | dump_user1        | mysqldump_backup | N            |
| localhost   | root              | mariadb_backup   | Y            |
| localhost   | mariabackup_user1 | mariadb_backup   | N            |
+-------------+-------------------+------------------+--------------+

From the above output, we can tell that a User without a Host is basically a role over a role and administrative users (Admin_option = Y) are also being assigned to the created roles automatically. To get the list of created roles, we can query the MySQL user table:

MariaDB> SELECT user FROM mysql.user WHERE is_role = 'Y';
+------------------+
| User             |
+------------------+
| app_developer    |
| app_writer       |
| app_reader       |
| app_structure    |
| mysqldump_backup |
| mariadb_backup   |
+------------------+

Final Thoughts

Using roles can improve database security by providing an additional layer of protection against accidental data modification by the database users. Furthermore, it simplifies the privilege management and maintenance operations for organizations that have many database users.

Tips and Trick using Audit Logging for MariaDB

$
0
0

MariaDB’s Audit Plugin provides auditing functionality for not only MariaDB but MySQL as well (as of, version 5.5.34 and 10.0.7) and Percona Server. MariaDB started including by default the Audit Plugin from versions 10.0.10 and 5.5.37, and it can be installed in any version from MariaDB 5.5.20.


The purpose of the MariaDB Audit Plugin is to log the server's activity. For each client session, it records who connected to the server (i.e., user name and host), what queries were executed, and which tables were accessed and server variables that were changed. This information is stored in a rotating log file or it may be sent to the local syslogd.


In this blog post, we are going to show you some best-practice tunings and tips on how to configure audit logging for a MariaDB server. The writing is based on MariaDB 10.5.9, with the latest version of MariaDB Audit Plugin 1.4.4.
 

Installation Tuning


The recommended way to enable audit logging is by setting the following lines inside the MariaDB configuration file:

[mariadb]
plugin_load_add = server_audit # load plugin
server_audit=FORCE_PLUS_PERMANENT  # do not allow users to uninstall plugin
server_audit_file_path=/var/log/mysql/mariadb-audit.log # path to the audit log
server_audit_logging=ON  # enable audit logging

Do not forget to set "server_audit=FORCE_PLUS_PERMANENT" to enforce the audit log and disallow it to be uninstalled by other users using the UNINSTALL SONAME statement. By default, the logging destination is a log file in the MariaDB data directory. We should put the audit log outside of this directory because there is a chance that the datadir will be wiped out (SST for Galera Cluster), or being replaced for a physical restore like datadir swapping when restoring a backup taken from MariaDB Backup.

Further tuning is necessary, as shown in the following sections.

Audit Events Filtering

MariaDB Audit plugin utilizes several log settings that depending on the plugin version. The following audit events are available on the latest plugin version 1.4.4:


Type

Description

CONNECT

Connects, disconnects and failed connects, including the error code

QUERY

Queries executed and their results in plain text, including failed queries due to syntax or permission errors

TABLE

Tables affected by query execution

QUERY_DDL

Similar to QUERY, but filters only DDL-type queries (CREATE, ALTER, DROP, RENAME and TRUNCATE statements - except CREATE/DROP [PROCEDURE / FUNCTION / USER] and RENAME USER (they're not DDL)

QUERY_DML

Similar to QUERY, but filters only DML-type queries (DO, CALL, LOAD DATA/XML, DELETE, INSERT, SELECT, UPDATE, HANDLER and REPLACE statements)

QUERY_DML_NO_SELECT

Similar to QUERY_DML, but doesn't log SELECT queries. (since version 1.4.4) (DO, CALL, LOAD DATA/XML, DELETE, INSERT, UPDATE, HANDLER and REPLACE statements)

QUERY_DCL

Similar to QUERY, but filters only DCL-type queries (CREATE USER, DROP USER, RENAME USER, GRANT, REVOKE and SET PASSWORD statements)


By default, it will track everything since the server_audit_events variable will be set to empty by default. Note that older versions have less support for the above operation type, as shown here. So make sure you are running on the latest version if you want to do specific filtering. 


If the query cache is enabled, and a query is returned from the query cache, no TABLE records will appear in the log since the server didn't open or access any tables and instead relied on the cached results. So you may want to disable query caching.


To filter out specific events, set the following line inside the MariaDB configuration file (requires restart):

server_audit_events = 'CONNECT,QUERY,TABLE'

Or set it dynamically in the runtime using SET GLOBAL (requires no restart, but not persistent):

MariaDB> SET GLOBAL server_audit_events = 'CONNECT,QUERY,TABLE';

This is the example of one audit event:

20210325 02:02:08,ip-172-31-0-44,cmon,172.31.1.119,7,226,QUERY,information_schema,'SHOW GLOBAL VARIABLES',0

An entry of this log consists of a bunch of information separated by a comma containing the following information:

  • Timestamp

  • The MySQL host (identical with the value of SELECT @@hostname)

  • The database user

  • Host where the user was connecting

  • Connection ID

  • Thread ID

  • Operation

  • Database

  • SQL statement/command

  • Return code. 0 means the operation returns a success response (even empty), while a non-zero value means an error executing the operation like a failed query due to syntax or permission errors.


When filtering the entries, one would do a simple grep and look for a specific pattern:

$ grep -i global /var/lib/mysql/server_audit.log
20210325 04:19:17,ip-172-31-0-44,root,localhost,14,37080,QUERY,,'set global server_audit_file_rotate_now = 1',0
20210326 00:46:48,ip-172-31-0-44,root,localhost,35,329003,QUERY,,'set global server_audit_output_type = \'syslog\'',0

By default, all passwords value will be masked with asterisks:

20210326 05:39:41,ip-172-31-0-44,root,localhost,52,398793,QUERY,mysql,'GRANT ALL PRIVILEGES ON sbtest.* TO sbtest@127.0.0.1 IDENTIFIED BY *****',0

Audit User Filtering

If you track everything, you probably will be flooded with the monitoring user for its sampling responsibility, as shown in the example below:

20210325 02:02:08,ip-172-31-0-44,cmon,172.31.1.119,7,226,QUERY,information_schema,'SHOW GLOBAL VARIABLES',0
20210325 02:02:08,ip-172-31-0-44,cmon,172.31.1.119,7,227,QUERY,information_schema,'select @@global.wsrep_provider_options',0
20210325 02:02:08,ip-172-31-0-44,cmon,172.31.1.119,7,228,QUERY,information_schema,'SHOW SLAVE STATUS',0
20210325 02:02:08,ip-172-31-0-44,cmon,172.31.1.119,7,229,QUERY,information_schema,'SHOW MASTER STATUS',0
20210325 02:02:08,ip-172-31-0-44,cmon,172.31.1.119,7,230,QUERY,information_schema,'SHOW SLAVE HOSTS',0
20210325 02:02:08,ip-172-31-0-44,cmon,172.31.1.119,7,231,QUERY,information_schema,'SHOW GLOBAL VARIABLES',0
20210325 02:02:08,ip-172-31-0-44,cmon,172.31.1.119,7,232,QUERY,information_schema,'select @@global.wsrep_provider_options',0
20210325 02:02:08,ip-172-31-0-44,cmon,172.31.1.119,7,233,QUERY,information_schema,'SHOW SLAVE STATUS',0
20210325 02:02:08,ip-172-31-0-44,cmon,172.31.1.119,7,234,QUERY,information_schema,'SHOW MASTER STATUS',0
20210325 02:02:08,ip-172-31-0-44,cmon,172.31.1.119,7,235,QUERY,information_schema,'SHOW SLAVE HOSTS',0
20210325 02:02:08,ip-172-31-0-44,cmon,172.31.1.119,5,236,QUERY,information_schema,'SET GLOBAL SLOW_QUERY_LOG=0',0
20210325 02:02:08,ip-172-31-0-44,cmon,172.31.1.119,5,237,QUERY,information_schema,'FLUSH /*!50500 SLOW */ LOGS',0
20210325 02:02:08,ip-172-31-0-44,cmon,172.31.1.119,6,238,QUERY,information_schema,'SHOW GLOBAL STATUS',0

In the span of one second, we can see 14 QUERY events recorded by the audit plugin for our monitoring user called "cmon". In our test workload, the logging rate is around 32 KB per minute, which will accumulate up to 46 MB per day. Depending on the storage size and IO capacity, this could be excessive in some workloads. So it would be better to filter out the monitoring user from the audit logging, so we could have a cleaner output and is much easier to audit and analyze.

Depending on the security and auditing policies, we could filter out the unwanted user like the monitoring user by using the following variable inside the MariaDB configuration file (requires restart):

server_audit_excl_users='cmon'

Or set it dynamically in the runtime using SET GLOBAL (requires no restart, but not persistent):

MariaDB> SET GLOBAL server_audit_excl_users = 'cmon'

You can add multiple database users, separated by comma. After adding the above, we got a cleaner audit logs, as below (nothing from the 'cmon' user anymore):

$ tail -f /var/log/mysql/mysql-audit.log
20210325 04:16:06,ip-172-31-0-44,cmon,172.31.1.119,6,36218,QUERY,information_schema,'SHOW GLOBAL STATUS',0
20210325 04:16:06,ip-172-31-0-44,root,localhost,13,36219,QUERY,,'set global server_audit_excl_users = \'cmon\'',0
20210325 04:16:09,ip-172-31-0-44,root,localhost,13,36237,QUERY,,'show global variables like \'%server_audit%\'',0
20210325 04:16:12,ip-172-31-0-44,root,localhost,13,0,DISCONNECT,,,0

Log Rotation Management

Since the audit log is going to capture a huge number of events, it is recommended to configure a proper log rotation for it. Otherwise, we would end up with an enormous size of logfile which makes it very difficult to analyze. While the server is running, and server_audit_output_type=file, we can force the logfile rotation by using the following statement:

MariaDB> SET GLOBAL server_audit_file_rotate_now = 1;

For automatic log rotation, we should set the following variables inside the MariaDB configuration file:

server_audit_file_rotate_size=1000000 # in bytes
server_audit_file_rotations=30

Or set it dynamically in the runtime using SET GLOBAL (require no restart):

MariaDB> SET GLOBAL server_audit_file_rotate_size=1000000;
MariaDB> SET GLOBAL server_audit_file_rotations=30;

To disable audit log rotation, simply set the server_audit_file_rotations to 0. The default value is 9. The log rotation will happen automatically after it reaches the specified threshold and will keep the last 30 logs, which means the last 30 days' worth of audit logging.

Auditing using Syslog or Rsyslog Facility

Using the syslog or rsyslog facility will make log management easier because it permits the logging from different types of systems in a central repository. Instead of maintaining another logging component, we can instruct the MariaDB Audit to log to syslog. This is handy if you have a log collector/streamer for log analyzer services like Splunk, LogStash, Loggly or Amazon CloudWatch.

To do this, set the following lines inside MariaDB configuration file (requires restart):

server_audit_logging = 'syslog'
server_audit_syslog_ident = 'mariadb-audit'

Or if you want to change in the runtime (requires no restart, but not persistent):

MariaDB> SET GLOBAL server_audit_logging = 'syslog';
MariaDB> SET GLOBAL server_audit_syslog_ident = 'mariadb-audit';

The entries will be similar to the syslog format:

$ grep mariadb-audit /var/log/syslog
Mar 26 00:48:49 ip-172-31-0-44 mariadb-audit:  ip-172-31-0-44,root,localhost,36,329540,QUERY,,'SET GLOBAL server_audit_syslog_ident = \'mariadb-audit\'',0
Mar 26 00:48:54 ip-172-31-0-44 mariadb-audit:  ip-172-31-0-44,root,localhost,36,0,DISCONNECT,,,0

If you want to set up a remote logging service for a centralized logging repository, we can use rsyslog. The trick is to use the variable server_audit_syslog_facility where we can create a filter to facilitate logging, similar to below:

MariaDB> SET GLOBAL server_audit_logging = 'syslog';
MariaDB> SET GLOBAL server_audit_syslog_ident = 'mariadb-audit';
MariaDB> SET GLOBAL server_audit_syslog_facility = 'LOG_LOCAL6';

However, there are some prerequisite steps beforehand. Consider the following MariaDB master-slave replication architecture with a centralized rsyslog server:


In this example, all servers are running on Ubuntu 20.04. On the rsyslog destination server, we need to set the following inside /etc/rsyslog.conf:

module(load="imtcp")
input(type="imtcp" port="514")
$ModLoad imtcp
$InputTCPServerRun 514
if $fromhost-ip=='172.31.0.44' then /var/log/mariadb-centralized-audit.log
& ~
if $fromhost-ip=='172.31.0.82' then /var/log/mariadb-centralized-audit.log
& ~

Note that the "& ~" part is important and don't miss that out. It basically tells the logging facility to log into /var/log/mariadb-centralized-audit.log and stop further processing right after that.

Next, create the destination log file with the correct file ownership and permission:

$ touch /var/log/mariadb-centralized-audit.log
$ chown syslog:adm /var/log/mariadb-centralized-audit.log
$ chmod 640 /var/log/mariadb-centralized-audit.log

Restart rsyslog:

$ systemctl restart rsyslog

Make sure it listens on all accessible IP addresses on TCP port 514:

$ netstat -tulpn | grep rsyslog
tcp        0      0 0.0.0.0:514             0.0.0.0:*               LISTEN      3143247/rsyslogd
tcp6       0      0 :::514                  :::*                    LISTEN      3143247/rsyslogd

We have completed configuring the destination rsyslog server. Now we are ready to configure the source part. On the MariaDB server, create a new separate rsyslog configuration file at /etc/rsyslog.d/50-mariadb-audit.conf and add the following lines:

$WorkDirectory /var/lib/rsyslog # where to place spool files
$ActionQueueFileName queue1     # unique name prefix for spool files
$ActionQueueMaxDiskSpace 1g     # 1GB space limit (use as much as possible)
$ActionQueueSaveOnShutdown on   # save messages to disk on shutdown
$ActionQueueType LinkedList     # run asynchronously
$ActionResumeRetryCount -1      # infinite retries if rsyslog host is down
local6.* action(type="omfwd" target="172.31.6.200" port="514" protocol="tcp")

The settings in the first section are about creating an on-disk queue, which is recommended to not get any log entry lost. The last line is important. We changed the variable server_audit_syslog_facility to LOG_LOCAL6 for the audit plugin. Here, we specified "local6.*" as a filter to only forward Syslog entries using facility local6 to rsyslog running on the rsyslog server 172.31.6.200, on port 514 via TCP protocol.

To activate the changes for rsyslog, the last step is to restart the rsyslog on the MariaDB server to activate the changes:

$ systemctl restart rsyslog


Now, rsyslog is correctly configured on the source node. We can test out by accessing the MariaDB server and perform some activities to generate audit events. You should see the audit log entries are forwarded here:

$ tail -f /var/log/mariadb-centralized-audit.log
Mar 26 12:56:18 ip-172-31-0-44 mariadb-audit:  ip-172-31-0-44,root,localhost,69,0,CONNECT,,,0
Mar 26 12:56:18 ip-172-31-0-44 mariadb-audit:  ip-172-31-0-44,root,localhost,69,489413,QUERY,,'select @@version_comment limit 1',0
Mar 26 12:56:19 ip-172-31-0-44 mariadb-audit:  ip-172-31-0-44,root,localhost,69,489414,QUERY,,'show databases',0
Mar 26 12:56:37 ip-172-31-0-44 mariadb-audit:  ip-172-31-0-44,root,localhost,69,0,DISCONNECT,,,0

Final Thoughts

MariaDB Audit Plugin can be configured in many ways to suit your security and auditing policies. Auditing information can help you troubleshoot performance or application issues, and lets you see exactly what SQL queries are being processed.


Enforcing Role-Based Access Controls with ClusterControl

$
0
0

In Severalnines’ recent release of ClusterControl version 1.8.2 we have introduced a lot of sophisticated features and changes. One of the important features is the newly improved User Management System, which covers New User and LDAP Management.  A complementary existing capability in ClusterControl is its Role-Based Access Control (RBAC) for User Management, which is the focus of this blog.

Role-Based Access Control in ClusterControl

For those who are not familiar with ClusterControl's Role-Based Access Controls (RBAC), it's a feature that enables  you to restrict the access of certain users to specific database cluster features and administrative actions or tasks. For example, access to deployment (add load balancers, add existing cluster), management, and monitoring features. This ensures that only authorized users are allowed to work and view based on their respective roles and avoids unwanted intrusion or human errors by limiting a role’s access to administrative tasks. Access to functionality is fine-grained, allowing access to be defined by an organization or user. ClusterControl uses a permissions framework to define how a user may interact with the management and monitoring functionality based on their level of authorization. 

Role-Based Access Control in ClusterControl plays an important role especially for admin users that are constantly utilizing it as part of their DBA tasks. A ClusterControl DBA should be familiar with this feature as it allows the DBA to delegate tasks to team members, control access to ClusterControl functionality, and not expose all of the features and functionalities to all users. This can be achieved by utilizing the User Management functionality, which allows you to control who can do what. For example, you can set up a Team such as analyst, devops, or DBA, and add restrictions according to their scope of responsibilities for  a given database cluster.

ClusterControl access control is depicted in  the following diagram,

Details of the terms used above are provided, below. A Team can be assigned to one or more of the database clusters managed by ClusterControl. A Team consists of empty or multiple users in a Team. By default, when creating a new Team, the super admin account will always be associated with it. Deleting superadmin doesn't take it away from being linked to that new Team.

A User and a Cluster have to be assigned to a Team; it is a mandatory implementation within ClusterControl. By default, the super-admin account is designated to an Admin team, which has already been created by default. Database Clusters are also assigned to the Admin team by default.

A Role can have no User assigned or it can be assigned to multiple users in accordance with their ClusterControl role.

Roles in ClusterControl

Roles in ClusterControl are actually set by default. These default roles follow:

  • Super Admin - It is a hidden role, but it is the super administrator (superadmin) role, which means all features are available for this role. By default, the user that you created after a successful installation represents your Super Admin role. Additionally, when creating a new Team the superadmin is always assigned to the new Team by default. 

  • Admin - By default, almost all the features are viewable. Being viewable means that users under the Admin role can do management tasks. The features that are not available for this role are the Customer Advisor and SSL Key Management.

  • User - Integrations, access to all clusters, and some features are not available for this role and are denied by default. This is useful if you want to assign regular users that are not intended to work database or administrative tasks. There are some manual steps to be done for those in the User role to see other clusters.

Roles in ClusterControl are arbitrary so administrators can create arbitrary roles and assign them to a user under Teams. 

How to Get Into ClusterControl Roles

You can create a custom role with its own set of access levels. Assign the role to a specific user under the Teams tab. This can be reached by locating User Management in the side-bar in the right corner. See the screenshot, below:


Enforcing Role-Based Access Controls with ClusterControl

Enforcing RBAC is user domain-specific, which restricts a user's access to ClusterControl features in accordance with their roles and privileges. With this in mind,  we should start creating a specific user. 

Creating a User in ClusterControl

To create a user, start under the User Management ➝ Teams tab. Now, let's create a Team first. 

Once created, there is a super-admin account which is linked by default once a Team is created.

Now, let's add a new user. Adding a new user has to be done under a Team, so we can create it under DevOps.

As you might have noticed, the new user we created is now under the role User, which is added by default within ClusterControl. Then the Team is also under DevOps. 

Basically, there are two users now under the DevOps Team as shown below:

Take note that Roles are user domain-specific, so it applies access restrictions only to that specific user, and not to the Team where it belongs.

Admin vs User Roles (Default Roles in ClusterControl)

Since we have two roles added by default in ClusterControl, there are limitations that are set by default. To know what are these, just go to  User Management ➝ Access Control. Below is a screenshot that depicts the available features or privileges that a user belonging to the role can do:

Admin Role

User Role


The Admin role has many more privileges, whereas the User Role has some privileges that are restricted. These default roles can be modified in accordance to your desired configuration. Adding a Role also allows you to start and set which roles are  allowed or not. For example, we'll create a new Role. To create a role, just hit the "+" plus button along the roles. You can see the new role we've created called Viewer.

All ticks are unchecked. Just check under the Allow column to enable the feature or privilege or check under the Deny column if you want to deny access. The Manage column allows the users in that role to do management tasks. Whereas the Modify column allows you to enable modifications that are only available to privileges or features under Alarms, Jobs, and Settings.

Testing RBAC

In this example, the following clusters are present in my controller as shown below:

This is viewable by the super administrator account in this environment. 

Now that we have RBAC set for the user we just created, let's try to log in using the email and password we have just set.

This is what is created,

No clusters are available and viewable, and some privileges are denied as shown below such as Key Management Settings and the E-mail Notifications:

Adjusting RBAC

Since the privileges in the roles are mutable, it's easy to manage them via User Management ➝ Access Control. 

Now, let's allow the created user to view a cluster. Since our user has Access All Clusters denied, we need to enable it. See below,

Now, as we have stated earlier based on the diagram, Clusters are controlled by the Team. For example, there are the following cluster assignments,  below:

Since we need to assign the cluster to the right team, selecting the specific cluster and clicking the "Change Team" button will show the prompt allowing you to re-assign it to the right Team.

Now, let's assign it to DevOps.

Now, logged back in as the newly created user, and we'll be able to see the cluster.

Summary

Role-Based Access Control (RBAC) in ClusterControl is a feature that provides fine-grained restrictive access control for every user you have created in the ClusterControl, enabling greater security and more restrictive access control based on a user’s role.

How to Get Started With Database Automation

$
0
0

Database automation helps make complex and time consuming tasks simple and fast. The tasks most commonly and easily identified for automation are those that are time-consuming yet repetitive. These often consume productivity, and can affect company finances because you have to pay the people working on these tasks. However, the processes in which time and effort are needlessly consumed can be converted to virtual automation, thereby avoiding often dull, exhausting work.


Database automation has been a common practice of database administrators and server administrators, who together are more commonly known now as DevOps. DevOps also refers to the combination of DBAs’ and server admin tasks. In the old fashioned way, traditional and common automated tasks are written as a series of SQL statements or .sql files, which deploy and provision servers via scripts, setting up encryption/decryption, or harnessing security for the environment in which your automation is supposed to run. Here, automation is not an example of a company replacing people with scripts. It is there as an assistant to bring things up to speed, and finish tasks faster with fewer errors. Automation cannot replace the way DBAs perform their tasks or the value they can deliver to the entire company or organization.

Sophisticated tools for Infrastructure as Code (IaC) such as Puppet, Chef, Ansible, SaltStack, and Terraform help DBAs complete those tasks that are easily replicated, such as backup and restore, failing over, deployment of new clusters, adjusting security settings, OS Kernel and database performance tuning, and a lot more. With the help of automation, a lot of DBAs have also improved or shifted their skills from focusing on data-domain specific tasks to also cover how to code in order to utilize these IaC tools that make things easier than using the traditional approach. There are also tools at-present that make it easier to manage your assets in the cloud,  such as managing your company user accounts, logs, deploying instances, or managing your servers. Tools for the cloud from the big-three cloud providers include AWS CloudFormation, Azure Resource Manager, and Google Cloud Deployment Manager and allow DBAs or DevOps to leverage the power of automation and make things faster. This not only impresses your organization or company's executives, but also the customers relying on your service.

What Needs to be Automated?

As mentioned above, database automation is not new for DBAs, server administrators or even DevOps. There's no reason to hesitate or question whether to automate. As stated earlier, common cases that are easily identified for automation are tasks that are repetitive in nature. 

Below, we enumerate things that are axiomatic from the DBA’s perspective.

  • Provisioning of your servers (e.g., initiate VM instances such as using vagrant, initiate docker, or initiate your Kubernetes platform) and setup SSH access or setup VPN access

  • Deployment of a new database cluster

    • Identify what type of database provider, the type of setup (primary/standby, master-master replication, synchronous replication)

  • Import existing database cluster

  • Deploy/import existing databases to your current database cluster

  • Auto-failover or switchover

  • Automatic node or cluster recovery

  • Replica/Slave promotion or Demoting a master

  • Deployment of load balancers (e.g. ProxySQL, HaProxy, pgpool, pgbouncer, MaxScale, Keepalived)

  • Backup and Restore

  • Setup your database monitoring environment (e.g., deploy agent-based monitoring such as Prometheus)

  • Enable security adjustments

  • Perform automatic optimizations and tuning in accordance with the type of environment

  • Enable alerting systems to other third-party integrations

  • Generate alerts or alarms and notifications

  • Generate reports such as graphs

  • Process query logs (slow logs) for query analysis

  • Generate query analysis

  • Database archival or clean up

There are of course a lot of cases that you could automate, but this lists the most common tasks and automating them is unquestionable. These are the types of tasks that are repetitive in nature and the majority are error-prone, especially when they have to be done quickly due to time constraints. 

What Are Things That Shouldn’t be Automated?

These areas are where your DBAs or SysAdmins do most of the work. Automation cannot replace the skill set and intelligence of the DBA when it comes to things that cannot be automated. 

It is understood that a DBA has to be skilled, with a profound understanding of:  the database they are using and the databases that will be deployed; the data that are being processed and stored; and whether the way they are being processed is secure, or if it complies with company security standards. DBAs also review and mostly are considered DevOps, as well the automation architect. They dictate what has to be done, and what won't be done. Common things that should not be automated are the following:


  • Setting your scheduled backups. Scheduled backups are of course automated and have to run accordingly, but the scheduled dates or period of time required should  be based on the low-peak times the server will perform. For example, you cannot take a backup if the cluster is busy during the daytime. There are common cases as well when servers are still busy at night depending on the type of application you are serving, and where it is geographically located.

  • Auto-failover failed to promote a new master. This is one of the most important cases and has to be well understood. If you have automated scripts designed for failover, it should not be designed to forcibly pursue a failover in case it happens to fail.. You might never know what is the main problem, and if there is a failure, there can be transactions that have to be recovered before anything else should be done. For example, it could be a financial transaction that was stored on the failed master, and you forcibly wanted to promote a slave, but the candidate slave had failed to replicate the latest transaction. In that case, you might end up with corrupted data.

  • Data Recovery. Of course, when you encounter data corruption or a cluster fails to recover from your automatic node/server recovery, you might have to investigate the primary cause. You have to document this for your RCA (Root Cause Analysis) to avoid it in the future. However, there are instances when the failure is a bug of the database software you are using, or it can be a VM corruption.

  • Data Drift or Data Inconsistency. This is definitely not an ideal situation for automation. You do not want your automaton to generalize or stereotype your data to a practice that would apply this concept: "if data is corrupted, let's automatically fix it". It's definitely not a good practice. There are a lot of cases that first have to be understood and investigated before you can decide. In MySQL, for example, there's a Percona tool called pt-table-checksum, then pt-table-sync for which both are correlative to each other on fixing data inconsistencies. You definitely won't want to automate this unless you know your data very well, or your data is not extensive, or the data can be regenerated.

  • Kernel tuning and database tuning. Of course, this can be seen as contradictory to what we have stated above. However, there are auto-tunable variables known for specific types of environments, such as memory, buffer pool, HugePages, or virtual memory parameters. However, there are definitely a lot of parameters that need understanding, investigation, testing, benchmarking before you decide to apply the changes or not.

Definitely, there are a lot of things you shouldn’t  automate that we did not mention. In the database world, there is an extensive number of situations that depends on the type of data and application you are serving. Keep that in mind, and be sensitive to the things that  can be automated. Otherwise, automation can lead to destruction.

Tools for Automation

This is where you can get started with your automation scripts. The most important component of automation is speed! When it comes to speed, it is not measured by how quickly a tool is able to finish the tasks, but how comfortable the developers or maintainers of the scripts or IaC are with the tool. Definitely, there are pros and cons for these automation tools available. What's more important is to determine the specifications of these automation tools, as there are more to offer aside from being just automation. More commonly, they provide configuration management and deployment mechanisms.

Automation is all about speed, that is, how fast it is in contrast to using a traditional approach, or using your own preferred language scripts. Of course, using your own scripts can be perfect, but if your organization or company is for technological advancement, then using third party tools such as Ansible, Puppet, Chef, SaltStack, or Terraform is more ideal. Why is it more ideal? These third-party tools are designed to defeat long and lengthy tasks to perform, and can be done with few lines of code. 

For example, Terraform is known for its portability benefits. Just Imagine, with Terraform, you have one tool and one language for describing infrastructure for Google Cloud, AWS, OpenStack and ANY other cloud. If you switch to another provider, you don't need to modify or redo your scripts. It also allows you to have full-stack deployment, and that includes managing your Kubernetes containers. Imagine that, from one tool, you can do a lot of things.

When starting your database automation, do not start from scratch because the goal of automation is speed! Again, speed is not measured here in how fast it is to finish the job, but how fast it is in comparison to a traditional approach or manual tasks. Of course, the speed of how quickly it’s  able to finish the job all depends, e.g., part of your scripts may cause long delays due to a bunch of processed data and long job executions.

Always Choose Based on Your Requirements

When choosing tools, do not rely on hype, or what's the most popular that you've heard of. Though the mainstream tools that were mentioned earlier are embraced largely by the community, they do introduce complexity as well.  For example, when using Ansible, you have to be familiar with YAML, while with Puppet or Chef, you have to be familiar with Ruby and its underlying domain-specific language.

Take Advantage of Available Enterprise Tools

There are a lot of promising database automation tools to get started with. If you feel it’s uncomfortable and time-consuming to hire DBAs, SysAdmins, or DevOps to extend your team, there are tools available that offer help when it comes to database management, backup management, and observability.

Severalnines ClusterControl for Database Automation

ClusterControl offers a lot of automated tasks that eliminate  the need for manual approaches. ClusterControl is designed to make database operations easy for organizations, companies, DBAs, SysAdmins, DevOps, and even developers. Its goal is to automate long-running and repetitious tasks. The great advantage of ClusterControl is that it is a mature database management tool and has extensive features that are very powerful to manage your database servers. It also applies the most up-to-date, industry-standard best practices for managing your databases. We listen to the demands of our customers, then we implement capabilities to meet them.

Some of the most feature-rich ClusterControl automation functionality that you can take advantage of are:

  • Deployment of your database servers. Choose the provider, specify the right version, determine what type of cluster, specify the server's hostname/IP such as username, password, etc.

  • Importing of existing servers to ClusterControl

  • Deployment in the cloud

  • Database health monitoring and reporting

  • Alerts and notifications

  • Backup and Restore

  • Backup Verification

  • Auto-failover, switchover

  • High-availability setup

  • Promote a slave or demote a master

  • Add new/existing replica to your cluster

  • Extend another cluster as a slave of another cluster (perfect for geographical setup for your disaster recovery)

  • Node and Cluster Recovery

  • LDAP integration

  • Third-party alert notifications

  • Deployment of any of an extensive list of load balancers  (pgbouncer, ProxySQL, MaxScale, HAProxy, Keepalived, garbd)

  • Deployment of agent-based monitoring using Prometheus exporters

  • Query analytics

  • Security adjustments

  • Auto tuning for OS kernel and database parameters

In addition to  all of these, ClusterControl also has built-in advisors that enable DBAs or DevOps to create their own scripts and integrate into ClusterControl Performance Advisors.

Summary

Database automation helps bring complex yet repetitive tasks up to speed. It helps DBAs to move quickly ahead on different tasks and improve their skills depending on the scope of work involved. Database automation frees DBAs to be more innovative while also comfortably managing the database. Database automation does not replace the role of the DBA. There will always be a need for skilled and smart people to manage your databases, especially when disaster strikes. Always rely on the tools that your DBAs recommend, while trusting their DBAs skills to manage the health and life of your databases.

Using Automation to Speed up Release Tests on Galera Cluster With ClusterControl

$
0
0

Release tests are typically one of the steps in the whole deployment process. You write the code, and then you verify how it behaves on a staging environment, and then, finally, you deploy the new code on the production. Databases are internal to any kind of application, and, therefore, it is important to verify how the database-related changes alter the application. It is possible to verify it in a couple of ways; one of them would be to use a dedicated replica. Let’s take a look at how it can be done.

Obviously, you don’t want this process to be manual - it should be a part of your company’s CI/CD processes. Depending on the exact application, environment and processes you have in place, you can be using replicas created ad-hoc or replicas that are always a part of the database environment. 

The way Galera Cluster works is that it handles schema changes in a specific manner. It is possible to execute a schema change on a single node in the cluster but it is tricky, as it does not support all possible schema changes, and it will affect production if something goes wrong. Such a node would have to be fully rebuilt using SST, which means that one of the remaining Galera nodes will have to act as a donor and transfer all of its data over the network. 

An alternative will be to use a replica or even a whole additional Galera Cluster acting as a replica. Obviously, the process has to be automated in order to plug it into the development pipeline. There are many ways to do this: scripts or numerous infrastructure orchestration tools like Ansible, Chef, Puppet or Salt stack. We won’t be describing them in detail, but we would like you to show the steps required for the whole process to work properly, and we’ll leave the implementation in one of the tools to you.

Automating Release Tests

First of all, we want to be able to deploy a new database easily. It should be provisioned with the recent data, and this can be done in many ways - you can copy the data from the production database into the test server; that’s the simplest thing to do. Alternatively, you can use the most recent backup - such an approach has additional benefits of testing the backup restoration. Backup verification is a must-have in any kind of serious deployments, and rebuilding test setups is a great way to double-check your restoration process works. It also helps you time the restore process- knowing how long it takes to restore your backup helps to correctly assess the situation in a disaster recovery scenario.

Once the data is provisioned in the database, you may want to set up that node as a replica of your primary cluster. It has its pros and cons. If you could re-execute all of your traffic to the standalone node, that’d be perfect - in such case, there is no need to set up the replication. Some of the load balancers, like ProxySQL, allow you to mirror the traffic and send its copy to another location. On the other hand, replication is the next best thing. Yes, you cannot execute writes directly on that node which forces you to plan how you will re-execute the queries since the simplest approach of just replying it won’t work. On the other hand, all writes will eventually be executed via the SQL thread, so you only have to plan how to deal with SELECT queries.

Depending on the exact change, you may want to test the schema change process. Schema changes are quite common to be performed, and they may have even serious performance impact on the database. Thus it is important to verify them before applying them to production. We want to look at the time needed to execute the change and verify if the change can be applied on nodes separately or is required to perform the change on the whole topology at the same time. This will tell us what process we should use for a given schema change.

Using ClusterControl to Improve Automation of the Release Tests

ClusterControl comes with a set of features that can be used to help you to automate the release tests. Let’s take a look at what it offers. To make it clear, the features we are going to show are available in a couple of ways. The simplest way is to use UI, but it is unnecessary what you want to do if you have automation on your mind. There are two more ways to do it: Command Line Interface to ClusterControl and RPC API. In both cases, jobs can be triggered from external scripts, allowing you to plug them into your existing CI/CD processes. It will also save you plenty of time, as deploying the cluster can be just a matter of executing one command instead of setting it up manually.

Deploying the test cluster

First and foremost, ClusterControl comes with an option to deploy a new cluster and provision it with the data from the existing database. This feature alone allows you to easily implement provisioning of the staging server. 

As you can see, as long as you have a backup created, you can create a new cluster and provision it using the data from the backup:

As we can see, there’s a quick summary of what will happen. If you click on Continue, you will proceed further.

As a next step, you should define the SSH connectivity - it has to be in place before ClusterControl is able to deploy the nodes.

Finally, you have to pick (among others) the vendor, version and hostnames of the nodes that you want to use in the cluster. That’s just it.

The CLI command that would accomplish the same thing looks like this:

s9s cluster --create --cluster-type=galera --nodes="10.0.0.156;10.0.0.157;10.0.0.158" --vendor=percona --cluster-name=PXC --provider-version=8.0 --os-user=root --os-key-file=/root/.ssh/id_rsa --backup-id=6

Configuring ProxySQL to mirror the traffic

If we have a cluster deployed, we may want to send the production traffic to it to verify how the new schema handles the existing traffic. One way to do this is by using ProxySQL.

The process is easy. First, you should add the nodes to ProxySQL. They should belong to a separate hostgroup that’s not in use yet. Make sure that ProxySQL monitor user will be able to access them.

Once this is done and you have all (or some) of your nodes configured in the hostgroup, you can edit the query rules and define the Mirror Hostgroup (it is available in the advanced options). If you want to do it for all of the traffic, you probably want to edit all of your query rules in this manner. If you want to mirror only SELECT queries, you should edit appropriate query rules. After this is done, your staging cluster should start receiving production traffic.

Deploying cluster as a slave

As we discussed earlier, an alternative solution would be to create a new cluster that will be acting as a replica of the existing setup. With such approach we can have all the writes tested automatically, using the replication. SELECTs can be tested using the approach we described above - mirroring through ProxySQL.

The deployment of a slave cluster is pretty straightforward.

Pick the Create Slave Cluster job.

You have to decide how you want to have the replication set. You can have all the data transferred from the master to the new nodes.

As an alternative, you can use existing backup to provision the new cluster. This will help to reduce the workload on the master node - instead of transferring all the data, only transactions that were executed between the time backup has been created and the moment the replication has been set up will have to be transferred.


The rest is to follow the standard deployment wizard, defining SSH connectivity, version, vendor, hosts and so on. Once it is deployed, you will see the cluster on the list.

Alternative solution to the UI is to accomplish this via RPC.

{
  "command": "create_cluster",
  "job_data": {
    "cluster_name": "",
    "cluster_type": "galera",
    "company_id": null,
    "config_template": "my.cnf.80-pxc",
    "data_center": 0,
    "datadir": "/var/lib/mysql",
    "db_password": "pass",
    "db_user": "root",
    "disable_firewall": true,
    "disable_selinux": true,
    "enable_mysql_uninstall": true,
    "generate_token": true,
    "install_software": true,
    "port": "3306",
    "remote_cluster_id": 6,
    "software_package": "",
    "ssh_keyfile": "/root/.ssh/id_rsa",
    "ssh_port": "22",
    "ssh_user": "root",
    "sudo_password": "",
    "type": "mysql",
    "user_id": 5,
    "vendor": "percona",
    "version": "8.0",
    "nodes": [
      {
        "hostname": "10.0.0.155",
        "hostname_data": "10.0.0.155",
        "hostname_internal": "",
        "port": "3306"
      },
      {
        "hostname": "10.0.0.159",
        "hostname_data": "10.0.0.159",
        "hostname_internal": "",
        "port": "3306"
      },
      {
        "hostname": "10.0.0.160",
        "hostname_data": "10.0.0.160",
        "hostname_internal": "",
        "port": "3306"
      }
    ],
    "with_tags": []
  }
}

Moving Forward

If you are interested in learning more about the ways you can integrate your processes with the ClusterControl, we would like to point you towards the documentation, where we have a whole section on developing solutions where ClusterControl plays a significant role: 

https://docs.severalnines.com/docs/clustercontrol/developer-guide/cmon-rpc/

https://docs.severalnines.com/docs/clustercontrol/user-guide-cli/

We hope you found this short blog informative and useful. If you have any questions related to integrating ClusterControl into your environment, please reach out to us, and we’ll do our best to help you.

Automated Testing of the Upgrade Process for PXC/MariaDB Galera Cluster

$
0
0

Upgrading your database for Galera-based clusters such as Percona XtraDB Cluster (PXC) or MariaDB Galera Cluster can be challenging, especially for a production-based environment. You cannot afford to lose the state of your high availability and put it at risk. 

An upgrade procedure must be well documented, and ideally, documentation, rigorous testing, and benchmarking should be done before upgrades. Most importantly, security and improvements also have to be identified based on the changelog of its database version upgrade. 

With all the concerns, automation helps to achieve a more efficient upgrade process, and helps avoid human error and improves RTO.

How to Manage PXC/MariaDB Galera Cluster Upgrade Process 

Upgrading your PXC/MariaDB Galera Cluster requires proper documentation and process flow that lists the things to be done and what things to do in case things go south. That means a Business Continuity Plan which shall also cover your Disaster Recovery Plan should be laid out. You cannot afford to lose your business in case of trouble. 

The usual take is to start first with the test environment. The test environment should have the exact same settings and configuration as your production environment. You cannot proceed directly with upgrading the production environment as you aren't sure what effect and impact it will occur if things do not accord to the plan. 

Working with a production environment is highly sensitive, so in most cases, a downtime and maintenance window is always there to avoid drastic impact. 

There are two types of an upgrade for PCX or MariaDB Galera Cluster that you need to be aware of. These are the major release upgrade and the minor release upgrade or often referred to as in-place upgrade. An in-place upgrade is where you can upgrade your database version to its most recent minor version using the same binary data of your database. There will be no physical changes to the data itself, but only on its database binary or underlying software packages.

Upgrading PCX or MariaDB Galera Cluster to a Major Release

Upgrading to a major release can be challenging, especially for a production environment. It involves a complex type of database configuration and special built-in features of PXC or MariaDB Galera Cluster. Spatiotemporal, time-stamped data, machine data, or any multi-faceted data are very conservative and sensitive to upgrades. You cannot apply an in-place upgrade for this process because many major changes would have been made. Unless you have very small data or data consisting of idempotents or data that can be generated easily can be safe to do as long as you know the impact won't affect your data.

If your data volume is large, then it’s best to have the upgrade process automated. However, It might not be an ideal solution to automate the all sequence in the upgrade process because there might be unexpected issues creeping in during the major upgrade phase. It is best to automate repetitive steps and processes with known outcomes in a major upgrade. At any point, a resource is required to evaluate if the automation process is safe to avoid any halts in the upgrade process. Automated testing after the upgrade is equally important, and it should be included as a part of the post-upgrade process.

Upgrading PCX or MariaDB Galera Cluster to a Minor Release

A minor release upgrade referred to as an in-placed upgrade is usually a safer approach to perform an upgrade process. This is because, the most common changes for this release are security and exploit patches or improvements, bugs (usually severe ones), or compatibility issues that require patches especially if the current hardware or OS had changes applied that can cause also the database not to function properly. Although the impact can usually be recoverable at a minimal effect, it is still a must that you have to look and read the changelog that was pushed to the specific minor version upgrade.

Deploying the job to perform the upgrade process is an ideal example for automation. The usual flow is very repetitive and mostly causes no harm to your existing PXC or MariaDB Galera Cluster. What matters most is that after the upgrade, automated testing shall proceed to determine the setup, configuration, efficiency, and functionality are not broken.

Avoid the Fiascoes! Be ready, Have it Automated!

A client of ours reached out to us asking for assistance because, after the database minor upgrade, a feature that they are using in the database is not properly working. They asked for steps and processes on how to downgrade and how safe it will be. Their customers were complaining that their application is totally not working, generalizing that it's not useful. 

Even for such a small glitch, a pissed off customer might give a bad remark to your product. The lesson learnt from this scenario is that failing in testing after an upgrade leads to an assumption that all functions in a database are working as expected.

Suppose you have plans to automate the upgrade process, then take note that type of automation process varies to the type of upgrades you have to do. As mentioned earlier, a major upgrade versus a minor upgrade has different distinct approaches. So your automaton setup might not apply to both database software upgrades.

Automating After the Upgrade Process

At this point, it is expected that you have your upgrade process done, ideally, through automation. Now that your database is ready to receive client connections, it has to follow with a rigorous testing phase.

Run mysql_upgrade

It is very important and extremely recommended to execute mysql_upgrade once the upgrade process has completed. mysql_upgrade looks for incompatibilities with the upgraded MySQL server by doing the following things:

  • It upgrades the system tables in the mysql schema so that you can take advantage of new privileges or capabilities that might have been added.

  • It upgrades the Performance Schema and sys schema.

  • It examines user schemas.

The mysql_upgrade determines if a table has problems such as incompatibilities due to changes in the most recent version after the upgrade and attempts to resolve it by repairing the table. Otherwise, if it fails, then your automation test shall have to fail and must not proceed onto something else. It has to be investigated first and do a manual repair.

Check error logs

Once the mysql_upgrade is done, you need to check and verify for the errors that occurred. You can put this into a script and check for any "error" or "warning" labels in the error logs. It is very important to determine if there's such. Your automated test must have the ability to catch error traps either it can wait for a user input to continue if the error is just very minimal or expected, otherwise stop the upgrade process.

Perform a unit test

A TDD (Test Driven Development) database environment is a software development approach where there are a series of test cases to be validated and determine if validation is true (pass) or false (fail). Something like what we have in the screenshot below:

Image courtesy of guru99.com

This is a type of unit testing helps avoid unwanted bugs or logical errors to your application and in your database. Remember, if there are invalid data stored in the database, that would harm all the business analytics and transactions especially if it involves complex financial computation or mathematical equations. 

If you ask, is it really necessary to perform a unit test after the upgrade? Of course, it is! You don't necessarily have to run this under the production environment. During the testing phases, i.e. upgrading first your QAs, development/staging environment, it has to be applied in that area. Data has to be an exact copy at least or almost the same as its production environment. Your goal here is to avoid unwanted results and definitely wrong logical results. You have to take good care of your data of course and, determine if the results pass the validation test.

If you intend to run with your production, then do it. However, do,not be as rigid as your testing phase applied in the QA, development, or staging environment. It is because you have to plan your time based on the available maintenance window and avoid delays and longer RTO. 

In my experience, during the upgrade phase, customers select a quicker approach that shall be important to determine if such a feature provides the correct result. Moreover, you can have a script to automate the test a set of business logical functions or stored procedures since it helps to cache the queries and make your database warm.

When preparing for Unit Test for your database, avoid reinventing the wheel. Instead, take a look at the available tools you can choose if it's good for your requirements and needs. Check out Selenium, or go check out this blog.

Verify identity of queries

The most common tool you can use is Percona's pt-upgrade. It verifies that query results are identical on different servers. It executes queries based on the given logs and supplied connection (or called as DSN), then compares the results and reports any significant differences. It offers more than that as your options to collect or analyze the queries such as through tcpdump, for example.

Using the pt-upgrade is easy. For example, you can run with the following command:

## Comparing via slow log for the given hosts
pt-upgrade h=host1 h=host2 slow.log

## or use fingerprints, useful for debugging purposes
pt-upgrade --fingerprints --run-time=1h mysqld-slow.log h=127.0.0.1,P=5091 h=127.0.0.1,P=5517

## or with tcpdump,
tcpdump -i eth0 port 3306 -s 65535  -x -n -q -tttt     \
  | pt-query-digest --type tcpdump --no-report --print \
  | pt-upgrade h=host1 h=host2

It's a good practice that once an upgrade, especially a major release upgrade has been performed, pt-upgrade is used to proceed and perform query analysis identifying differences based on the results. It is a good practice to do this during the testing phase while doing it on your QAs or staging and development environment so you can decide if it's safer to proceed. You can add this to your automation tool and run this as a playbook once it's ready to perform its duty.

How to Automate the Testing Process?

In our previous blogs, we have presented different ways to automate your databases. The most common tools that are vogue are these IaC (Infrastructure as Code) deployment software tools. You can use Puppet, Chef, SaltStack, or Ansible to do the job.

My preference has always been Ansible to perform my automated testing, it allows me to create playbooks by its job role. Of course, I cannot create one whole thing automaton that will do all the things because the situation and environment varies. Based on the given upgrade types earlier (major vs minor upgrade), you should put distinction to its process. Even if it's just an in-place upgrade, you still have to make sure that your playbooks shall perform the correct job.

ClusterControl is Your Database Automation Friend!

ClusterControl is a good option to perform basic and automated testing. ClusterControl is not a framework for testing; it’s not a tool to provide unit testing. However, it's a database management and monitoring tool that incorporates a lot of automated deployments based on the requested triggers from the user or administrator of the software. 

ClusterControl offers minor version upgrades, which provides convenience to the DBAs when performing upgrades. It does mysql_upgrade on the fly as well. So you do not need to perform it manually. ClusterControl also detects new versions to be upgraded and recommend the next steps for you to do. In case of failure is encountered, the upgrade will not proceed.

Here's an example of the minor upgrade job:

If you look carefully, the mysql_upgrade runs successfully. Whilst, it does not recommend and does an automatic upgrade of the master, it is because it is not the right approach to proceed. In that case, you have to promote the new slave, then demote the master as a slave to perform the upgrade.

Conclusion

The great thing with ClusterControl is that you can incorporate checking of error logs, perform a unit test, verify identity of queries by creating Advisors. It's not difficult to do so. You can refer to our previous blog Using ClusterControl Advisor to Create Checks for SELinux and Meltdown/Spectre: Part One. This exemplifies how you can take advantage and either trigger the next job to do once the upgrade is executed. ClusterControl has built-in alerts or alarms that can integrate to your favorite third-party alert systems to notify you of your automated testing’s current status.


Announcing CCX Database as a Service from Severalnines

$
0
0


We at Severalnines are thrilled to announce the release of CCX, our brand new database as a service (DBaaS) offering!  It’s a fully managed service built atop the powerful ClusterControl automated operational database management platform.  CCX enables you to simply click to deploy and access managed, secured MySQL, MariaDB and PostgreSQL database clusters on multiple Availability Zones on AWS. At last, database high availability and performance meets extreme ease-of-use. 

CCX Is Not Your Average DBaaS

 CCX is not your average DBaaS.  It includes a combination of advanced technologies that other DBaaS vendors do not.  Following are some of CCX’ capabilities.  

Database Automation and Management

  • CCX leverages the ClusterControl automation and management platform to provide unrivaled ease of management of open source databases and database clusters.  

High Availability 

  • CCX uses the powerful multi-master technology of Galera Cluster to support preconfigured, highly available deployments for MySQL and MariaDB. 

  • For PostgreSQL, CCX supports streaming replication, which enables the continuous transfer of data between nodes, keeping them current in real time.

  • CCX leverages ClusterControl’s powerful self-healing functionality to detect node anomalies and failures and, when they occur, automatically switches to standby nodes and repairs broken ones.

Traffic Management

  • ProxySQL provides database-aware advanced traffic management by default with MySQL and MariaDB Clusters. It routes queries on-demand, separating write-traffic from read-traffic, optimizes connection handling and enables throttling.

Security

  • VPC peering enables CCX to securely route traffic between your applications and the database servers without any exposure to the internet.

  • Advanced user management ensures that databases and the data contained within can only be accessed by authorized users.

  • Data is protected by a firewall and encrypted between the client and the server.

Monitoring

  • CCX provides advanced database monitoring capabilities including query monitoring, system monitoring, and specialized stats on the database and load balancers.

Disaster Recovery 

  • Full database backups are taken daily and incremental backups are taken hourly so data is always available should something go wrong.

Upgrades and Patches

  • Security and minor upgrade patches are applied automatically, ensuring databases are up-to-date and secure.

Database Experts

  • CCX is supported and managed by database experts with years of open source database experience.

Break Free 

With CCX you can break free from mundane database management and maintenance tasks and leave them to the powerful combination of ClusterControl automation and Severalnines database experts. 

Learn more at the CCX site or request a demo to see the difference CCX can make.

Automate Database Configuration Check

$
0
0

Many system administrators commonly overlook the importance of ongoing database configuration tuning. Configuration options are often being configured or tuned once, during the installation stage, and being left out until some unwanted events occur to the database service. Only then, one would put more attention to re-visit the configuration options and tune up the limits, thresholds, buffers, caches, etc, in the urge to restore the database service again.

Our focus in this blog post is to automate the database configuration check and validation process. This is an important process because configuration options are always changing across major versions. An unchanged config file could potentially have deprecated options that are no longer supported by the newer server version, which commonly causes some major issues to the upgraded server.

Configuration Management Tools

Puppet, Ansible, Chef and Saltstack are most commonly used by DevOps for configuration management and automation. Configuration management allows users to document the environment, improve efficiency, manageability and reproducibility, and an integral part of continuous integration and deployment. Most of the configuration management tools provide a catalog of modules and repositories for others to contribute, simplifying the learning curve for the community user to adapt to the technology.

Although configuration management tools are mostly used to automate deployment and installation, we can also perform configuration checks and enforcement in a centralized push-out approach. Each of these tools has its own way of templating a configuration file. As for Puppet, the template file commonly suffixed with ".erb" and inside it, we can define the configuration options together with pre-formulated values. 

The following example shows a template file for MySQL configuration:

[mysqld]
thread_concurrency = <%= processorcount.to_i * 2 %>
# Replication
log-bin            = /var/lib/mysql/mysql-bin.log
log-bin-index      = /var/lib/mysql/mysql-bin.index
binlog_format      = mixed
server-id         = <%= @mysql_server_id or 1 %>

# InnoDB
innodb_buffer_pool_size = <%= (memorysizeinbytes.to_i / 2 / 1024 / 1024).to_i -%>M
innodb_log_file_size    = <%= ((memorysizeinbytes.to_i / 2 / 1024 / 1024) * 0.25).to_i -%>M


As shown above, the configuration value can be a fixed value or dynamically calculated. Therefore, the end result can be different according to the target host's hardware specification with other predefined variables. In the Puppet definition file, we can push our configuration template like this:

# Apply our custom template
file { '/etc/mysql/conf.d/my-custom-config.cnf':
  ensure  => file,
  content => template('mysql/my-custom-config.cnf.erb')
}

Other than templating, we can also push the configuration values directly from the definition file. The following is an example of of Puppet definition for MariaDB 10.5 configuration using Puppet MySQL module:

# MariaDB configuration
class {'::mysql::server':
  package_name     => 'mariadb-server',
  service_name     => 'mariadb',
  root_password    => 't5[sb^D[+rt8bBYu',
  manage_config_file => true,
  override_options => {
    mysqld => {
      'bind_address' => '127.0.0.1',
      'max_connections' => '500',
      'log_error' => '/var/log/mysql/mariadb.log',
      'pid_file'  => '/var/run/mysqld/mysqld.pid',
    },
    mysqld_safe => {
      'log_error' => '/var/log/mysql/mariadb.log',
    },
  }
}

The above example shows that we used manage_config_file => true with override_options to structure our configuration lines which later will be pushed out by Puppet. Any modification to the manifest file will only reflect the content of the target MySQL configuration file. This module will neither load the configuration into runtime nor restart the MySQL service after pushing the changes into the configuration file. It's the SysAdmin's responsibility to restart the service to activate the changes.

For Puppet and Chef, check the output of the agent log to see if the configuration options are corrected. For Ansible, simply look at the debugging output to see if the congratulations are successfully updated. Using configuration management tools can help you automating configuration checks and enforce a centralized configuration approach.

MySQL Shell

A sanity check is important before performing any upgrade. MySQL Shell has a very cool feature that is intended to run a series of tests to verify if your existing installation is safe to upgrade to MySQL 8.0, called Upgrade Checker Utility. You can save a huge amount of time when preparing for an upgrade. A major upgrade, especially to MySQL 8.0, introduces and deprecates many configuration options and therefore has a big risk for incompatibility after the upgrade. 

This tool is specifically designed for MySQL (Percona Server included), especially when you want to perform a major upgrade from MySQL 5.7 to MySQL 8.0. To invoke this utility, connect with MySQL Shell, and as root user, specify the credentials, target version and the configuration file:

$ mysqlsh
mysql> util.checkForServerUpgrade('root@localhost:3306', {"password":"p4ssw0rd", "targetVersion":"8.0.11", "configPath":"/etc/my.cnf"})

At the bottom of the report, you will get the key summary:

Errors:   7
Warnings: 36
Notices:  0

7 errors were found. Please correct these issues before upgrading to avoid compatibility issues.

Focus on fixing up all the errors first, because this is going to be causing major problems after the upgrade if no action is taken. Take a look back at the generated report and find all issues with "Error:" wording inline, for example:

15) Removed system variables


Error: Following system variables that were detected as being used will be
    removed. Please update your system to not rely on them before the upgrade.
  More information: https://dev.mysql.com/doc/refman/8.0/en/added-deprecated-removed.html#optvars-removed


  log_builtin_as_identified_by_password - is set and will be removed
  show_compatibility_56 - is set and will be removed


Once all the errors are fixed, try to reduce the warnings whichever possible. The warnings mostly will not affect the reliability of the MySQL server, but can potentially degrade the performance or changed behavior than what they used to. For example, take a look at the following warnings:

13)

 System variables with new default values
  Warning: Following system variables that are not defined in your
    configuration file will have new default values. Please review if you rely on
    their current values and if so define them before performing upgrade.
  More information:
    https://mysqlserverteam.com/new-defaults-in-mysql-8-0/

  back_log - default value will change
  character_set_server - default value will change from latin1 to utf8mb4
  collation_server - default value will change from latin1_swedish_ci to
    utf8mb4_0900_ai_ci
  event_scheduler - default value will change from OFF to ON
  explicit_defaults_for_timestamp - default value will change from OFF to ON
  innodb_autoinc_lock_mode - default value will change from 1 (consecutive) to
    2 (interleaved)
  innodb_flush_method - default value will change from NULL to fsync (Unix),
    unbuffered (Windows)
  innodb_flush_neighbors - default value will change from 1 (enable) to 0
    (disable)
  innodb_max_dirty_pages_pct - default value will change from 75 (%)  90 (%)
  innodb_max_dirty_pages_pct_lwm - default value will change from_0 (%) to 10
    (%)
  innodb_undo_log_truncate - default value will change from OFF to ON
  innodb_undo_tablespaces - default value will change from 0 to 2
  log_error_verbosity - default value will change from 3 (Notes) to 2 (Warning)
  max_allowed_packet - default value will change from 4194304 (4MB) to 67108864
    (64MB)
  max_error_count - default value will change from 64 to 1024
  optimizer_trace_max_mem_size - default value will change from 16KB to 1MB
  performance_schema_consumer_events_transactions_current - default value will
    change from OFF to ON
  performance_schema_consumer_events_transactions_history - default value will
    change from OFF to ON
  slave_rows_search_algorithms - default value will change from 'INDEX_SCAN,
    TABLE_SCAN' to 'INDEX_SCAN, HASH_SCAN'
  table_open_cache - default value will change from 2000 to 4000
  transaction_write_set_extraction - default value will change from OFF to
    XXHASH64


Upgrade Checker Utility provides a critical overview of what to expect and averts us from a huge surprise after the upgrade. 

ClusterControl Advisors

ClusterControl has a number of internal mini-program called Advisors, where you write a small program that lives and runs within the structure of the ClusterControl objects. You can think of it as a scheduled function that executes a script created in Developer Studio and produces a result containing status, advice and justification. This allows users to easily extend the functionality of ClusterControl by creating custom advisors that can run on-demand or on a schedule.

The following screenshot shows an example of InnoDB Advisors called innodb_log_file_size check, after being activated and scheduled inside ClusterControl:

The above result can be found under ClusterControl -> Performance -> Advisors. For every Advisor, it shows the status of the advisor, database instance, justification and advice. There is also information about the schedule and the last execution time. The advisor can also be executed on-demand by clicking on the "Compile and Run" button under the Developer Studio.


The above advisors containing the following code, written using ClusterControl Domain-Specific Language (DSL) which is pretty similar to JavaScript:

#include "common/mysql_helper.js"
#include "cmon/graph.h"

var DESCRIPTION="This advisor calculates the InnoDB log growth per hour and"" compares it with the innodb_log_file_size configured on the host and"" notifies you if the InnoDB log growth is higher than what is configured, which is important to avoid IO spikes during flushing.";
var TITLE="Innodb_log_file_size check";
var MINUTES = 20;


function main()
{
    var hosts     = cluster::mySqlNodes();
    var advisorMap = {};
    for (idx = 0; idx < hosts.size(); ++idx)
    {
        host        = hosts[idx];
        map         = host.toMap();
        connected     = map["connected"];
        var advice = new CmonAdvice();
        print("");
        print(host);
        print("==========================");
        if (!connected)
        {
            print("Not connected");
            continue;
        }
        if (checkPrecond(host))
        {
            var configured_logfile_sz = host.sqlSystemVariable("innodb_log_file_size");
            var configured_logfile_grps = host.sqlSystemVariable("innodb_log_files_in_group");
            if (configured_logfile_sz.isError() || configured_logfile_grps.isError())
            {
                justification = "";
                msg = "Not enough data to calculate";
                advice.setTitle(TITLE);
                advice.setJustification("");
                advice.setAdvice(msg);
                advice.setHost(host);
                advice.setSeverity(Ok);
                advisorMap[idx]= advice;
                continue;
            }
            var endTime   = CmonDateTime::currentDateTime();
            var startTime = endTime - MINUTES * 60 /*seconds*/;
            var stats     = host.sqlStats(startTime, endTime);
            var array     = stats.toArray("created,interval,INNODB_LSN_CURRENT");

            if(array[2,0] === #N/A  || array[2,0] == "")
            {
                /* Not all vendors have INNODB_LSN_CURRENT*/
                advice.setTitle(TITLE);
                advice.setJustification("INNODB_LSN_CURRENT does not exists in"" this MySQL release.");
                advice.setAdvice("Nothing to do.");
                advice.setHost(host);
                advice.setSeverity(Ok);
                advisorMap[idx]= advice;
                continue;
            }
            var firstLSN = array[2,0].toULongLong();
            var latestLSN = array[2,array.columns()-1].toULongLong();
            var intervalSecs = endTime.toULongLong() - startTime.toULongLong();
            var logGrowthPerHourMB = ceiling((latestLSN - firstLSN) * 3600 / 1024/1024 / intervalSecs / configured_logfile_grps);
            var logConfiguredMB =  configured_logfile_sz/1024/1024;
            if (logGrowthPerHourMB > logConfiguredMB)
            {
                justification = "Innodb is producing " + logGrowthPerHourMB + "MB/hour, and it greater than"" the configured innodb log file size " + logConfiguredMB + "MB."" You should set innodb_log_file_size to a value greater than " +
                    logGrowthPerHourMB + "MB. To change"" it you must stop the MySQL Server and remove the existing ib_logfileX,"" and start the server again. Check the MySQL reference manual for max/min values. ""https://dev.mysql.com/doc/refman/5.6/en/innodb-parameters.html#sysvar_innodb_log_file_size";
                msg = "You are recommended to increase the innodb_log_file_size to avoid i/o spikes"" during flushing.";
                advice.setSeverity(Warning);
            }
            else
            {
                justification = "Innodb_log_file_size is set to " + logConfiguredMB +
                    "MB and is greater than the log produced per hour: " +
                    logGrowthPerHourMB + "MB.";
                msg = "Innodb_log_file_size is sized sufficiently.";
                advice.setSeverity(Ok);
            }
        }
        else
        {
            justification = "Server uptime and load is too low.";
            msg = "Not enough data to calculate";
            advice.setSeverity(0);
        }
        advice.setHost(host);
        advice.setTitle(TITLE);
        advice.setJustification(justification);
        advice.setAdvice(msg);
        advisorMap[idx]= advice;
        print(advice.toString("%E"));
    }
    return advisorMap;
}

ClusterControl provides an out-of-the-box integrated development environment (IDE) called Developer Studio (accessible under Manage -> Developer Studio) to write, compile, save, debug and schedule the Advisor:


With Developer Studio and Advisors, users have no limit in extending ClusterControl's monitoring and management functionalities. It is literally the perfect tool to automate the configuration check for all your open-source database software like MySQL, MariaDB, PostgreSQL and MongoDB, as well as the load balancers like HAProxy, ProxySQL, MaxScale and PgBouncer. You may even write an Advisor to make use of the MySQL Shell Upgrade Checker Utility, as shown in the previous chapter.

Final Thoughts

Configuration check and tuning are an important part of the DBA and SysAdmin routine to ensure a critical system like database and reverse proxies are always relevant and optimal as your workloads grow.

New User and LDAP Management in ClusterControl 1.8.2

$
0
0

After upgrading to ClusterControl 1.8.2, you should get the following notification banner:

What's up with that? It is a depreciation notice of the current user management system in favor of the new user management system handled by the ClusterControl controller service (cmon). When clicking on the banner, you will be redirected to the user creation page to create a new admin user, as described in this user guide.

In this blog post, we are going to look into the new user management system introduced in ClusterControl 1.8.2, and to see how it is different from the previous ones. Just for clarification, the old user management system will still work side-by-side with the new user authentication and management system until Q1 2022. From now on, all new installations for ClusterControl 1.8.2 and later will be configured with the new user management system.

User Management pre-1.8.2

ClusterControl 1.8.1 and older stores the user information and accounting inside a web UI database called "dcps". This database is independent of the cmon database that is used by the ClusterControl Controller service (cmon).

User Accounts and Authentication

A user account consists of the following information:

  • Name

  • Timezone

  • Email (used for authentication)

  • Password

  • Role

  • Team


One would use an email address to log in to the ClusterControl GUI, as shown in the following screenshot:

Once logged in, ClusterControl will look up for the organization the user belongs to and then assign the role-based access control (RBAC) to access a specific cluster and functionalities. A team can have zero or more clusters, while a user must belong to one or more teams. Creating a user requires a role and team created beforehand. ClusterControl comes with a default team called Admin, and 3 default roles - Super Admin, Admin and User.

Permission and Access Control

ClusterControl 1.8.1 and older used a UI-based access control based on role assignment. In another term, we called this role-based access control (RBAC). The administrator would create roles, and every role would be assigned a set of permissions to access certain features and pages. The role enforcement happens on the front-end side, where ClusterControl controller service (cmon) has no idea on whether the active user has the ability to access the functionality because the information is never been shared among these two authentication engines. This would make authentication and authorization more difficult to control in the future, especially when adding more features that compatible with both the GUI and CLI interfaces.

The following screenshot shows the available features that can be controlled via RBAC:

The administrator just needs to pick the relevant access level for specific features, and it will be stored inside the "dcps" database and then used by the ClusterControl GUI to permit UI resources to the GUI users. The access list created here has nothing to do with the CLI users.

LDAP

ClusterControl pre-1.8.1 used the PHP LDAP module for LDAP authentication. It supports Active Directory, OpenLDAP and FreeIPA directory services but only a limited number of LDAP attributes can be used for user identification such as uid, cn or sAMAccountName. The implementation is fairly straightforward and does not support advanced user/group base filtering, attributes mapping and TLS implementation.

The following are the information needed for LDAP settings:

Since this is a frontend service, the LDAP log file is stored under the web app directory, specifically at /var/www/html/clustercontrol/app/log/cc-ldap.log. An authenticated user will be mapped to a particular ClusterControl role and team, as defined in the LDAP group mapping page.

User Management post-1.8.2

In this new version, ClusterControl supports both authentication handlers, the frontend authentication (using email address) and backend authentication (using username). For the backend authentication, ClusterControl stores the user information and accounting inside the cmon database that is used by the ClusterControl Controller service (cmon).

User Accounts and Authentication

A user account consists of the following information:

  • Username (used for authentication)

  • Email address

  • Full name

  • Tags

  • Origin

  • Disabled

  • Suspend

  • Groups

  • Owner

  • ACL

  • Failed logins

  • CDT path

If compared to the old implementation, the new user management has more information for a user, which allows complex user account manipulation and better access control with enhanced security. A user authentication process is now protected against brute-force attacks and can be deactivated for maintenance or security reasons. 

One would use an email address or username to log in to the ClusterControl GUI, as shown in the following screenshot (pay attention to the placeholder text for Username field):

If the user logs in using an email address, the user will be authenticated via the deprecating frontend user management service and if a username is supplied, ClusterControl will automatically use the new backend user management service handled by the controller service. Both authentications work with two different sets of user management interfaces.

Permission and Access Control

In the new user management, permissions and access controls are controlled by a set of Access Control List (ACL) text forms called read (r), write (w), and execute (x). All ClusterControl objects and functionalities are structured as part of a directory tree, we called this CMON Directory Tree (CDT) and each entry is owned by a user, a group, and an ACL. You can think of it as similar to Linux file and directory permissions. In fact, ClusterControl access control implementation follows the standard POSIX Access Control Lists.

To put into an example, consider the following commands. We retrieved the Cmon Directory Tree (CDT) value for our cluster by using "s9s tree" command line (imagine this as ls -al in UNIX). In this example, our cluster name is “PostgreSQL 12”, as shown below (indicated by the "c" at beginning of the line):

$ s9s tree --list --long
MODE        SIZE OWNER                      GROUP  NAME
crwxrwx---+    - system                     admins PostgreSQL 12
srwxrwxrwx     - system                     admins localhost
drwxrwxr--  1, 0 system                     admins groups
urwxr--r--     - admin                      admins admin
urwxr--r--     - dba                        admins dba
urwxr--r--     - nobody                     admins nobody
urwxr--r--     - readeruser                 admins readeruser
urwxr--r--     - s9s-error-reporter-vagrant admins s9s-error-reporter-vagrant
urwxr--r--     - system                     admins system
Total: 22 object(s) in 4 folder(s).

Suppose we have a read-only user called readeruser, and this user belongs to a group called readergroup. To assign read permission for readeruser and readergroup, and our CDT path is “/PostgreSQL 12” (always start with a “/”, similar to UNIX), we would run:

$ s9s tree --add-acl --acl="group:readergroup:r--""/PostgreSQL 12"
Acl is added.
$ s9s tree --add-acl --acl="user:readeruser:r--""/PostgreSQL 12"
Acl is added.

Now the readeruser can access the ClusterControl via GUI and CLI as a read-only user for a database cluster called "PostgreSQL 12". Note that the above ACL manipulation examples were taken from the ClusterControl CLI, as described in this article. If you connect through ClusterControl GUI, you would see the following new access control page:

ClusterControl GUI provides a more simple way of handling the access control. It provides a guided approach to configure the permissions, ownership and groupings. Similar to the older version, every cluster is owned by a team, and you can specify a different team to have a read, admin, or forbid another team from accessing the cluster from both ClusterControl GUI or CLI interfaces.

LDAP

In the previous versions (1.8.1 and older), LDAP authentication was handled by the frontend component through a set of tables (dcps.ldap_settings and dcps.ldap_group_roles). Starting from ClusterControl 1.8.2, all LDAP configurations and mappings will be stored inside this configuration file, /etc/cmon-ldap.cnf. 

It is recommended to configure LDAP setting and group mappings via the ClusterControl UI because any changes to this file will require a reload to the controller process, which is triggered automatically when configuring LDAP via the UI. You may also make direct modifications to the file, however, you have to reload the cmon service manually by using the following commands:

$ systemctl restart cmon # or service cmon restart

The following screenshot shows the new LDAP Advanced Settings dialog:

If compared to the previous version, the new LDAP implementation is more customizable to support industry-standard directory services like Active Directory, OpenLDAP and FreeIPA. It also supports attribute mappings so you can set which attribute represents a value that can be imported into the ClusterControl user database like email, real name and username.

For more information, check out the LDAP Settings user guide.

Advantages of the New User Management

Note that the current user management is still working side-by-side with the new user management system. However, we highly recommend our users to migrate to the new system before Q1 2022. Only manual migration is supported at the moment. See Migration to the New User Management section below for details.

The new user management system will benefit ClusterControl users in the following ways:

  • Centralized user management for ClusterControl CLI and ClusterControl GUI. All authentication, authorization, and accounting will be handled by the ClusterControl Controller service (cmon).

  • Advanced and customizable LDAP configuration. The previous implementation only supports a number of username attributes and had to be configured in its own way to make it work properly.

  • The same user account can be used to authenticate to the ClusterControl API securely via TLS. Check out this article for example.

  • Secure user authentication methods. The new native user management supports user authentication using both private/public keys and passwords. For LDAP authentication, the LDAP bindings and lookups are supported via SSL and TLS.

  • A consistent view of time representation based on the user's timezone setting, especially when using both CLI and GUI interface for database cluster management and monitoring.

  • Protection against brute force attacks, where a user can be denied access to the system via suspension or disabled logins.

Migration to the New User Management

Since both user systems have different user account and structure, it is a very risky operation to automate the user migration from frontend to backend. Therefore, the user must perform the account migration manually after upgrading from 1.8.1 and older. Please refer to Enabling New User Management for details. For existing LDAP users, please refer to the LDAP Migration Procedure section.

We highly recommend users to migrate to this new system for the following reasons:

  • The UI user management system (where a user would log in using an email address) will be deprecated by the end of Q1 2022 (~1 year from now).

  • All upcoming features and improvements will be based on the new user management system, handled by the cmon backend process.

  • It is counter-intuitive to have two or more authentication handlers running on a single system.

If you are facing problems and required assistance on the migration and implementation of the new ClusterControl user management system, do not hesitate to reach us out via the support portal, community forum or Slack channel.

Final Thoughts

ClusterControl is evolving into a more sophisticated product over time. To support the growth, we have to introduce new major changes for a richer experience in a long run. Do expect more features and improvements to the new user management system in the upcoming versions!

Best Practices in Scaling Databases: Part 1

$
0
0

All of you have heard about scaling - your architecture should be scalable, you should be able to scale up to meet the demand, so on and so forth. What does it mean when we talk about databases? How does the scaling look like behind the scenes? This topic is vast and there is no way to cover all of the aspects. This two-blog post series is an attempt to give you an insight into the topic of database scalability.

Why do we Scale?

First, let’s take a look at what scalability is about. In short, we are talking about the ability to handle higher load by your database systems. It can be a matter of dealing with short-lived spikes in the activity, it can be a matter of dealing with a gradually increased workload in your database environment. There can be numerous reasons to consider scaling. Most of them come with their own challenges. We can spend some time going through examples of the situation where we may want to scale out.

Resource consumption Increase

This is the most generic one - your load has increased to the point where your existing resources are no longer capable to deal with it. It can be anything. CPU load has increased and your database cluster is no longer able to deliver data with reasonable and stable query execution time. Memory utilization has grown to an extent that the database is no longer CPU-bound but became I/O-bound and, as such, performance of the database nodes has been significantly reduced. Network can as well be a bootle-neck. You may be surprised to see what limits related to networking have your cloud instances assigned. In fact, this may become the most common limit you have to deal with as the network is everything in the cloud - not just the data sent between the application and the database but also storage is attached over the network. It can also be disk usage - you are just running out of disk space or, more likely, given we can have quite large disks nowadays, the database size outgrew the “manageable” size. Maintenance like schema change becomes a challenge, performance is reduced due to data size, backups are taking ages to complete. All those cases may be a valid case for a need for scale up.

Sudden increase in the workload

Another example case where scaling is required is a sudden increase in the workload. For some reason (be it marketing efforts, content going viral, emergency or similar situation) your infrastructure experiences a significant increase in the load on the database cluster. CPU load goes over the roof, disk I/O is slowing down the queries etc. Pretty much every resource that we mentioned in the previous section can be overloaded and start causing issues.

Planned operation

Third reason we’d like to highlight is the more generic one - some sort of a planned operation. It can be a planned marketing activity that you expect to bring in more traffic, Black Friday, load testing or pretty much anything that you know in advance. 

Each of those reasons has its own characteristics. If you can plan in advance, you can prepare the process in detail, test it and execute it whenever you feel like it. You will most likely like to do it in a “low traffic” period, as long as something like that exists in your workloads (it doesn’t have to exist). On the other hand, sudden spikes in the load, especially if they are significant enough to impact the production, will force immediate reaction, no matter how prepared you are and how safe it is - if your services are already impacted you may as well just go for it instead of waiting.

Types of Database Scaling

There are two main types of scaling: vertical and horizontal. Both have pros and cons, both are useful in different situations. Let’s take a look at them and discuss use cases for both scenarios.

Vertical scaling

This scaling method is probably the oldest one: if your hardware is not beefy enough to deal with the workload, beef it up. We are talking here simply about adding resources to existing nodes with an intent to make them capable enough to deal with the tasks given. This has some repercussions we’d like to go over.

Advantages of vertical scaling

The most important bit is that everything stays the same. You had three nodes in a database cluster, you still have three nodes, just more capable. There is no need to redesign your environment, change how the application should access the database - everything stays precisely the same because, configuration-wise, nothing has really changed.

Another significant advantage of vertical scaling is that it can be very fast, especially in cloud environments. The whole process is, pretty much, to stop the existing node, make the change in the hardware, start the node again. For classic, on-prem setups, without any virtualization, this might be tricky - you may not have faster CPU’s available to swap, upgrading disks to larger or faster may also be time consuming, but for cloud environments, be it public or private, this can be as easy as running three commands: stop instance, upgrade instance to larger size, start instance. Virtual IP’s and re-attachable volumes make it easy to move data around between instances.

Disadvantages of vertical scaling

The main disadvantage of vertical scaling is that, simply, it has its limits. If you are running on the largest instance size available, with the fastest disk volumes,  there’s not much else you can do. It is also not that easy to increase the performance of your database cluster significantly. It mostly depends on the initial instance size, but if you are already running quite performant nodes, you may not be able to achieve 10x scale-out using vertical scaling. Nodes that would be 10x faster may, simply, not exist.

Horizontal scaling

Horizontal scaling is a different beast. Instead of going up with the instance size, we stay at the same level but we expand horizontally by adding more nodes. Again, there are pros and cons of this method.

Pros of horizontal scaling

The main advantage of horizontal scaling is that, theoretically, sky's the limit. There is no artificial hard limit of scale-out, even though limits do exist, mainly due to intra-cluster communication being bigger and bigger overhead with every new node added to the cluster.

Another significant advantage would be that you can scale up the cluster without a need for downtime. If you want to upgrade hardware, you have to stop the instance, upgrade it and then start again. If you want to add more nodes to the cluster, all you need to do is to provision those nodes, install whatever software you need, including the database, and let it join the cluster. Optionally (depending if the cluster has internal methods to provision new nodes with the data) you may have to provision it with data on your own. Typically, though, it is an automated process.

Cons of horizontal scaling

The main problem that you have to deal with is that adding more and more nodes makes it hard to manage the whole environment. You have to be able to tell which nodes are available, such a list has to be maintained and updated with every new node created. You may need external solutions like directory service (Consul or Etcd) to keep the track of the nodes and their state. This, obviously, increases the complexity of the whole environment.

Another potential issue is that the scale-out process takes time. Adding new nodes and provisioning them with software and, especially, data requires time. How much, it depends on the hardware (mainly I/O and network throughput) and the size of the data. For large setups this may be a significant amount of time and this may be a blocker for situations where the scale-up has to happen immediately. Waiting hours to add new nodes may not be acceptable if the database cluster is impacted to the extent that operations are not being performed properly.

Scaling Prerequisites

Data replication

Before any attempt for scaling can be made, your environment must meet a couple of requirements. For starters, your application has to be able to take advantage of more than one node. If it can use just one node, your options are pretty much limited to vertical scaling. You can increase the size of such node or add some hardware resources to the bare metal server and make it more performant but that’s the best you can do: you will always be limited by the availability of more performant hardware and, eventually, you will find yourself without an option to further scale up.

On the other hand, if you have the means to utilize multiple database nodes by your application, you can benefit from horizontal scaling. Let’s stop here and discuss what is that you need to actually use multiple nodes to their full potential.

For starters, the ability to split reads from writes. Traditionally the application connects to just one node. That node is used to handle all writes and all reads executed by the application.

Adding a second node to the cluster, from the scaling standpoint, changes nothing. You have to keep in mind that, should one node fail, the other will have to handle the traffic, so at no point the sum of load across both nodes should be too high for one single node to deal with.

With three nodes available you can fully utilize two nodes. This allows us to scale out some of the read traffic: if one node has 100% capacity (and we would rather run at most at 70%), then two nodes represent 200%. Three nodes: 300%. If one node is down and if we’ll push remaining nodes almost to the limit, we can say that we are able to work with 170 - 180% of a single node capacity if the cluster is degraded. That gives us a nice 60% load on every node if all three nodes are available.

Please keep in mind that we are talking only about scaling reads at this moment. At no point in time replication can improve your write capacity. In asynchronous replication, you have only one writer (master), and for the synchronous replication, like Galera, where the dataset is shared across all nodes, every write that is happening on one node will have to be performed on the remaining nodes of the cluster. 

In a three node Galera cluster, if you write one row, you in fact write three rows, one for every node. Adding more nodes or replicas won’t make a difference. Instead of writing the same row on three nodes you’ll write it on five. This is why splitting your writes in a multi-master cluster, where the data set is shared across all nodes (there are multi-master clusters where data is sharded, for example MySQL NDB Cluster - here the write scalability story is totally different), doesn’t make too much sense. It adds overhead of dealing with potential write conflicts across all nodes while it is not really changing anything regarding the total write capacity.

Loadbalancing and read/write split

The ability to split reads from writes is a must if you want to scale your reads in asynchronous replication setups. You have to be able to send write traffic to one node and then send the reads to all nodes in the replication topology. As we mentioned earlier, this functionality is also quite useful in the multi-master clusters as it allows us to remove the write conflicts that may happen if you attempt to distribute the writes across multiple nodes in the cluster. How can we perform the read/write split? There are several methods you can use to do it. Let’s dig into this topic for a bit.

Application level R/W split

The most simple scenario, the least frequent as well: your application is able to be configured which nodes should receive writes and which nodes should receive reads. This functionality can be configured in a couple of ways, most simple being the hardcoded list of the nodes but it also could be something along the lines of dynamic node inventory updated by background threads. The main problem with this approach is that the whole logic has to be written as a part of the application. With a hardcoded list of nodes, the simplest scenario would require changes to the application code for every change in the replication topology. On the other hand, more advanced solutions like implementing a service discovery would be more complex to maintain in the long run.

R/W split in connector

Another option would be to use a connector to perform a read/write split. Not all of them have this option, but some do. An example would be php-mysqlnd or Connector/J. How it is integrated into the application, it may differ based on the connector itself. In some cases configuration has to be done in the application, in some cases it has to be done in a separate configuration file for the connector. The advantage of this approach is that even if you have to extend your application, most of the new code is ready to use and maintained by external sources. It makes it easier to deal with such setup and you have to write less code (if any).

R/W split in loadbalancer

Finally, one of the best solutions: loadbalancers. The idea is simple - pass your data through a loadbalancer that will be able to distinguish between reads and writes and send them to a proper location. This is a great improvement from the usability standpoint as we can separate database discovery and query routing from the application. The only thing the application has to do is send the database traffic to a single endpoint that consists of a hostname and a port. The rest happens in the background. Loadbalancers are working to route the queries to a backend database nodes. Loadbalancers can also do replication topology discovery or you can implement a proper service inventory using etcd or consul and update it through your infrastructure orchestration tools like Ansible.

This concludes the first part of this blog. In the second one we will discuss the challenges we are facing when scaling the database tier. We will also discuss some ways in which we can scale out our database clusters.

How to Manage Large Databases Effectively

$
0
0

One of the biggest concerns when dealing with and managing databases is its data and size complexity. Often, organizations get concerned about how to deal with growth and manage growth impact because the database management fails off. Complexity comes with concerns that were not addressed initially and were not seen, or could be overlooked because the technology being currently used shall be able to handle by itself. Managing a complex and large database has to be planned accordingly especially when the type of data you are managing or handling is expected to grow massively either anticipated or in an unpredictable manner. The main goal of planning is to avoid unwanted disasters, or shall we say keep out of going up in smokes! In this blog we will cover how to efficiently manage large databases. 

Data Size does Matter

The size of the database matters as it has an impact on performance and its management methodology. How the data is processed and stored will contribute to how the database will be managed, which applies to both in transit and at rest data. For many large organisations, data is gold, and growth in data could have a drastic change in the process. Therefore, it’s vital to have prior plans to handle growing data in a database.

In my experience working with databases, I've witnessed customers having issues dealing with performance penalties and managing extreme data growth. Questions arise whether to normalize the tables vs denormalizing the tables. 

Normalizing Tables

Normalizing tables maintains data integrity, reduces redundancy, and makes it easy to organize the data into a more efficient way to manage, analyze, and extract. Working with normalized tables yields efficiency, especially when analyzing the data flow and retrieving data either by SQL statements or working with programming languages such as C/C++, Java, Go, Ruby, PHP,  or Python interfaces with the MySQL Connectors. 

Although concerns with normalized tables possess performance penalty and can slow the queries due to series of joins when retrieving the data. Whereas denormalized tables, all you have to consider for optimization relies on the index or the primary key to store data into the buffer for quicker retrieval than performing multiple disks seeks. Denormalized tables require no joins, but it sacrifices data integrity, and database size tends to get bigger and bigger.

When your database is large consider having a DDL (Data Definition Language) for your database table in MySQL/MariaDB. Adding a primary or unique key for your table requires a table rebuild. Changing a column data type also requires a table rebuild as the algorithm applicable to be applied is only ALGORITHM=COPY. 

If you're doing this in your production environment, it can be challenging. Double the challenge if your table is huge. Imagine a million or a billion numbers of rows. You cannot apply an ALTER TABLE statement directly to your table. That can block all incoming traffic that shall need to access the table currently you are applying the DDL. However, this can be mitigated by using pt-online-schema-change or the great gh-ost. Nevertheless, it requires monitoring and maintenance while doing the process of DDL.

Sharding and Partitioning

With sharding and partitioning, it helps segregate or segment the data according to their logical identity. For example, by segregating based on date, alphabetical order, country, state, or primary key based on the given range. This helps your database size to be manageable. Keep your database size up to its limit that it's manageable to your organization and your team. Easy to scale if necessary or easy to manage, especially when a disaster occurs.

When we say manageable, also consider the capacity resources of your server and also your engineering team. You cannot work with large and big data with few engineers. Working with big data such as 1000 databases with large numbers of data sets requires a huge demand of time. Skill wise and expertise is a must. If cost is an issue, that's the time that you can leverage third party services that offer managed services or paid consultation or support for any such engineering work to be catered.

Character Sets and Collation

Character sets and collations affect data storage and performance, especially on the given character set and collations selected. Each character set and collations has its purpose and mostly requires different lengths. If you have tables requiring other characters sets and collations due to character encoding, the data to be stored and processed for your database and tables or even with columns.

This affects how to manage your database effectively. It impacts your data storage and as well performance as stated earlier. If you have understood the kinds of characters to be processed by your application, take note of the character set and collations to be used. LATIN types of characters sets shall suffice mostly for the alphanumeric type of characters to be stored and processed. 

If it's inevitable, sharding and partitioning helps to at least mitigate and limit the data to avoid bloating too much data in your database server. Managing very large data on a single database server can affect efficiency, especially for backup purposes, disaster and recovery, or data recovery as well in case of data corruption or data lost.

Database Complexity Affects Performance 

A large and complex database tends to have a factor when it comes to performance penalty. Complex, in this case, means that the content of your database consists of mathematical equations, coordinates, or numerical and financial records. Now mixed these records with queries that are aggressively using the mathematical functions native to its database. Take a look at the example SQL (MySQL/MariaDB compatible) query below,

SELECT
    ATAN2( PI(),
		SQRT( 
			pow(`a`.`col1`-`a`.`col2`,`a`.`powcol`) + 
			pow(`b`.`col1`-`b`.`col2`,`b`.`powcol`) + 
			pow(`c`.`col1`-`c`.`col2`,`c`.`powcol`) 
		)
	) a,
    ATAN2( PI(),
		SQRT( 
			pow(`b`.`col1`-`b`.`col2`,`b`.`powcol`) - 
			pow(`c`.`col1`-`c`.`col2`,`c`.`powcol`) - 
			pow(`a`.`col1`-`a`.`col2`,`a`.`powcol`) 
		)
	) b,
    ATAN2( PI(),
		SQRT( 
			pow(`c`.`col1`-`c`.`col2`,`c`.`powcol`) * 
			pow(`b`.`col1`-`b`.`col2`,`b`.`powcol`) / 
			pow(`a`.`col1`-`a`.`col2`,`a`.`powcol`) 
		)
	) c
FROM
    a
LEFT JOIN `a`.`pk`=`b`.`pk`
LEFT JOIN `a`.`pk`=`c`.`pk`
WHERE
    ((`a`.`col1` * `c`.`col1` + `a`.`col1` * `b`.`col1`)/ (`a`.`col2`)) 
    between 0 and 100
AND
    SQRT(((
		(0 + (
			(((`a`.`col3` * `a`.`col4` + `b`.`col3` *  `b`.`col4` + `c`.`col3` + `c`.`col4`)-(PI()))/(`a`.`col2`)) * 
			`b`.`col2`)) -
		`c`.`col2) * 
		((0 + (
			((( `a`.`col5`* `b`.`col3`+ `b`.`col4` * `b`.`col5` + `c`.`col2` `c`.`col3`)-(0))/( `c`.`col5`)) * 
			 `b`.`col3`)) - 
		`a`.`col5`)) +
		((
			(0 + (((( `a`.`col5`* `b`.`col3` + `b`.`col5` * PI() + `c`.`col2` / `c`.`col3`)-(0))/( `c`.`col5`)) * `b`.`col5`)) - 
			`b`.`col5` ) * 
			((0 + (((( `a`.`col5`* `b`.`col3` + `b`.`col5` * `c`.`col2` + `b`.`col2`  / `c`.`col3`)-(0))/( `c`.`col5`)) * -20.90625)) - `b`.`col5`)) +
		(((0 + (((( `a`.`col5`* `b`.`col3` + `b`.`col5` * `b`.`col2` +`a`.`col2`  / `c`.`col3`)-(0))/( `c`.`col5`)) *  `c`.`col3`)) - `b`.`col5`) * 
		((0 + (((( `a`.`col5`* `b`.`col3` + `b`.`col5` * `b`.`col2`5 + `c`.`col3`  / `c`.`col2`)-(0))/( `c`.`col5`)) *  `c`.`col3`)) - `b`.`col5`
	))) <=600
ORDER BY
    ATAN2( PI(),
		SQRT( 
			pow(`a`.`col1`-`a`.`col2`,`a`.`powcol`) + 
			pow(`b`.`col1`-`b`.`col2`,`b`.`powcol`) + 
			pow(`c`.`col1`-`c`.`col2`,`c`.`powcol`) 
		)
	) DESC
 

Consider that this query is applied on a table ranging from a million rows. There is a huge possibility that this can stall the server, and it could be resource intensive causing danger to the stability of your production database cluster. Involved columns tend to be indexed to optimise and make this query performant. However, adding indexes to the referenced columns for optimal performance doesn't guarantee the efficiency of managing your large databases. 

When handling complexity, the more efficient way is to avoid rigorous usage of complex mathematical equations and aggressive usage of this built-in complex computational capability. This can be operated and transported through complex computations using backend programming languages instead of using the database. If you have complex computations, then why not store these equations in the database, retrieve the queries, organize it into a more easy to analyze or debug when needed. 

Are You Using the Right Database Engine?

A data structure affects the performance of the database server based on the combination of the query given and the records that are read or retrieved from the table. The database engines within MySQL/MariaDB support InnoDB and MyISAM which use B-Trees, while NDB or Memory database engines use Hash Mapping. These data structures have its asymptotic notation which the latter express the performance of the algorithms used by these data structures. We call these in Computer Science as Big O notation which describes the performance or complexity of an algorithm. Given that InnoDB and MyISAM use B-Trees, it uses O(log n) for search. Whereas, Hash Tables or Hash Maps uses O(n). Both share the average and worst case for its performance with its notation. 

Now back on the specific engine, given the data structure of the engine, the query to be applied based on the target data to be retrieved of course affects the performance of your database server. Hash tables cannot do range retrieval, whereas B-Trees is very efficient for doing these types of searches and also it can handle large amounts of data. 

Using the right engine for the data you store, you need to identify what type of query you apply for these specific data you store. What type of logic that these data shall formulate when it transforms into a business logic. 

Dealing with 1000's or thousands of databases, using the right engine in combination of your queries and data that you want to retrieve and store shall deliver good performance. Given that you have predetermined and analyzed your requirements for its purpose for the right database environment.

Right Tools to Manage Large Databases

It is very hard and difficult to manage a very large database without a solid platform that you can rely upon. Even with good and skilled database engineers, technically the database server you are using is prone for human error. One mistake of any changes to your configuration parameters and variables might result in a drastic change causing to degrade the server's performance.

Performing backup to your database on a very large database could be challenging at times. There are occurrences that backup might fail for some strange reasons. Commonly, queries that could stall the server where the backup is running cause to fail. Otherwise, you have to investigate the cause of it.

Using automation such as Chef, Puppet, Ansible, Terraform, or SaltStack can be used as your IaC to provide quicker tasks to perform. While using other third-party tools as well to help you from monitoring and providing high quality graph images. Alert and alarm notification systems are also very important to notify you from issues that can occur from warning to critical status level. This is where ClusterControl is very useful in this kind of situation.

ClusterControl offers ease to manage a large number of databases or even with sharded types of environments. It has been tested and installed a thousand times and has been running into productions providing alarms and notifications to the DBAs, engineers, or DevOps operating the database environment. Ranging from staging or development, QAs, to production environment.

ClusterControl also can perform a backup and restore. Even with large databases, it can be efficient and easy to manage since the UI provides scheduling and also has options to upload it to the cloud (AWS, Google Cloud, and Azure). 

There's also a backup verification and a lot of options such as encryption and compression. See the screenshot below for example (creating a Backup for MySQL using Xtrabackup):

Conclusion

Managing large databases such as a thousand or more can be efficiently done, but it must be determined and prepared beforehand. Using the right tools such as automation or even subscribing to managed services helps drastically. Although it incurs cost, the turnaround of the service and budget to be poured to acquire skilled engineers can be reduced as long as the right tools are available.


Live Webinar: Tips to Drive MariaDB Galera Cluster Performance for Nextcloud

$
0
0

Join us for this webinar on Tips to Drive MariaDB Galera Cluster Performance for Nextcloud. The webinar features Björn Schiessle, Co-Founder and Pre-sales lead at Nextcloud, and Ashraf Sharif, senior support engineer at Severalnines. They will give you a deep dive into designing and optimising MariaDB Galera Cluster for Nextcloud and sharing tips on improving performance and stability significantly.

Nextcloud: Regain Control Over Your Data

Nextcloud is an on-premises collaboration platform. It uniquely combines the convenience and ease of use of consumer-grade SaaS platforms with the security, privacy and control large organizations needs.

Users gain access to their documents and can share them with others within and outside their organization with an easy to use web interface or clients for all popular platforms. Nextcloud also features extensive collaboration capabilities including Calendar, Contact, Mail, Online Office, private audio/video conferencing and a variety of planning and coordination tools as part of an extensive ecosystem of hundreds of apps.

Nextcloud deeply integrates in existing infrastructure like user directories and storage and provides strong access control capabilities to ensure business policies are enforced. First class security backed by a USD 10.000 security bug bounty program provides the confidence that data meant to stay private will stay private.

Nextcloud is a fully open source platform, with hundreds of thousands of servers deployed on the web by both individual techies and large corporations. At scale, database performance is key for a good user experience and large deployments in government, for telecom providers, research universities or big enterprises work closely with Nextcloud and its partners like Severalnines to get the most out of their hardware.

About the webinar

Nextcloud uses its database to store a wide of range of data, from file meta data to calendar files and chat logs. A poorly performing database can have a serious impact on performance and availability of Nextcloud. MariaDB Cluster is the recommended database backend for production installations that require high availability and performance.

This talk is a deep dive into how to design and optimize MariaDB Galera Cluster for Nextcloud. We will cover 5 tips on how to significantly improve performance and stability.

Agenda:

  • Overview of Nextcloud architecture

  • Database architecture design

  • Database proxy

  • MariaDB and InnoDB performance tuning

  • Nextcloud performance tuning

  • Q&A

Learn more and sign up now!

Best Practices in Scaling Databases: Part Two

$
0
0

In the previous blog post, we have covered the basics of scaling - what it is, what are the types, what is a must-have if we want to scale. This blog post will focus on the challenges and the ways in which we can scale out.

Challenging of Scaling Out

Scaling databases is not the easiest task for multiple reasons. Let’s focus a little bit on the challenges related to scaling out your database infrastructure.

Stateful service

We can distinguish two different types of services: stateless and stateful. Stateless services are the ones, which does not rely on any kind of existing data. You can just go ahead, start such a service and it will happily just work. You do not have to worry about the state of the data nor the service. If it is up, it will work properly and you can easily spread the traffic across multiple service instances just by adding more clones or copies of existing VM’s, containers or similar. An example of such a service can be a web application - deployed from the repo, having a properly configured web server, such service will just start and work properly.

The problem with databases is that the database is everything but stateless. Data has to be inserted into the database, it has to be processed and persisted. The image of the database is nothing more than just a couple of packages installed over the OS image and, without data and proper configuration, it is rather useless. This adds to the complexity of the database scaling. For stateless services it is just to deploy them and configure some loadbalancers to include new instances in the workload. For databases deploying the database, the instance is just the starting point. Further down the lane is data management - you have to transfer the data from your existing database instance into the new one. This can be a significant part of the problem and time needed for the new instances to start handling the traffic. Only after the data has been transferred we can set up the new nodes to become a part of the existing replication topology - the data has to be updated on them in the real time, based on the traffic that is reaching out to other nodes.

Time required to scale up

The fact that databases are stateful services is a direct reason for the second challenge that we face when we want to scale out the database infrastructure. Stateless services - you just start them and that’s it. It is quite a quick process. For databases, you have to transfer the data. How long will it take, it depends on multiple factors. How large is the data set? How fast is the storage? How fast is the network? What are the other steps required to provision the new node with the fresh data? Is data compressed/decompressed or encrypted/decrypted in the process? In the real world, it may take from minutes to multiple hours to provision the data on a new node. This seriously limits the cases where you can scale up your database environment. Sudden, temporary spikes of load? Not really, they may be long gone before you’ll be able to start additional database nodes. Sudden and consistent load increase? Yes, it will be possible to deal with it by adding more nodes but it may take even hours to bring them up and let them take over the traffic from existing database nodes.

Additional load caused by the scale up process

It is very important to keep in mind that the time required to scale up is just one side of the problem. The other side is the load caused by the scaling process. As we mentioned earlier, you have to transfer the whole data set to newly added nodes. This is not something that you can ignore, after all, it may be an hours long process of reading the data from disk, sending it over the network and storing it in a new location. If the donor, the node where you read the data from, is overloaded, you need to consider how it will behave if it will be forced to perform additional heavy I/O activity? Will your cluster be able to take on an additional workload if it is already under heavy pressure and spreaded thin? The answer might not be easy to get as the load on the nodes may come in different forms. CPU-bound load will be the best case scenario as the I/O activity should be low and additional disk operations will be manageable. I/O-bound load, on the other hand, can slow down the data transfer significantly, seriously impacting cluster’s ability to scale.

Write scaling

The scale out process that we mentioned earlier is pretty much limited to scaling reads. It is paramount to understand that scaling writes is a completely different story. You can scale reads by simply adding more nodes and spreading the reads across more backend nodes. Writes are not that easy to scale. For starters, you cannot scale out writes just like that. Every node that contains the whole data set is, obviously, required to handle all writes performed somewhere in the cluster because only by applying all modifications to the data set it can maintain consistency. So, when you think of it, no matter how you design your cluster and what technology you use, every member of the cluster has to execute every write. Whether it is a replica, replicating all writes from its master or node in a multi-master cluster like Galera or InnoDB Cluster executing all changes to the data set performed on all other nodes of the cluster, the outcome is the same. Writes do not scale out simply by adding more nodes to the cluster.

How can we Scale Out the Database?

So, we know what kind of challenges we are facing. What are the options that we have? How can we scale out the database?

By adding replicas

First and foremost, we will scale out simply by adding more nodes. Sure, it will take time and sure, it is not a process you can expect to happen immediately. Sure, you won’t be able to scale out writes like that. On the other hand, the most typical problem you will be facing is the CPU load caused by SELECT queries and, as we discussed, reads can simply be scaled by just adding more nodes to the cluster. More nodes to read from means the load on each one of them will be reduced. When you are at the beginning of your journey into the life cycle of your application, just assume that this is what you will be dealing with. CPU load, not efficient queries. It is very unlikely that you would need to scale out writes until way further in the life cycle, when your application has already matured and you have to deal with the number of customers.

By sharding

Adding nodes won’t solve the write issue, that’s what we established. What you have to do instead is sharding - splitting the data set across the cluster. In this case each node contains just a part of the data, not everything. This allows us to finally start scaling writes. Let’s say we have four nodes, each containing half of the data set.

As you can see, the idea is simple. If the write is related to part 1 of the data set, it will be executed on node1 and node3. If it is related to part 2 of the data set, it will be executed on node2 and node4. You can think of the database nodes as disks in a RAID. Here we have an example of RAID10, two pairs of mirrors, for redundancy. In real implementation it may be more complex, you may have more than one replica of the data for improved high availability. The gist is, assuming a perfectly fair split of the data, half of the writes will hit node1 and node3 and the other half nodes 2 and 4. If you want to split the load even further, you can introduce the third pair of nodes:

In this case, again, assuming a perfectly fair split, each pair will be responsible for 33% of all writes to the cluster.

This pretty much sums up the idea of sharding. In our example, by adding more shards, we can reduce the write activity on the database nodes to 33% of the original I/O load. As you may imagine, this does not come without drawbacks.

 How am I going to find on which shard my data is located? Details are out of the scope of this call but in short, you can either implement some sort of a function on a given column (modulo or hash on the ‘id’ column) or you can build a separate metadatabase where you will store the details of how the data is distributed.

We hope that you found this short blog series informative and that you got a better understanding of the different challenges we face when we want to scale out the database environment. If you have any comments or suggestions on this topic, please feel free to comment below this post and share your experience


Integrating ClusterControl with SNMP - A Proof of Concept : Part One

$
0
0

ClusterControl comes with a number of distinctive alerts (or alarms) which you won't find in other monitoring systems. ClusterControl understands a database cluster topology as a whole - all database nodes and the relation between them, including the dependent nodes or clusters like slave cluster, reverse-proxy and arbitrator nodes. For example, ClusterControl is able to detect and report a partitioned cluster, time drift between all nodes in the cluster, cluster recovery failure, cluster-to-cluster replication failure and many more cluster-wide specific alarms. Hence, it would be great if we could integrate ClusterControl alarms with any existing SNMP-based monitoring or paging system. 

In this blog series, we are going to showcase a proof of concept on how to integrate ClusterControl with SNMP protocol. At the end of the blog series, we would ultimately be able to send an SNMP trap to an SNMP manager (Nagios, Zabbix, etc). In this part, we are going to cover the following parts:

  • MIB (SNMP object definition)

  • SNMP agent (reporting)

Architecture

In this example, we have a Nagios server as the SNMP manager, with a ClusterControl server (SNMP agent) monitoring a 3-node Galera Cluster as illustrated in the following diagram:


All Instructions in this post are based on CentOS 7.

Installing SNMP on the ClusterControl server

1) Install SNMP-related packages:

$ yum install net-snmp net-snmp-perl perl-Net-SNMP perl-CPAN

2) Make sure the content of `/etc/snmp/snmpd.conf` has the following:

$ grep -v '^\s*$\|^\s*\#' /etc/snmp/snmpd.conf
com2sec   notConfigUser  default              public
com2sec   mynet          192.168.10.0/16      private
com2sec   mynet          localhost            private
group   notConfigGroup v1            notConfigUser
group   notConfigGroup v2c           notConfigUser
group   myGroup        v2c           mynet
view    all           included   .1
view    systemview    included   .1.3.6.1.2.1.1
view    systemview    included   .1.3.6.1.2.1.25.1.1
access  notConfigGroup ""      any       noauth    exact  systemview none none
access  myGroup        ""      any       noauth    exact  all        all  none
master agentx
agentXSocket    tcp:localhost:161
syslocation Unknown (edit /etc/snmp/snmpd.conf)
syscontact Root <root@localhost> (configure /etc/snmp/snmp.local.conf)
dontLogTCPWrappersConnects yes

A bit of explanation:

  • Severalnines's MIB is a private component, therefore, we need to allow only our network, 192.168.10.0/16 and localhost to query the SNMP data. We define this in the "com2sec" section.

  • Then we create a security group called "myGroup", which only allows connections from "mynet" network, and accepts protocol SNMP version 2c.

  • Then we define the view (what can be seen from the requester). "all" means the SNMP requester can see everything (starting from OID .1). "systemview" is only limited to safe-to-public information like hostname, datetime, etc which is the default for public SNMP users.

  • Then we allow "myGroup" to have an "all" view.

3) Restart the SNMP service to load the changes:

$ systemctl restart snmpd

4) Now, you should be able to see some MIBs if we perform snmpwalk:

$ snmpwalk -v2c -cpublic localhost # should return limited entries
$ snmpwalk -v2c -cprivate localhost # should return thousands of entries because the private view starts with .1


Installing ClusterControl MIBs on the ClusterControl server

MIB stands for Management Information Base. It is a formatted text file that lists the data objects used by a particular piece of SNMP equipment. Without MIB, the OID used by SNMP can't be translated into a "thing". The SNMP MIB definitions are written in concise MIB format in accordance with RFC 1212. Severalnines has its own Private Enterprise Number (PEN), 57397. You can check the registered enterprise number database here.

1) Copy the SEVERALNINES-CLUSTERCONTROL-MIB.txt and put it under /usr/share/snmp/mibs. To check which MIB path SNMP would look for, use this command:

$ net-snmp-config --default-mibdirs


2) To load our custom MIB, we need to create a new configuration file at /etc/snmp/snmp.conf (notice without the "d") and add the following line:

mibs +SEVERALNINES-CLUSTERCONTROL-MIB


3) Restart SNMP daemon to load the change:

$ systemctl restart snmpd


4) To see if the MIB is loaded properly, use the snmptranslate command:

$ snmptranslate -IR -On -Tp severalnines
+--severalnines(57397)
   |
   +--clustercontrolMIB(1)
      |
      +--alarms(1)
         |
         +--alarmSummary(1)
         |  |
         |  +-- -R-- Integer32 totalAlarms(1)
         |  |        Range: 0..2147483647
         |  +-- -R-- Integer32 totalCritical(2)
         |  |        Range: 0..2147483647
         |  +-- -R-- Integer32 totalWarning(3)
         |  |        Range: 0..2147483647
         |  +-- -R-- Integer32 clusterId(4)
         |           Range: 0..2147483647
         |
         +--alarmSummaryGroup(2)
         |
         +--alarmNotification(3)
            |
            +--criticalAlarmNotification(1)


The above output shows that we have loaded our ClusterControl's MIB. For this proof-of-concept, we only have one main component called "alarms", and underneath it, we have 3 sub-components alongside their datatype:

  • alarmSummary - Summary of alarms. Just showing critical, warning and the corresponding cluster ID.

  • alarmSummaryGroup - Grouping of our SNMP objects.

  • alarmNotification - This is for SNMP trap definition. Without this, our SNMP trap won't be understandable by the SNMP manager.


The numbering next to it indicates the object identifier (OID). For example, totalWarning OID is .1.3.6.1.4.1.57397.1.1.1.3 and criticalAlarmNotification OID is .1.3.6.1.4.1.57397.1.1.3.1. For private organizations, OID always starts with ".1.3.6.1.4.1", followed by the enterprise number (57397 is Severalnines' PEN) and then the MIB objects.

Installing the SNMP agent on the ClusterControl server

To "serve" the SNMP object output (the number of critical alarms, cluster id and so on), we need to extend the SNMP daemon with an SNMP agent. In SNMP, they call this protocol as AgentX, which we have defined in the snmpd.conf under this section:

master agentx
agentXSocket    tcp:localhost:161


As you can see, it listens to TCP 161 (works on UDP too) where the agent will attach to this port and extend the SNMP processing. For this proof-of-concept, I have prepared a script written in Perl to retrieve and report the alarm's summary into SNMP/OID formatting.


1) Install Perl SNMP component:

$ yum install perl-Net-SNMP

2) Put clustercontrol-snmp-agent.pl anywhere accessible by the SNMP process. It is recommended to put it under the /usr/share/snmp directory.

$ ls -al /usr/share/snmp/clustercontrol-snmp-agent.pl
-rwxr-xr-x 1 root root 2974 May 10 14:16 /usr/share/snmp/clustercontrol-snmp-agent.pl

3) Configure the following lines inside the script (line 14 to 17):

my $clusterId = 23; # cluster ID that you want to monitor
my $totalAlarm = `/bin/s9s alarms --list --cluster-id=$clusterId --batch | wc -l`;
my $criticalAlarm = `/bin/s9s alarms --list --cluster-id=$clusterId --batch | grep CRITICAL | wc -l`;
my $warningAlarm = `/bin/s9s alarms --list --cluster-id=$clusterId --batch | grep WARNING | wc -l`;

4) Set the script with executable permission:

$ chmod 755 /usr/share/snmp/clustercontrol-snmp-agent.pl

5) Run the script:

$ perl /usr/share/snmp/clustercontrol-snmp-agent.pl
NET-SNMP version 5.7.2 AgentX subagent connected


Make sure you see the "subagent connected" line. At this point, the ClusterControl alarm should be reported correctly via SNMP protocol. To check, simply use the snmpwalk command:

$ snmpwalk -v2c -c private localhost .1.3.6.1.4.1.57397.1.1.1
SEVERALNINES-CLUSTERCONTROL-MIB::totalAlarms = INTEGER: 3
SEVERALNINES-CLUSTERCONTROL-MIB::totalCritical = INTEGER: 2
SEVERALNINES-CLUSTERCONTROL-MIB::totalWarning = INTEGER: 1
SEVERALNINES-CLUSTERCONTROL-MIB::clusterId = INTEGER: 23

Alternatively, you can also use the MIB object name instead which produces the same result:

$ snmpwalk -v2c -c private localhost SEVERALNINES-CLUSTERCONTROL-MIB::alarmSummary
SEVERALNINES-CLUSTERCONTROL-MIB::totalAlarms = INTEGER: 3
SEVERALNINES-CLUSTERCONTROL-MIB::totalCritical = INTEGER: 2
SEVERALNINES-CLUSTERCONTROL-MIB::totalWarning = INTEGER: 1
SEVERALNINES-CLUSTERCONTROL-MIB::clusterId = INTEGER: 23

Final Thoughts

This is just a very simple proof-of-concept (PoC) on how ClusterControl can be integrated with the SNMP protocol. In the next episode, we are going to look into sending SNMP traps from the ClusterControl server to the SNMP manager like Nagios, Zabbix or Sensu.


Integrating ClusterControl with SNMP : Part Two

$
0
0

This blog post is a continuation of the previous part 1, where we have covered the basics of SNMP integration with ClusterControl.

In this blog post, we are going to focus on SNMP traps and alerting. SNMP traps are the most frequently used alert messages sent from a remote SNMP-enabled device (an agent) to a central collector, the “SNMP manager.” In the case of ClusterControl, a trap could be an alert after the critical alarm for a cluster is not 0, indicating something bad is happening. 

As shown in the previous blog post, for the purpose of this proof-of-concept, we have two SNMP trap notifications definition:

criticalAlarmNotification NOTIFICATION-TYPE
    OBJECTS { totalCritical, clusterId }
    STATUS current
    DESCRIPTION
        "Notification if critical alarm is not 0"
    ::= { alarmNotification 1 }

criticalAlarmNotificationEnded NOTIFICATION-TYPE
    OBJECTS { totalCritical, clusterId }
    STATUS  current
    DESCRIPTION
        "Notification ended - Critical alarm is 0"
    ::= { alarmNotification 2 }

The notifications (or traps) are criticalAlarmNotification and criticalAlarmNotificationEnded. Both notification events can be used to signal our Nagios service, whether the cluster is actively having critical alarms or not. In Nagios, the term for this is passive check, whereby Nagios does not attempt to determine whether or host/service is DOWN or UNREACHABLE. We will also configure the active checks, where checks are initiated by the check logic in the Nagios daemon by using the service definition to also monitor the critical/warning alarms reported by our cluster.

Take note that this blog post requires the Severalnines MIB and SNMP agent configured correctly as shown in the first part of this blog series.

Installing Nagios Core

Nagios Core is the free version of the Nagios monitoring suite. First and foremost, we have to install it and all necessary packages, followed by the Nagios plugins, snmptrapd and snmptt. Note that instructions in this blog post are assuming all nodes are running on CentOS 7.

Install the necessary packages to run Nagios:

$ yum -y install httpd php gcc glibc glibc-common wget perl gd gd-devel unzip zip sendmail net-snmp-utils net-snmp-perl

Create a nagios user and nagcmd group for allowing the external commands to be executed through the web interface, add the nagios and apache user to be a part of the nagcmd group:

$ useradd nagios
$ groupadd nagcmd
$ usermod -a -G nagcmd nagios
$ usermod -a -G nagcmd apache

Download the latest version of Nagios Core from here, compile and install it:

$ cd ~
$ wget https://assets.nagios.com/downloads/nagioscore/releases/nagios-4.4.6.tar.gz
$ tar -zxvf nagios-4.4.6.tar.gz
$ cd nagios-4.4.6
$ ./configure --with-nagios-group=nagios --with-command-group=nagcmd
$ make all
$ make install
$ make install-init
$ make install-config
$ make install-commandmode

Install the Nagios web configuration:

$ make install-webconf

Optionally, install the Nagios exfoliation theme (or you could stick to the default theme):

$ make install-exfoliation

Create a user account (nagiosadmin) for logging into the Nagios web interface. Remember the password that you assign to this user:

$ htpasswd -c /usr/local/nagios/etc/htpasswd.users nagiosadmin

Restart Apache webserver to make the new settings take effect:

$ systemctl restart httpd
$ systemctl enable httpd

Download the Nagios Plugins from here, compile and install it:

$ cd ~ 
$ wget https://nagios-plugins.org/download/nagios-plugins-2.3.3.tar.gz
$ tar -zxvf nagios-plugins-2.3.3.tar.gz
$ cd nagios-plugins-2.3.3
$ ./configure --with-nagios-user=nagios --with-nagios-group=nagios
$ make
$ make install

Verify the default Nagios configuration files:

$ /usr/local/nagios/bin/nagios -v /usr/local/nagios/etc/nagios.cfg

Nagios Core 4.4.6
Copyright (c) 2009-present Nagios Core Development Team and Community Contributors
Copyright (c) 1999-2009 Ethan Galstad
Last Modified: 2020-04-28
License: GPL
Website: https://www.nagios.org
Reading configuration data...
   Read main config file okay...
   Read object config files okay...
Running pre-flight check on configuration data...
Checking objects...
Checked 8 services.
Checked 1 hosts.
Checked 1 host groups.
Checked 0 service groups.
Checked 1 contacts.
Checked 1 contact groups.
Checked 24 commands.
Checked 5 time periods.
Checked 0 host escalations.
Checked 0 service escalations.
Checking for circular paths...
Checked 1 hosts
Checked 0 service dependencies
Checked 0 host dependencies
Checked 5 timeperiods
Checking global event handlers...
Checking obsessive compulsive processor commands...
Checking misc settings...
Total Warnings: 0
Total Errors:   0
Things look okay - No serious problems were detected during the pre-flight check
If everything looks okay, start Nagios and configure it to start on boot:
$ systemctl start nagios
$ systemctl enable nagios

Open the browser and go to http://{IPaddress}/nagios and you should see an HTTP basic authentication pops up where you need to specify the username as nagiosadmin with your chosen password created earlier.

Adding ClusterControl server into Nagios

Create a Nagios host definition file for ClusterControl:

$ vim /usr/local/nagios/etc/objects/clustercontrol.cfg

And add the following lines:

define host {
        use                     linux-server
        host_name               clustercontrol.local
        alias                   clustercontrol.mydomain.org
        address                 192.168.10.50
}

define service {
        use                     generic-service
        host_name               clustercontrol.local
        service_description     Critical alarms - ClusterID 23
        check_command           check_snmp! -H 192.168.10.50 -P 2c -C private -o .1.3.6.1.4.1.57397.1.1.1.2 -c0
}

define service {
        use                     generic-service
        host_name               clustercontrol.local
        service_description     Warning alarms - ClusterID 23
        check_command           check_snmp! -H 192.168.10.50 -P 2c -C private -o .1.3.6.1.4.1.57397.1.1.1.3 -w0
}


define service {
        use                     snmp_trap_template
        host_name               clustercontrol.local
        service_description     Critical alarm traps
        check_interval          60 ; Don't clear for 1 hour
}

Some explanations:

  • In the first section, we define our host, with the hostname and address of the ClusterControl server.

  • The service sections where we put our service definitions to be monitored by the Nagios. The first two is basically telling the service to check the SNMP output for a particular object ID. The first service is about the critical alarm, therefore we add -c0 in the check_snmp command to indicate that it should be a critical alert in Nagios if the value goes beyond 0. While for the warning alarms, we will indicate it with a warning if the value is 1 and higher.

  • The last service definition is about the SNMP traps that we would expect coming from the ClusterControl server if the critical alarm raised is higher than 0. This section will use the snmp_trap_template definition, as shown in the next step.

Configure the snmp_trap_template by adding the following lines into /usr/local/nagios/etc/objects/templates.cfg:

define service {
        name                            snmp_trap_template
        service_description             SNMP Trap Template
        active_checks_enabled           1       ; Active service checks are enabled
        passive_checks_enabled          1       ; Passive service checks are enabled/accepted
        parallelize_check               1       ; Active service checks should be parallelized
        process_perf_data               0
        obsess_over_service             0       ; We should obsess over this service (if necessary)
        check_freshness                 0       ; Default is to NOT check service 'freshness'
        notifications_enabled           1       ; Service notifications are enabled
        event_handler_enabled           1       ; Service event handler is enabled
        flap_detection_enabled          1       ; Flap detection is enabled
        process_perf_data               1       ; Process performance data
        retain_status_information       1       ; Retain status information across program restarts
        retain_nonstatus_information    1       ; Retain non-status information across program restarts
        check_command                   check-host-alive      ; This will be used to reset the service to "OK"
        is_volatile                     1
        check_period                    24x7
        max_check_attempts              1
        normal_check_interval           1
        retry_check_interval            1
        notification_interval           60
        notification_period             24x7
        notification_options            w,u,c,r
        contact_groups                  admins       ; Modify this to match your Nagios contactgroup definitions
        register                        0
}

Include the ClusterControl configuration file into Nagios, by adding the following line inside  

/usr/local/nagios/etc/nagios.cfg:
cfg_file=/usr/local/nagios/etc/objects/clustercontrol.cfg

Run a pre-flight configuration check:

$ /usr/local/nagios/bin/nagios -v /usr/local/nagios/etc/nagios.cfg

Make sure you get the following line at the end of the output:

"Things look okay - No serious problems were detected during the pre-flight check"

Restart Nagios to load the change:

$ systemctl restart nagios

Now if we look at the Nagios page under the Service section (left-side menu), we would see something like this:

Notice the "Critical alarms - ClusterID 1" row turns red if the critical alarm value reported by ClusterControl is bigger than 0, while the "Warning alarms - ClusterID 1" is yellow, indicating that there is a warning alarm raised. In case if nothing interesting happens, you would see everything is green for clustercontrol.local.

Configuring Nagios to receive a trap

Traps are sent by remote devices to the Nagios server, this is called a passive check. Ideally, we don't know when a trap will be sent as it depends on the sending device decides it will send a trap. For example with a UPS (battery backup), as soon as the device loses power, it will send a trap to say "hey, I lost power". This way Nagios is informed immediately.

In order to receive SNMP traps, we need to configure the Nagios server with the following things:

  • snmptrapd (SNMP trap receiver daemon)

  • snmptt (SNMP Trap Translator, the trap handler daemon)

After the snmptrapd receives a trap, it will pass it to snmptt where we will configure it to update the Nagios system and then Nagios will send out the alert according to the contact group configuration.

Install EPEL repository, followed by the necessary packages:

$ yum -y install epel-release
$ yum -y install net-snmp snmptt net-snmp-perl perl-Sys-Syslog

Configure the SNMP trap daemon at /etc/snmp/snmptrapd.conf and set the following lines:

disableAuthorization yes
traphandle default /usr/sbin/snmptthandler

The above simply means traps received by the snmptrapd daemon will be passed over to /usr/sbin/snmptthandler.

Add the SEVERALNINES-CLUSTERCONTROL-MIB.txt into /usr/share/snmp/mibs by creating /usr/share/snmp/mibs/SEVERALNINES-CLUSTERCONTROL-MIB.txt:

$ ll /usr/share/snmp/mibs/SEVERALNINES-CLUSTERCONTROL-MIB.txt
-rw-r--r-- 1 root root 4029 May 30 20:08 /usr/share/snmp/mibs/SEVERALNINES-CLUSTERCONTROL-MIB.txt

Create /etc/snmp/snmp.conf (notice without the "d") and add our custom MIB there:

mibs +SEVERALNINES-CLUSTERCONTROL-MIB

Start the snmptrapd service:

$ systemctl start snmptrapd
$ systemctl enable snmptrapd

Next, we need to configure the following configuration lines inside /etc/snmp/snmptt.ini:

net_snmp_perl_enable = 1
snmptt_conf_files = <<END
/etc/snmp/snmptt.conf
/etc/snmp/snmptt-cc.conf
END

Note that we enabled the net_snmp_perl module and have added another configuration path, /etc/snmp/snmptt-cc.conf inside snmptt.ini. We need to define ClusterControl snmptt events here so they can be passed to Nagios. Create a new file at /etc/snmp/snmptt-cc.conf and add the following lines:

MIB: SEVERALNINES-CLUSTERCONTROL-MIB (file:/usr/share/snmp/mibs/SEVERALNINES-CLUSTERCONTROL-MIB.txt) converted on Sun May 30 19:17:33 2021 using snmpttconvertmib v1.4.2

EVENT criticalAlarmNotification .1.3.6.1.4.1.57397.1.1.3.1 "Status Events" Critical
FORMAT Notification if the critical alarm is not 0
EXEC /usr/local/nagios/share/eventhandlers/submit_check_result $aA "Critical alarm traps" 2 "Critical - Critical alarm is $1 for cluster ID $2"
SDESC
Notification if critical alarm is not 0
Variables:
  1: totalCritical
  2: clusterId
EDESC

EVENT criticalAlarmNotificationEnded .1.3.6.1.4.1.57397.1.1.3.2 "Status Events" Normal
FORMAT Notification if the critical alarm is not 0
EXEC /usr/local/nagios/share/eventhandlers/submit_check_result $aA "Critical alarm traps" 0 "Normal - Critical alarm is $1 for cluster ID $2"
SDESC
Notification ended - critical alarm is 0
Variables:
  1: totalCritical
  2: clusterId
EDESC

Some explanations:

  • We have two traps defined - criticalAlarmNotification and criticalAlarmNotificationEnded.

  • The criticalAlarmNotification simply raises a critical alert and passes it to the "Critical alarm traps" service defined in Nagios. The $aA means to return the trap agent IP address. The value 2 is the check result value which in this case is critical (0=OK, 1=WARNING, 2=CRITICAL, 3=UNKNOWN).

  • The criticalAlarmNotificationEnded simply raises an OK alert and passes it to the "Critical alarm traps" service, to cancel the previous trap after everything backs to normal. The $aA means to return the trap agent IP address. The value 0  is the check result value which in this case is OK. For more details on string substitutions recognized by snmptt, check out this article under the "FORMAT" section.

  • You may use snmpttconvertmib to generate snmptt event handler file for a particular MIB.

Note that by default, the eventhandlers path is not provided by the Nagios Core. Therefore, we have to copy that eventhandlers directory from the Nagios source under the contrib directory, as shown below:

$ cp -Rf nagios-4.4.6/contrib/eventhandlers /usr/local/nagios/share/
$ chown -Rf nagios:nagios /usr/local/nagios/share/eventhandlers

We also need to assign snmptt group as part of the nagcmd group, so it can execute the nagios.cmd inside the submit_check_result script:

$ usermod -a -G nagcmd snmptt

Start the snmptt service:

$ systemctl start snmptt
$ systemctl enable snmptt

The SNMP Manager (Nagios server) is now ready to accept and process our incoming SNMP traps.

Sending a trap from the ClusterControl server

Suppose one wants to send an SNMP trap to the SNMP manager, 192.168.10.11 (Nagios server) because the total number of critical alarms has reached 2 for cluster ID 1, one would run the following command on the ClusterControl server (client-side), 192.168.10.50:

$ snmptrap -v2c -c private 192.168.10.11 '' SEVERALNINES-CLUSTERCONTROL-MIB::criticalAlarmNotification \
SEVERALNINES-CLUSTERCONTROL-MIB::totalCritical i 2 \
SEVERALNINES-CLUSTERCONTROL-MIB::clusterId i 1

Or, in OID format (recommended):

$ snmptrap -v2c -c private 192.168.10.11 '' .1.3.6.1.4.1.57397.1.1.3.1 \
.1.3.6.1.4.1.57397.1.1.1.2 i 2 \
.1.3.6.1.4.1.57397.1.1.1.4 i 1

Where, .1.3.6.1.4.1.57397.1.1.3.1 is equal to criticalAlarmNotification trap event, and the subsequent OIDs are representations of the total number of the current critical alarms and the cluster ID, respectively.

On the Nagios server, you should notice the trap service has turned red:

You can also see it in the /var/log/messages of the following line:

May 30 23:52:39 ip-10-15-2-148 snmptrapd[27080]: 2021-05-30 23:52:39 UDP: [192.168.10.50]:33151->[192.168.10.11]:162 [UDP: [192.168.10.50]:33151->[192.168.10.11]:162]:#012DISMAN-EVENT-MIB::sysUpTimeInstance = Timeticks: (2423020) 6:43:50.20#011SNMPv2-MIB::snmpTrapOID.0 = OID: SEVERALNINES-CLUSTERCONTROL-MIB::criticalAlarmNotification#011SEVERALNINES-CLUSTERCONTROL-MIB::totalCritical = INTEGER: 2#011SEVERALNINES-CLUSTERCONTROL-MIB::clusterId = INTEGER: 1
May 30 23:52:42 nagios.local snmptt[29557]: .1.3.6.1.4.1.57397.1.1.3.1 Critical "Status Events" UDP192.168.10.5033151-192.168.10.11162 - Notification if critical alarm is not 0
May 30 23:52:42 nagios.local nagios: EXTERNAL COMMAND: PROCESS_SERVICE_CHECK_RESULT;192.168.10.50;Critical alarm traps;2;Critical - Critical alarm is 2 for cluster ID 1
May 30 23:52:42 nagios.local nagios: PASSIVE SERVICE CHECK: clustercontrol.local;Critical alarm traps;0;PING OK - Packet loss = 0%, RTA = 22.16 ms
May 30 23:52:42 nagios.local nagios: SERVICE NOTIFICATION: nagiosadmin;clustercontrol.local;Critical alarm traps;CRITICAL;notify-service-by-email;Critical - Critical alarm is 2 for cluster ID 1
May 30 23:52:42 nagios.local nagios: SERVICE ALERT: clustercontrol.local;Critical alarm traps;CRITICAL;HARD;1;Critical - Critical alarm is 2 for cluster ID 1

Once the alarm has resolved, to send a normal trap, we may execute the following command:

$ snmptrap -c private -v2c 192.168.10.11 '' .1.3.6.1.4.1.57397.1.1.3.2 \ 
.1.3.6.1.4.1.57397.1.1.1.2 i 0 \
.1.3.6.1.4.1.57397.1.1.1.4 i 1

Where, .1.3.6.1.4.1.57397.1.1.3.2 is equal to criticalAlarmNotificationEnded event, and the subsequent OIDs are representations of the total number of the current critical alarms (should be 0 for this case) and the cluster ID, respectively.

On the Nagios server, you should notice the trap service is back to green:

The above can be automated with a simple bash script:

#!/bin/bash
# alarmtrapper.bash - SNMP trapper for ClusterControl alarms

CLUSTER_ID=1
SNMP_MANAGER=192.168.10.11
INTERVAL=10

send_critical_snmp_trap() {
        # send critical trap
        local val=$1
        snmptrap -v2c -c private ${SNMP_MANAGER} '' .1.3.6.1.4.1.57397.1.1.3.1 .1.3.6.1.4.1.57397.1.1.1.1 i ${val} .1.3.6.1.4.1.57397.1.1.1.4 i ${CLUSTER_ID}
}

send_zero_critical_snmp_trap() {
        # send OK trap
        snmptrap -v2c -c private ${SNMP_MANAGER} '' .1.3.6.1.4.1.57397.1.1.3.2 .1.3.6.1.4.1.57397.1.1.1.1 i 0 .1.3.6.1.4.1.57397.1.1.1.4 i ${CLUSTER_ID}
}

while true; do
        count=$(s9s alarm --list --long --cluster-id=${CLUSTER_ID} --batch | grep CRITICAL | wc -l)
        [ $count -ne 0 ] && send_critical_snmp_trap $count || send_zero_critical_snmp_trap
        sleep $INTERVAL
done

To run the script in the background, simply do:

$ bash alarmtrapper.bash &

At this point, we should be able to see Nagios's "Critical alarm traps" service in action if there is a failure in our cluster automatically.

Final Thoughts

In this blog series, we have shown a proof-of-concept on how ClusterControl can be configured for monitoring, generating/processing traps and alerting using SNMP protocol. This also marks the beginning of our journey to incorporate SNMP in our future releases. Stay tuned as we will bring more updates on this exciting feature.

Six Critical Components of Successful Data Governance

$
0
0

What is Data Governance?

For large organizations or companies that are into data management, data governance possesses the key to success in managing, controlling, or governing the data that has been owned or collected. It is fundamental for any organization or companies. Your business benefits from consistent, common processes and responsibilities if your data governance strategy works according to plan. Your business drivers will highlight what data needs to be carefully controlled in your data governance strategy, as the results shall follow the expected benefits of this effort. This strategy shall be the basis of your data governance framework or program.

Data governance defines a set of principles to ensure data quality in a company. It describes the processes, roles, policies or responsibilities, and metrics collectively to ensure accountability and ownership of data assets across the enterprise. 

Data governance is the key to achieve organizational goals, especially on the enterprise level. It defines who can take what action, upon what data, in what situations, using what methods. To sum up, what data governance is, is about standards, policies, and how it can be reusable based on its models. Its overall scope covers the system of decision rights and accountabilities for information-related processes, executed according to agreed-upon models, which describe who can take what actions with what information and when, under what circumstances, using what methods. 

In a given example, consider those entities that are into medical insurance or health-related organizations or companies. Data privacy is very crucial and has to comply with regulatory compliance such as HIPAA or GDPR. If your business driver for your data governance strategy ensures privacy, patient data will need to be managed securely as it flows through your business. Retention requirements (e.g. history of who changed what information and when) will be defined to ensure compliance with relevant government requirements.

Critical Components of Successful Data Governance

Good data and analytics governance enable faster, smarter decisions. Data and analytics leaders, including Chief Data Officers (CDO), must ensure their data and analytics assets are well-governed to enable business strategy and enterprise priorities. A well processed data governance provides necessary insights to make optimal business decisions. With all of these, important factors serve as the key components that are critical for data governance success. 

In this blog, we'll cover the five critical components of successful data governance.

Data Architecture

Data architecture acts as the heart and soul of data governance. If the architectural design flaws, data quality would end up poor or corrupted in nature. Whatever has been digested and processed, the result cannot be reliable and can affect insights analysed by the enterprise and affect business goals.

According to The Open Group Architecture Framework (TOGAF), Data Architecture describes the structure of an organization's logical and physical data assets and data management resources. It is an offshoot of enterprise architecture that comprises the models, policies, rules, and standards that govern the collection, storage, arrangement, integration, and use of data in organizations. An organisation’s data architecture is the purview of data architects.

Data Architecture unravels the mystery between a series of components covered by data governance. It systematically connects all the components involved as data is being taken care of within an organization or enterprise entity. It simply explains where data exists and how it travels throughout the organization (either private or egress and ingress data) and its systems. It highlights changes and transformations made as data moves from one system to the next. 

These data inventory and data flow diagrams provide the information and tools the Data Governance Team (DGT) needs to make decisions about data policies and standards properly. In fact, in many instances business stakeholders say they’d like to understand better the data landscape and how it moves across the organization. DGT’s role in educating the organization on this information and overlaying it with architectural policies and standards helps to ensure data accuracy and integrity throughout its life cycle.

Quality of Data

Your data quality reflects on how it is being collected, planned, analyzed, and processed. According to Gartner, Forty-two percent of data and analytics leaders do not assess, measure or monitor their data and analytics governance based on a Gartner survey. Whereas those who said they measured their governance activity mainly focused on achieving compliance-oriented goals.

Data governance motivates the organization or company to enable faster and smarter decisions with the right data and analytics. As data governance is fast improving nowadays, organizations are starting to look into this as it's a good start to begin focusing on data and analytics to help improve the quality of their data as it grows. It provides better information to drive better information behaviors through their policies. These policies help maximize the investment that organizations have in data and analytics and content either it's multimedia, business emails, etc. However, governance practices continue to be data-oriented rather than business-oriented. 

As data governance oversees the quality of the data, the DGT shall identify when data is corrupt, stale, or inaccurate. Old or stale data can be archived or purged if no longer needed. Quality of the data is not the only one that has to be maintained but shall also consider the cost, and should consider to clean one's closet and avoid any mess with your targeted data. Your Data Governance Team has to be able to set rules and processes easily. Your trusted data shall represent as the pillars for data driven organizations that make decisions based on information from many different sources. Dataversity report said that 58 percent of those organizations who participated in their survey said that understanding source data quality was one of the most serious bottlenecks in their organization’s data value chain. It's worth noting that based on their survey, automating and matching business terms with data assets and documenting lineage down to the column level are critical steps to optimizing data quality.

Data Management

This is where you have to ask these important questions, what data to manage and where it shall reside? Does it need to store on-prem or would it be valuable and valid to have data reside on a third-party such as public cloud.

Data management is essentially the execution of the data governance strategy. It sets the responsibility for implementing the standards and policies that the data governance strategy or framework has been inculcated. It covers the common tasks such as

  • Creating Role-Based Access rules (RBAC) which sets the level of access for data

  • Implementing database rules in alignment to the data governance policy

  • Establish and maintain  the data security ] to comply with what the DGT of CDOs has identified for the data owned by the organization

  • Taking the appropriate measures to minimize risk associated with storing sensitive data

  • Creating a system for master data management, which is a single view of data across the enterprise.

Data management is key to performing this sort of data inventory: Having a strategy and methods for accessing, integrating, storing, transferring, and preparing data for analytics. According to Forrester Research, effective data governance grows out of data management maturity. 

Data Software Tools

Data governance covers the data lifecycle management processes. It aims to ensure the availability, usability and integrity of the data. While these are maintained, the DGT and the CDOs must constantly monitor and analyse the organisation’s data. It has to be taken care of properly and be kept safely and securely. This cannot be achieved without the proper software tools relied on as the solutions available to be used. It can be relying on third-party services, especially when it is stored in the cloud or on-prem.

These solutions help organizations maintain a consistent set of policies, processes, and owners around their data assets enabling them to monitor, manage, and control data movement effectively. These products help users establish guidelines, rules, and accountability measures to ensure data quality standards are met. Data governance tools will often provide recommendations as well, to increase efficiency and streamline processes.

Security

In our previous post, among the countless number of malware threats affecting businesses, ransomware is the biggest offender, costing organizations over $7.5 billion in 2019 alone. Imagine how drastic security breaches could deteriorate your organizational plan to build an enterprise to proliferate. 

Data governance is vital as the CDOs or DGT has to analyze thoroughly and cover those confidential data. If data security is systematically architectured, it is traceable same similar to successful data management. It can determine where your data comes from, where it is, who has access to it, how it’s used, and how to delete it. 

Data governance defines your organizational data management rules and procedures, preventing potential leaks of sensitive business information or customer data so data doesn’t fall into the wrong hands. As data grows, it can be a pure challenge. 

For legacy platforms and for bigger organizations with rich data, legacy platforms tend to create siloed information that is harder to determine where it came from. Those silos are often exported, mostly to your database, and duplicated to combine data with other siloed data, making it even harder to know where all the data went. 

Compliance

Data governance and compliance works hand in hand. In the Dataversity report, 48% of companies ranked regulatory compliance as their primary driver for data governance. Without proper data governance, how can you be confident your organization is adhering to regulations? 

Data matures quickly, especially when this pandemic has begun; people rely so much on social media and other means over the internet to avoid contact with other people. Data grows so much and that means data compliance has to be addressed priorly and well taken cared of by such organizations or companies holding your sensitive information and data. Organizations have to be compliant with what regulations in their government they belong to. Under the European Union, you have GDPR (General Data Protection Regulation), while in the US you have the well known PCI DSS (Payment Card Industry Data Security Standard), HIPAA (Health Insurance Portability and Accountability Act), and SOX ACT or Sarbanes–Oxley Act of 2002 (also known as the Public Company Accounting Reform and Investor Protection Act). 

Compliance is very critical to successful governance as this strategy has to be in place prior to harvesting and maturing the data within the organization. Compliance directs the organization to get started under the regulations and compliance within the government, which your data governance framework has covered. These regulations require organizations to be able to trace their data from source upto its obsolescence, identify who has access to it, and know how and where it is used. Data governance sets rules and procedures around ownership and accessibility of data. 

Your data governance framework ensures that your data is fit for its purpose. By aligning your organization’s people, processes, and technology around a central data strategy, you can begin to leverage your data to benefit larger business goals. In terms of compliance, having clear control processes over your data aligns with pre-set business rules. This is especially important in highly regulated industries such as finance and insurance. Data governance means ensuring you have processes in place to control your data and assure that all regulations are met in all your organization’s data practices. Effective compliance can only come with a holistic and complete approach to your data governance strategy. How can you expect to be 100% certain you are adhering to regulations without complete control over your data and how it is collected and stored. Without it, sensitive information can get into the wrong hands or be improperly expunged, leading to governmental or regulatory financial penalties, lawsuits, and even jail time. Snowflake offers features that can set controls on data ownership and access, enabling the implementation of rules and procedures for data governance. These include Dynamic Data Masking and Secure Views. 

The three critical aspects of building an effective data governance strategy are the people, processes, and technology. With an effective strategy, not only can you ensure that your organization remains compliant, but you can also add value to your overall business strategy.

Conclusion

Data governance is not a fixed and constant flow. It is a convention and practice that has to be dynamically a work in progress. Data governance relies on how the data matures within the organization or company, especially being used in the enterprise level. It is crucial to organizations that value its data or data serves as the primary driver of the organization's interest to stabilize its financial performance. Determining these 6 critical components is a must and has to delegate the right people to manage and secure the interest of the organization and company.

Managing Multiple Database Technologies with ClusterControl

$
0
0

Managing multiple open source database technologies in any environment can be a daunting task, especially if you have fewer resources. The scenario could be worse if deployment, monitoring and other database management task is done manually. If this sound scenario sounds familiar, this blog can help you automate open source heterogeneous databases management using database automation tools like ClusterControl.

For organizations or companies looking for enterprise solutions to manage their open source database of different technologies, ClusterControl would be a great option. ClusterControl supports various popular open source database technologies, including MySQL, MongoDB, PostgreSQL, MariaDB and many more and used by large organizations and companies for enterprise applications and complex architectures.

Solutions architects can efficiently utilize ClusterControl to fit into their existing environment and architecture. ClusterControl is a monolithic application but has multiple components that communicate with cmon. These components work cooperatively to seamlessly manage the different types of open source databases that ClusterControl supports.

Database Vendors Supported by ClusterControl 

ClusterControl allows you to deploy or create a database cluster from scratch for open source databases right from RDBMS to NoSQL databases. All you have to do is provide server connectivity information such as SSH credentials. ClusterControl will manage all the quirks and tidbits to run your database servers limited to the supported Linux operating systems.ClusterControl will add the required configuration parameters, tuning, and users, which it deems necessary, especially for backups, redundancy, and high availability for registered (or created) and imported databases.

Most of the database technologies (excluding MongoDB variants and NDB) that ClusterControl supports can be tied up easily with various load balancers or proxies, which is feasibly easy to set up with a few clicks using ClusterControl UI.

This is how it looks like for a ClusterControl with multiple database technologies being managed,

ClusterControl can manage thousands of clusters, but this depends on the capacity and resources of your server hosting the ClusterControl software.

MySQL/MariaDB/Percona Server

The Oracle MySQL can be deployed or imported in ClusterControl and can be setup as a primary-standby/master-slave replication. By default, once deployed and set up using ClusterControl, your Oracle MySQL replication will use semi-sync replication, which offers more consistency than asynchronous replication. This is configured and set as the standard configuration by cmon when deploying a primary standby replication.

MariaDB and Percona Server can be set up as a primary-standby/master-slave replication, and can also be set up using Galera Replication Plugin to create a synchronous replication. Same as Oracle MySQL, the primary-standby replication setup applies the same as well for a primary-standby replication. 

If MariaDB and Percona Server are set up to deploy a Galera cluster, then this means that the replication to be setup is deemed as a synchronous replication.

MySQL Cluster (NDB)

ClusterControl also supports the MySQL Cluster (NDB), a distributed database system commonly used in telecommunications or related industries. This technology is  Built for high availability and widely used in mission-critical enterprise applications that demand high performance levels. ClusterControl deploys NDB with a UI and reasonably easy to set up from the user standpoint. Still, the monitoring and management features for NDB are limited compared to what is offered for the other database technologies. Although MySQL Cluster (NDB) is a complicated database to manage, once you get used to working with NDB, it can be powerful, especially with its highly available capabilities.

PostgreSQL/TimescaleDB

Quoted as the World's Most Advanced Open Source Relational Database, PostgreSQL can be deployed or imported to ClusterControl and with rich features to offer as well. ClusterControl allows the user to set up a PostgreSQL replication to choose either synchronous or traditional asynchronous replication. 

TimescaleDB is an extension to PostgreSQL, which primarily specialize as an open-source relational database for time-series data. Although there are very few differences on how cmon manages TimescaleDB over PostgreSQL, most, if not all, features are the same. It can differ in supported versions, but management and monitoring for both are the same.

MongoDB/Percona Server for MongoDB

ClusterControl supports MongoDB or Percona Server for MongoDB as part of the NoSQL family of databases. Both vendors don't have differences on how it is being managed and monitored by ClusterControl. All the features that are present to manage a NoSQL support by ClusterControlares applicable for both vendors. You can deploy a ReplicaSet or MongoDB Shards with ClusterControl, and it is pretty easy to manage and set up through ClusterControl.

Automatic Failover with ClusterControl

ClusterControl is built to manage failures automatically without any further changes from the administrative side.  Failures can come hardware failure, data corruption, or accidents such as process ID beings killed or the data directory physically deleted, ClusterControl is built with from built with automatic recovery modes for Cluster and Node recovery as seen below:
 

Node recovery means that ClusterControl can recover a database node in case of intermittent failure by monitoring the process and connectivity to the database nodes. The process works similarly to systemd, where it will make sure the MySQL service is started and running unless you intentionally stopped it via ClusterControl UI.

On the other hand, cluster recovery ensures that ClusterControl understands the database topology and follows best practices in performing the recovery. For a database cluster that comes with built-in fault tolerance like Galera Cluster, NDB Cluster and MongoDB Replicaset, the failover process will be performed automatically by the database server via quorum calculation, heartbeat and role switching (if any). ClusterControl monitors the process and makes necessary adjustments to the visualization like reflecting the changes under Topology view and adjusting the monitoring and management component for the new role e.g, new primary node in a replica set.

If you want to read more of this, you can read more about how ClusterControl performs automatic database recovery and failover.

Ensuring a Secure Infrastructure

Security is one of the most important aspects of running a database. Whether you are a developer or a DBA, it is your responsibility to safeguard your data and protect it from unauthorized access if you manage the databases.

Keeping your databases secure requires attention to detail and an understanding of encryption, both in-transit and at-rest. Some industries are held to high-accountability standards with heftypenalties for failure to comply. 

Rather than letting your teams manually set up their open source databases, With ClusterControl point-and-click UI , you can deploy  easily and securely  to eliminate human error. It is also equipped with advanced security features that add a high-level of protection to your database infrastructure keeping your data secure.

Safeguarding Your Data

ClusterControl offers efficient and user friendly UI to enable SS,L which automates the configuration and setting up your secure transmission layer. For example, in MySQL-database variants, this can be located under the Security tab as shown below,

 ClusterControl enables the SSL/TLS for client-server communication and communication within replication in a Galera-based replication cluster as shown in the screenshot above.ClusterControl also offers advanced backup feature which lets you enable encryption at rest as the screenshot below. 


Photo author
Photo description

Database Automation with ClusterControl

Automation scripts are not required when you have ClusterContro!For example, in ClusterControl, backups can be created and run on the fly and can also create a backup policy and schedule a backup so it shall run automatically. Here's how it works,


Every action triggers a job in theapplication’s backgroundn and you will be notified when the job is For example, based on the backup that we triggered earlier. Once this job is done, an alarm is  triggered and delivered appropriately via e-mail or  your integrated third party notification system. This depends on your setup preferences with ClusterControl. In the example screenshot below, we have ClusterControl triggers the alarm as it notifies you of a successful backup that was running via its automated environment mechanism.


Conclusion

ClusterControl is efficiently feasible to manage large databases and environments using multiple database technologies. Although ClusterControl is monolithic, it offersmanyf advantages and supports different types of architectures as it can run via cloud or containerized environments.

How to configure SELinux for MySQL-based systems (MySQL/MariaDB Replication + Galera)

$
0
0

In the era that we are living in now, anything with a less secure environment is easily a target for an attack and becomes a bounty for the attackers. Compared to the past 20 years, hackers nowadays are more advanced not only with the skills but also with the tools that they are using. It’s no surprise why some giant companies are being hacked and their valuable data is leaked.

In the year 2021 alone, there are already more than 10 incidents related to data breaches. The most recent incident was reported by BOSE, a well-known audio maker that occurred in May. BOSE discovered that some of its current and former employees’ personal information was accessed by the attackers. The personal information exposed in the attack includes names, Social Security Numbers, compensation information, and other HR-related information.

What do you think is the purpose of this kind of attack and what motivates the hacker to do so? It’s obviously all about the money. Since stolen data is also frequently sold, by attacking big companies hackers can earn money. Not only the important data can be sold to the competitors of the business, but the hackers can also ask for a huge ransom at the same time. 

So how could we relate this to databases? Since the database is one of the big assets for the company, it is recommended to take care of it with enhanced security so that our valuable data is protected most of the time. In my last blog post, we already went through some introduction about SELinux, how to enable it, what type of mode SELinux has and how to configure it for MongoDB. Today, we will take a look into how to configure SELinux for MySQL based systems.

Top 5 Benefits of SELinux

Before going further, perhaps some of you are wondering if SELinux provides any positive benefits given it’s a bit of a hassle to enable it. Here are the top 5 SELinux benefits that you don’t want to miss and should consider:

  • Enforcing data confidentiality and integrity at the same time protecting processes

  • The ability to confine services and daemons to be more predictable

  • Reducing the risk of privilege escalation attacks

  • The policy enforced systems-wide, not set at user discretion and administratively-define

  • Providing a fine-grained access control

Before we start configuring the SELinux for our MySQL instances, why not go through how to enable SELinux with ClusterControl for all MySQL based deployments. Even though the step is the same for all database management systems, we think it is a good idea to include some screenshots for your reference.

Steps To Enable SELinux for MySQL Replication

In this section, we are going to deploy MySQL Replication with ClusterControl 1.8.2. The steps are the same for MariaDB, Galera Cluster or MySQL: assuming all nodes are ready and passwordless SSH is configured, let’s start the deployment. To enable SELinux for our setup, we need to untick “Disable AppArmor/SELinux” which means SELinux will be set as “permissive” for all nodes.

Next, we will choose Percona as a vendor (you can also choose MariaDB, Oracle or MySQL 8 as well), then specify the “root” password. You may use a default location or your other directories depending on your setup.

Once all hosts have been added, we can start the deployment and let it finish before we can begin with the SELinux configuration.

Steps To Enable SELinux for MariaDB Replication

In this section, we are going to deploy MariaDB Replication with ClusterControl 1.8.2.

We will choose MariaDB as a vendor and version 10.5 as well as specify the “root” password. You may use a default location or your other directories depending on your setup.

Once all hosts have been added, we can start the deployment and let it finish before we can proceed with the SELinux configuration.

Steps To Enable SELinux for Galera Cluster

In this section, we are going to deploy Galera Cluster with ClusterControl 1.8.2. Once again, untick “Disable AppArmor/SELinux” which means SELinux will be set as “permissive” for all nodes:

Next, we will choose Percona as a vendor and MySQL 8 as well as specify the “root” password. You may use a default location or your other directories depending on your setup. Once all hosts have been added, we can start the deployment and let it finish.


As usual, we can monitor the status of the deployment in the “Activity” section of the UI. 

How To Configure SELinux For MySQL

Considering all our clusters are MySQL based, the steps to configure SELinux are also the same. Before we start with the setup and since this is a newly setup environment we suggest you disable auto recovery mode for both cluster and node as per the screenshot below. By doing this, we could avoid the cluster run into a failover while we are doing the testing or restart the service:

First, let’s see what is the context for “mysql”. Go ahead and run the following command to view the context:

$ ps -eZ | grep mysqld_t

And the example of the output is as below:

system_u:system_r:mysqld_t:s0       845 ?        00:00:01 mysqld

The definition for the output above is:

  • system_u - User

  • system_r - Role

  • mysqld_t - Type

  • s0 845 - Sensitivity level

If you check the SELinux status, you can see the status is “permissive” which is not fully enabled yet. We need to change the mode to “enforcing” and in order to accomplish that we have to edit the SELinux configuration file to make it permanent. 

$ vi /etc/selinux/config
SELINUX=enforcing

Proceed to reboot the system after the changes. As we are changing the mode from “permissive” to “enforcing”, we need to relabel the file system again. Typically, you can choose whether to relabel the entire file system or only for one application. The reason why relabel is required due to the fact that “enforcing” mode needs the correct label or function to run correctly. In some instance, those labels are changed during the “permissive” or “disabled” mode.

For this example, we will relabel only one application (MySQL) using the following command:

$ fixfiles -R mysqld restore

For a system that has been used for quite some time, it is a good idea to relabel the entire file system. The following command will do the job without rebooting and this process might take a while depending on your system:

$ fixfiles -f -F relabel

Like many other databases, MySQL also demands to read and write a lot of files. Without a correct SELinux context for those files, the access will be unquestionably denied. To configure the policy for SELinux,  “semanage” is required. “semanage” also allows any configuration without a need of recompiling the policy sources. For the majority of Linux systems, this tool already installed by default. As for our case, it’s already installed with the following version:

$ rpm -qa |grep semanage
python3-libsemanage-2.9-3.el8.x86_64
libsemanage-2.9-3.el8.x86_64

For the system that does not have it installed, the following command will help you to install it:

$ yum install -y policycoreutils-python-utils

Now, let’s see what is the MySQL file contexts:

$ semanage fcontext -l | grep -i mysql

As you may notice, there are a bunch of files that are connected to MySQL once the above command is executed. If you recall at the beginning, we are using a default “Server Data Directory”. Should your installation is using a different data directory location, you need to update the context for “mysql_db_t” which refers to the /var/lib/mysql/

The first step is to change the SELinux context by using any of these options:

$ semanage fcontext -a -t mysqld_db_t /var/lib/yourcustomdirectory
$ semanage fcontext -a -e /var/lib/mysql /var/lib/yourcustomdirectory

After the step above, run the following command:

$ restorecon -Rv /var/lib/yourcustomdirectory

And lastly, restart the service:

$ systemctl restart mysql

In some setup, likely a different log location is required for any purpose. For this situation, “mysqld_log_t” needs to be updated as well. “mysqld_log_t” is a context for default location /var/log/mysqld.log and the steps below can be executed to update it:

$ semanage fcontext -a -t mysqld_log_t "/your/custom/error.log"
$ restorecon -Rv /path/to/my/custom/error.log
$ systemctl restart mysql

There will be a situation when the default port is configured using a different port other than 3306. For example, if you are using port 3303 for MySQL, you need to define the SELinux context with the following command:

$ semanage port -a -t mysqld_port_t -p tcp 3303

And to verify that the port has been updated, you may use the following command:

$ semanage port -l | grep mysqld

Using audit2allow To Generate Policy

Another way to configure the policy is by using “audit2allow” which already included during the “semanage” installation just now. What this tool does is by pulling the log events from the audit.log and use that information to create a policy. Sometimes, MySQL might need a non-standard policy, so this is the best way to achieve that.

First, let’s set the mode to permissive for the MySQL domain and verify the changes:

$ semanage permissive -a mysqld_t
$ semodule -l | grep permissive
permissive_mysqld_t
permissivedomains

The next step is to generate the policy using the command below:

$ grep mysqld /var/log/audit/audit.log | audit2allow -M {yourpolicyname}
$ grep mysqld /var/log/audit/audit.log | audit2allow -M mysql_new

You should see the output like the following (will differ depending on your policy name that you set):

******************** IMPORTANT ***********************

To make this policy package active, execute:


semodule -i mysql_new.pp

As stated, we need to execute “semodule -i mysql_new.pp” to activate the policy. Go ahead and execute it:

$ semodule -i mysql_new.pp

The final step is to put the MySQL domain back to the “enforcing” mode:

$ semanage permissive -d mysqld_t

libsemanage.semanage_direct_remove_key: Removing last permissive_mysqld_t module (no other permissive_mysqld_t module exists at another priority).

What Should You Do If SELinux is Not Working?

A lot of times, the SELinux configuration requires so much testing. One of the best ways to test the configuration is by changing the mode to “permissive”. If you want to set it only for the MySQL domain, you can just use the following command. This is good practice to avoid configuring the whole system to “permissive”:

$ semanage permissive -a mysqld_t

Once everything is done, you may change the mode back to the “enforcing”:

$ semanage permissive -d mysqld_t

In addition to that, /var/log/audit/audit.log provides all logs related to the SELinux. This log will help you a lot in identifying the root cause and the reason. All you have to do is to filter “denied” using “grep”.

$ more /var/log/audit/audit.log |grep "denied"

We are now finished with configuring SELinux policy for MySQL based system. One thing worth mentioning is that the same configuration needs to be done on all nodes of your cluster, you might need to repeat the same process for them.

Viewing all 210 articles
Browse latest View live